Housing density: 284 houses/condos per square mile
Median price asked for vacant for-sale houses and condos in 2022 in this county: $751,928.
Median contract rent in 2022: $1,745 (lower quartile is $1,106, upper quartile is over $2,000)
Median rent asked for vacant for-rent units in 2022: $1,782
Median gross rent in Cohasset, MA in 2022: $1,807
Housing units in Cohasset with a mortgage: 1,404 (83 second mortgage, 237 home equity loan, 0 both second mortgage and home equity loan) Houses without a mortgage: 624
In family households: 540,608 (116,996 male householders, 51,907 female householders)
134,066 spouses, 197,825 children (189,784 natural, 4,588 adopted, 3,453 stepchildren), 7,406 grandchildren, 6,062 brothers or sisters, 7,064 parents, foster children, 5,893 other relatives, 9,006 non-relatives
In nonfamily households: 112,631 (36,559 male householders (27,334 living alone)), 52,452 female householders (43,798 living alone)), 23,620 nonrelatives
In group quarters: 17,611 (8,991 institutionalized population)
123,500 married couples with children.
20,654 single-parent households (3,498 men, 17,156 women).
95.6% of residents of Cohasset speak English at home.
0.9% of residents speak Spanish at home (100% speak English very well).
3.4% of residents speak other Indo-European language at home (98% speak English very well, 2% speak English well).
0.1% of residents speak other language at home (100% speak English not well).
Foreign born population: 628 (7.8%)
(53.2% of them are naturalized citizens)
Year of entry for the foreign-born population in Cohasset, Massachusetts
471995 to March 2000
131990 to 1994
391985 to 1989
331980 to 1984
531975 to 1979
01970 to 1974
271965 to 1969
124Before 1965
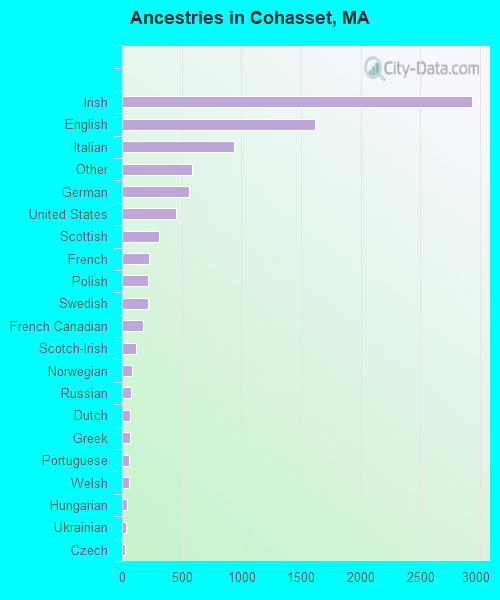
First ancestries reported:
Irish: 2,931 (32.8%)
English: 1,618 (18.1%)
Italian: 943 (10.5%)
Other: 589 (6.6%)
German: 559 (6.2%)
United States: 452 (5.1%)
Scottish: 310 (3.5%)
French: 229 (2.6%)
Polish: 221 (2.5%)
Swedish: 217 (2.4%)
French Canadian: 175 (2.0%)
Scotch-Irish: 121 (1.4%)
Norwegian: 80 (0.9%)
Russian: 73 (0.8%)
Dutch: 71 (0.8%)
Greek: 66 (0.7%)
Portuguese: 61 (0.7%)
Welsh: 55 (0.6%)
Hungarian: 44 (0.5%)
Ukrainian: 32 (0.4%)
Czech: 28 (0.3%)
Lithuanian: 22 (0.2%)
Swiss: 22 (0.2%)
Danish: 14 (0.2%)
Slovak: 13 (0.1%)
Most common places of birth for foreign-born residents (%):
United Kingdom
Cohasset:
38.1% (128)
Massachusetts:
3.3% (25,403)
Canada
Cohasset:
17.9% (60)
Massachusetts:
5.2% (40,247)
Germany
Cohasset:
8.6% (29)
Massachusetts:
1.9% (14,883)
Iran
Cohasset:
6.5% (22)
Massachusetts:
0.6% (4,416)
Venezuela
Cohasset:
5.7% (19)
Massachusetts:
0.3% (2,633)
Netherlands
Cohasset:
5.4% (18)
Massachusetts:
0.3% (2,470)
Spain
Cohasset:
4.8% (16)
Massachusetts:
0.3% (1,984)
Italy
Cohasset:
2.7% (9)
Massachusetts:
3.7% (28,319)
Ireland
Cohasset:
2.4% (8)
Massachusetts:
2.3% (17,987)
Other South Eastern Asia
Cohasset:
2.4% (8)
Massachusetts:
0.2% (1,659)
Colombia
Cohasset:
2.1% (7)
Massachusetts:
2.0% (15,286)
Poland
Cohasset:
1.8% (6)
Massachusetts:
1.8% (13,543)
Hong Kong
Cohasset:
1.8% (6)
Massachusetts:
1.0% (7,937)
Place of birth for U.S.-born residents:
This state: 4,866
Other state: 2,017
Northeast: 1,353
Midwest: 376
South: 194
West: 94
61% of Cohasset residents lived in the same house 5 years ago. Out of people who lived in different houses, 43% lived in this county. Out of people who lived in different counties, 61% lived in Massachusetts.
Education attainment for males 25 years and older:
No schooling: 0
Nursery to 4th grade: 0
5th and 6th grade: 0
7th and 8th grade: 0
9th grade: 0
10th grade: 17
11th grade: 38
12th grade, no diploma: 26
High school graduate (or equivalency): 362
Less than 1 year of college: 100
Some college more than 1 year, no degree: 133
Associate degree: 71
Bachelor's degree: 996
Master's degree: 338
Professional school degree: 199
Doctorate degree: 58
Education attainment for females 25 years and older:
No schooling: 0
Nursery to 4th grade: 0
5th and 6th grade: 6
7th and 8th grade: 4
9th grade: 12
10th grade: 13
11th grade: 0
12th grade, no diploma: 25
High school graduate (or equivalency): 371
Less than 1 year of college: 130
Some college more than 1 year, no degree: 391
Associate degree: 286
Bachelor's degree: 1,026
Master's degree: 277
Professional school degree: 130
Doctorate degree: 46
Housing units in structures:
One, detached: 2,328
One, attached: 60
Two: 151
3 or 4: 128
5 to 9: 77
10 to 19: 43
50 or more: 9
Boats, RVs, vans, etc.: 9
Housing units lacking complete plumbing facilities: 0.3%
Housing units lacking complete kitchen facilities: 0.6%