Colchester, IL (Illinois) Houses and Residents
| Colchester: | $83,025 |
| Illinois: | $251,600 |
Mean price in 2022:
Detached houses: $88,078
Here: $88,078 State: $310,164 Mobile homes: $316,478
Here: $316,478 State: $78,855
Total population: 1,354 (Urban population: 0, Rural population: 1,468 (all nonfarm))
Houses: 612 (539 occupied: 398 owner occupied, 147 renter occupied)
| % of renters here: | 27% |
| State: | 33% |
Housing density: 615 houses/condos per square mile
Median price asked for vacant for-sale houses and condos in 2022: $154,260.
Median contract rent in 2022: $374 (lower quartile is $330, upper quartile is $478)
Median rent asked for vacant for-rent units in 2022: $396
Median gross rent in Colchester, IL in 2022: $763
Housing units in Colchester with a mortgage: 217 (8 second mortgage, 0 home equity loan, 5 both second mortgage and home equity loan)
Houses without a mortgage: 0
Median household income for houses/condos with a mortgage: $57,230
Median household income for apartments without a mortgage: $59,622
Median monthly housing costs: $751
Compare current foreclosures near Colchester, IL:
| Photo | Address | Area | Beds / Baths | Price | Details |
|---|---|---|---|---|---|

|
#1
Lovejoy St
Colchester, IL 62326
|
- sq. feet
|
- baths - beds |
show details | |

|
#2
Heath Ct
Macomb, IL 61455
|
1,948 sq. feet
|
2 baths 3 beds |
show details | |

|
#3
W Piper St
Macomb, IL 61455
|
1,002 sq. feet
|
2 baths 2 beds |
show details | |

|
#4
E County Road 1300
Carthage, IL 62321
|
- sq. feet
|
3 baths 4 beds |
show details | |

|
#5
E Pierce St
Macomb, IL 61455
|
840 sq. feet
|
1 baths 2 beds |
show details | |

|
#6
E Washington St
Macomb, IL 61455
|
- sq. feet
|
1 baths 4 beds |
show details | |

|
#7
Chandler Blvd
Macomb, IL 61455
|
- sq. feet
|
1 baths 2 beds |
show details | |

|
#8
N Albert St
Macomb, IL 61455
|
- sq. feet
|
- baths - beds |
show details | |

|
#9
S Campbell St
Macomb, IL 61455
|
- sq. feet
|
- baths - beds |
show details | |

|
#10
Kentucky Ln
Plymouth, IL 62367
|
- sq. feet
|
- baths - beds |
show details |
| Photo | Address | Area | Beds / Baths | Price | Details |
|---|---|---|---|---|---|

|
#11
Reeveston Dr
Macomb, IL 61455
|
- sq. feet
|
- baths - beds |
show details | |

|
#12
River Run Dr
Macomb, IL 61455
|
- sq. feet
|
- baths - beds |
show details | |

|
#13
State Route 9
Blandinsville, IL 61420
|
- sq. feet
|
- baths - beds |
show details | |

|
#14
W Chase St
Macomb, IL 61455
|
- sq. feet
|
- baths - beds |
show details | |

|
#15
Debbie Ln
Macomb, IL 61455
|
- sq. feet
|
- baths - beds |
show details | |

|
#16
Front St
Bushnell, IL 61422
|
- sq. feet
|
- baths - beds |
show details | |

|
#17
E Main St
La Harpe, IL 61450
|
- sq. feet
|
- baths - beds |
show details | |

|
#18
E Main St
Plymouth, IL 62367
|
- sq. feet
|
- baths - beds |
show details | |

|
#19
Jamestown Rd
Macomb, IL 61455
|
- sq. feet
|
- baths - beds |
show details | |

|
#20
E Carroll St
Macomb, IL 61455
|
- sq. feet
|
- baths - beds |
show details |
| Photo | Address | Area | Beds / Baths | Price | Details |
|---|---|---|---|---|---|

|
#21
N Griffin St
Macomb, IL 61455
|
- sq. feet
|
- baths - beds |
show details | |

|
#22
N Monroe St
Macomb, IL 61455
|
- sq. feet
|
- baths - beds |
show details | |

|
#23
Stadium Dr
Macomb, IL 61455
|
- sq. feet
|
- baths - beds |
show details | |

|
#24
E Grant St
Macomb, IL 61455
|
- sq. feet
|
- baths - beds |
show details | |

|
#25
Penny Ln
Macomb, IL 61455
|
- sq. feet
|
- baths - beds |
show details | |

|
#26
Chandler Blvd
Macomb, IL 61455
|
- sq. feet
|
- baths - beds |
show details | |

|
#27
W Jefferson St
Macomb, IL 61455
|
- sq. feet
|
- baths - beds |
show details | |

|
#28
Pinecrest Dr
Macomb, IL 61455
|
- sq. feet
|
- baths - beds |
show details | |

|
#29
S Jackson St
Bushnell, IL 61422
|
- sq. feet
|
- baths - beds |
show details | |

|
Check over 1 million property listings on Foreclosure.com!
|
browse all offers | |||

Latest news about housing in Colchester, IL collected exclusively by city-data.com from local newspapers, TV, and radio stations


Median year apartment built: 1976
Household type by relationship:
Households: 1,104- Male householders: 238 (78 living alone), Female householders: 290 (100 living alone)
210 spouses (210 opposite-sex spouses), 39 unmarried partners, (39 opposite-sex unmarried partners), 271 children (260 natural, 2 adopted, 7 stepchildren), 0 grandchildren, 21 brothers or sisters, 0 parents, 0 foster children, 0 other relatives, 32 non-relatives
Size of family households: 188 2-persons, 28 3-persons, 76 4-persons, 8 5-persons.
Size of nonfamily households: 189 1-person, 51 2-persons, 9 3-persons.
99 married couples with children.
99 single-parent households (0 men, 99 women).
98.9% of residents of Colchester speak English at home.
0.6% of residents speak Spanish at home (100% speak English not well).
Foreign born population: 7 (0.6%)
(0.0% of them are naturalized citizens)
| Here: | 6.0 |
| State: | 6.4 |
| Here: | 4.2 |
| State: | 4.1 |

- Bedrooms in owner-occupied houses and condos in Colchester, Illinois
- 0no bedroom
- 01 bedroom
- 1362 bedrooms
- 2413 bedrooms
- 134 bedrooms
- 85+ bedrooms

- Bedrooms in renter-occupied apartments in Colchester, Illinois
- 0no bedroom
- 251 bedroom
- 732 bedrooms
- 363 bedrooms
- 134 bedrooms
- 05+ bedrooms

- Cars and other vehicles available in Colchester in owner-occupied houses/condos
- 13no vehicle
- 1461 vehicle
- 1602 vehicles
- 453 vehicles
- 344 vehicles
- 25+ vehicles

- Cars and other vehicles available in Colchester in renter-occupied apartments
- 13no vehicle
- 401 vehicle
- 672 vehicles
- 163 vehicles
- 114 vehicles
- 05+ vehicles

- Rooms in owner-occupied houses in Colchester, Illinois
- 01 room
- 02 rooms
- 43 rooms
- 494 rooms
- 915 rooms
- 1196 rooms
- 837 rooms
- 378 rooms
- 169+ rooms

- Rooms in renter-occupied apartments in Colchester, Illinois
- 01 room
- 02 rooms
- 253 rooms
- 604 rooms
- 185 rooms
- 156 rooms
- 147 rooms
- 118 rooms
- 39+ rooms


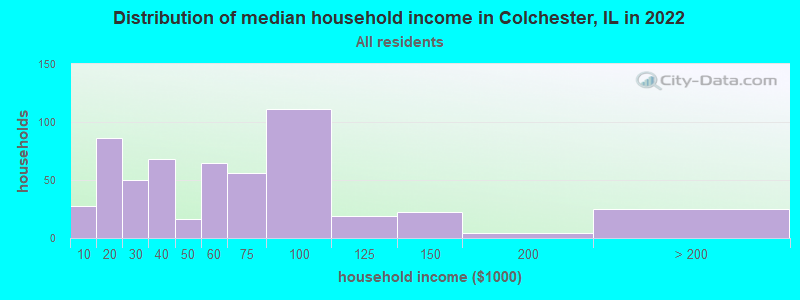
Colchester, IL household income distribution

- 28Less than $10,000
- 86$10,000 to $19,999
- 50$20,000 to $29,999
- 68$30,000 to $39,999
- 16$40,000 to $49,999
- 65$50,000 to $59,999
- 56$60,000 to $74,999
- 111$75,000 to $99,999
- 19$100,000 to $124,999
- 22$125,000 to $149,999
- 4$150,000 to $199,999
- 25$200,000 or more
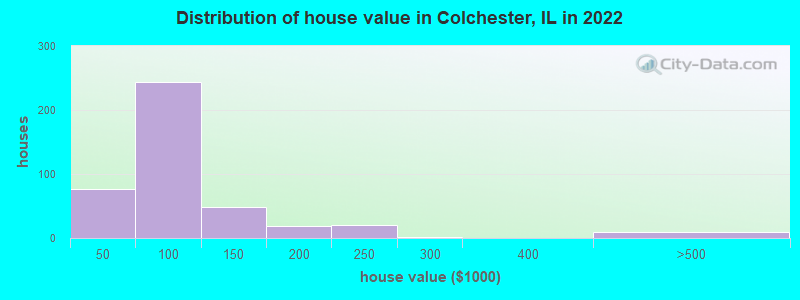
Home value of owner - occupied houses in 2022 in Colchester, IL
-
- 3Less than $10,000
- 4$10,000 to $14,999
- 6$15,000 to $19,999
- 11$20,000 to $24,999
- 11$25,000 to $29,999
- 1$30,000 to $34,999
- 2$35,000 to $39,999
- 34$40,000 to $49,999
- 32$50,000 to $59,999
- 36$60,000 to $69,999
- 58$70,000 to $79,999
- 49$80,000 to $89,999
- 31$90,000 to $99,999
- 27$100,000 to $124,999
- 20$125,000 to $149,999
- 15$150,000 to $174,999
- 1$175,000 to $199,999
- 20$200,000 to $249,999
- 2$250,000 to $299,999
- 5$400,000 to $499,999
- 4$500,000 to $749,999
Rent paid by renters in 2022 in Colchester, IL
-
- 10$150 to $199
- 30$300 to $349
- 37$350 to $399
- 7$400 to $449
- 11$450 to $499
- 4$500 to $549
- 5$550 to $599
- 2$600 to $649
- 10$1,500 to $1,999
- 27No cash rent


Percentage of workers working in this county: 87.1%
Number of people working at home: 31 (5.1% of all workers)
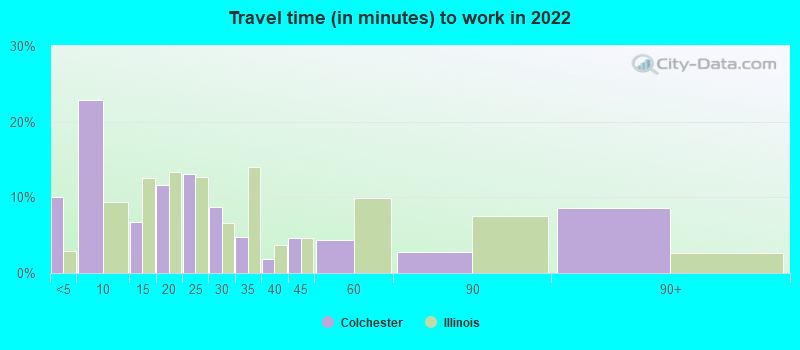
Travel time to work (commute)
- Less than 5 minutes: 54
- 5 to 9 minutes: 64
- 10 to 14 minutes: 69
- 15 to 19 minutes: 185
- 20 to 24 minutes: 88
- 25 to 29 minutes: 61
- 30 to 34 minutes: 1
- 35 to 39 minutes: 2
- 40 to 44 minutes: 0
- 45 to 59 minutes: 24
- 60 to 89 minutes: 9
- 90 or more minutes: 0
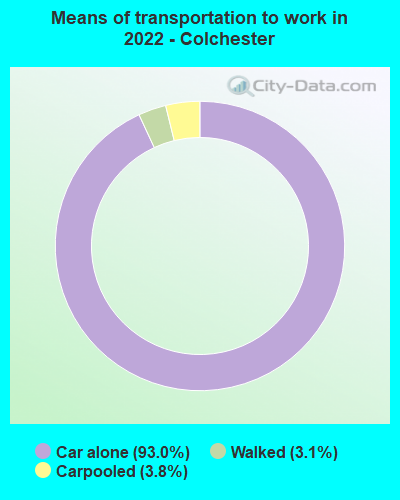
Means of transportation to work:
- Drove a car alone: 401 (85.1%)
- Carpooled: 17 (3.6%)
- Walked: 13 (2.8%)
- Worked at home: 31 (6.6%)

- Unemployment by race in 2022
- Unemployment rate for White non-Hispanic residents
- 4.2%Males
- 1.8%Females
- Unemployment rate for two or more race residents
- 100.0%Females
- Unemployment rate for Hispanic or Latino residents
- 100.0%Females

- Year of entry for the foreign-born population in Colchester, Illinois
- 82010 or later
- 02000 to 2009
- 01990 to 1999
- 61980 to 1989
- 01970 to 1979
- 6Before 1970

First ancestries reported:
- English: 177 (42.6%)
- German: 108 (26.0%)
- American: 40 (9.6%)
- Welsh: 17 (4.1%)
- Polish: 12 (2.9%)
- Dutch: 10 (2.4%)
- European: 6 (1.4%)
- Northern European: 5 (1.2%)
- Scottish: 5 (1.2%)
- Norwegian: 4 (1.0%)
- Irish: 3 (0.7%)
- Lebanese: 2 (0.5%)
- Czech: 1 (0.2%)
- French Canadian: 1 (0.2%)
Most common places of birth for foreign-born residents (%):
| Colchester: | 85.7% (6) |
| Illinois: | 34.7% (626,958) |
Place of birth for U.S.-born residents:
- This state: 901
- Other state: 184
- Northeast: 20
- Midwest: 73
- South: 84
- West: 5
91.9% of Colchester residents lived in the same house 1 years ago.
Out of people who lived in different houses, 26.1% lived in this county.
Out of people who lived in different counties, 52.4% lived in Illinois.
| Colchester: | 91.9% |
| State average: | 88.3% |
Education attainment for males 25 years and older:
- No schooling: 2
- Nursery to 4th grade: 0
- 5th and 6th grade: 0
- 7th and 8th grade: 7
- 9th grade: 0
- 10th grade: 10
- 11th grade: 21
- 12th grade, no diploma: 16
- High school graduate (or equivalency): 188
- Less than 1 year of college: 8
- Some college more than 1 year, no degree: 20
- Associate degree: 26
- Bachelor's degree: 52
- Master's degree: 13
- Professional school degree: 9
- Doctorate degree: 6

Education attainment for females 25 years and older:
- No schooling: 0
- Nursery to 4th grade: 0
- 5th and 6th grade: 0
- 7th and 8th grade: 0
- 9th grade: 3
- 10th grade: 8
- 11th grade: 6
- 12th grade, no diploma: 1
- High school graduate (or equivalency): 142
- Less than 1 year of college: 45
- Some college more than 1 year, no degree: 38
- Associate degree: 120
- Bachelor's degree: 76
- Master's degree: 5
- Professional school degree: 0
- Doctorate degree: 3


Housing units in structures:
- One, detached: 549
- One, attached: 1
- Two: 3
- 3 or 4: 16
- 5 to 9: 2
- Mobile homes: 41
Housing units lacking complete kitchen facilities in 2022: 1.8%
House/condo owner moved in on average 15 years ago
Renter moved in on average 5 years ago

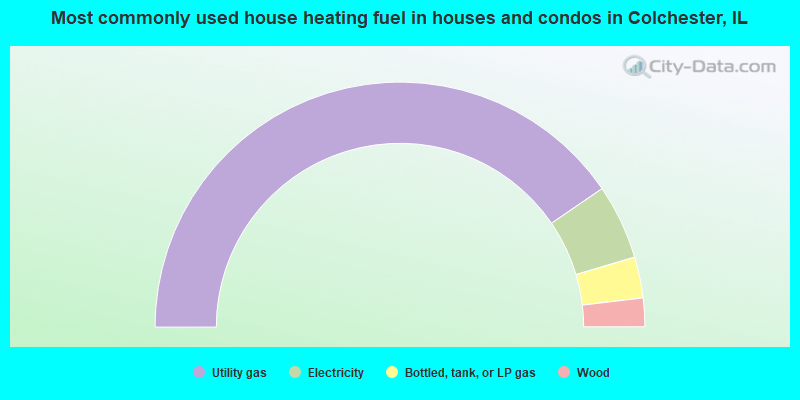
- 80.9%Utility gas
- 9.9%Electricity
- 5.4%Bottled, tank, or LP gas
- 3.8%Wood
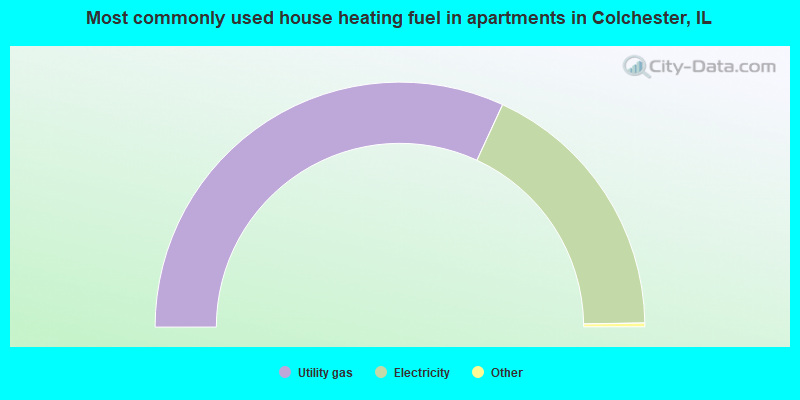
- 64.1%Utility gas
- 35.9%Electricity
Private vs. public school enrollment:
| Here: | 15.3% |
| Illinois: | 13.3% |
| Here: | 0.0% |
| Illinois: | 9.9% |
| Here: | 0.0% |
| Illinois: | 27.4% |


