Colebrook, CT (Connecticut) Houses and Residents
| Colebrook: | $396,275 |
| Connecticut: | $347,200 |
Total population: 1,485 (Urban population: 0, Rural population: 1,471 (27 farm, 1,444 nonfarm))
Houses: 656 (566 occupied: 490 owner occupied, 76 renter occupied)
| % of renters here: | 13% |
| State: | 34% |
Housing density: 21 houses/condos per square mile
Median price asked for vacant for-sale houses and condos in 2022 in this county: $399,480.
Median contract rent in 2022: $1,443 (lower quartile is $932, upper quartile is $1,893)
Median rent asked for vacant for-rent units in 2022: $836
Median gross rent in Colebrook, CT in 2022: $1,797
Housing units in Colebrook with a mortgage: 256 (11 second mortgage, 8 home equity loan, 0 both second mortgage and home equity loan)
Houses without a mortgage: 114
Compare current foreclosures near Colebrook, CT:
| Photo | Address | Area | Beds / Baths | Price | Details |
|---|---|---|---|---|---|

|
#1
Litchfield Rd
Norfolk, CT 06058
|
3,678 sq. feet
|
3 baths 6 beds |
$650,000
|
show details |

|
#2
Woodbine St
Torrington, CT 06790
|
2,756 sq. feet
|
3 baths 6 beds |
$419,900
|
show details |

|
#3
Dowd Ave
Canton, CT 06019
|
1,190 sq. feet
|
1 baths 2 beds |
$239,900
|
show details |

|
#4
Litchfield Rd
Harwinton, CT 06791
|
2,216 sq. feet
|
1 baths 3 beds |
show details | |

|
#5
Bch St
Goshen, CT 06756
|
1,380 sq. feet
|
1 baths 4 beds |
show details | |

|
#6
Russell Stage Rd
Blandford, MA 01008
|
1,650 sq. feet
|
2 baths 3 beds |
show details | |

|
#7
E Hill Rd Apt 4d
Canton, CT 06019
|
1,116 sq. feet
|
2 baths 2 beds |
show details | |

|
#8
Benton St
Winsted, CT 06098
|
1,109 sq. feet
|
2 baths 2 beds |
show details | |

|
#9
Marcia Dr
Torrington, CT 06790
|
1,496 sq. feet
|
2 baths 4 beds |
show details | |

|
#10
Torcon Dr
Torrington, CT 06790
|
1,336 sq. feet
|
1 baths 2 beds |
show details |
| Photo | Address | Area | Beds / Baths | Price | Details |
|---|---|---|---|---|---|

|
#11
Willow St
Torrington, CT 06790
|
2,076 sq. feet
|
2 baths 5 beds |
show details | |

|
#12
Pearl St
Torrington, CT 06790
|
1,344 sq. feet
|
1 baths 2 beds |
show details | |

|
#13
Fairlawn Dr
Torrington, CT 06790
|
1,549 sq. feet
|
1 baths 3 beds |
show details | |

|
#14
Cherry St
Torrington, CT 06790
|
2,398 sq. feet
|
3 baths 9 beds |
show details | |

|
#15
Main Rd
Granville, MA 01034
|
2,809 sq. feet
|
3 baths 5 beds |
show details | |

|
#16
Madison Ln
West Simsbury, CT 06092
|
2,295 sq. feet
|
2 baths 4 beds |
show details | |

|
#17
Berry St
Torrington, CT 06790
|
2,496 sq. feet
|
3 baths 6 beds |
show details | |

|
#18
Moore Dr
Torrington, CT 06790
|
1,236 sq. feet
|
2 baths 3 beds |
show details | |

|
#19
Nelson St
Torrington, CT 06790
|
1,256 sq. feet
|
1 baths 3 beds |
show details | |

|
#20
Litchfield St # 1
Torrington, CT 06790
|
1,990 sq. feet
|
2 baths 4 beds |
show details |
| Photo | Address | Area | Beds / Baths | Price | Details |
|---|---|---|---|---|---|

|
#21
Funston Ave
Torrington, CT 06790
|
1,176 sq. feet
|
1 baths 3 beds |
show details | |

|
#22
Cooper St
Torrington, CT 06790
|
3,913 sq. feet
|
2 baths 6 beds |
show details | |

|
#23
Calhoun St
Torrington, CT 06790
|
1,740 sq. feet
|
2 baths 6 beds |
show details | |

|
#24
Vista Dr
Harwinton, CT 06791
|
1,933 sq. feet
|
1 baths 3 beds |
show details | |

|
#25
Loomis St
North Granby, CT 06060
|
1,616 sq. feet
|
2 baths 4 beds |
show details | |

|
#26
New Litchfield St
Torrington, CT 06790
|
1,325 sq. feet
|
1 baths 3 beds |
show details | |

|
#27
Hillcrest St
Torrington, CT 06790
|
1,230 sq. feet
|
2 baths 3 beds |
show details | |

|
#28
County Rd
Great Barrington, MA 01230
|
1,576 sq. feet
|
1 baths 4 beds |
show details | |

|
#29
Highridge Dr
Granby, CT 06035
|
2,344 sq. feet
|
2 baths 3 beds |
show details | |

|
#30
Blair Rd
Blandford, MA 01008
|
1,580 sq. feet
|
1 baths 3 beds |
show details |
| Photo | Address | Area | Beds / Baths | Price | Details |
|---|---|---|---|---|---|

|
#31
Windham Dr
Simsbury, CT 06070
|
2,334 sq. feet
|
2 baths 4 beds |
show details | |

|
#32
Hart Dr
Litchfield, CT 06759
|
936 sq. feet
|
1 baths 2 beds |
show details | |

|
#33
High Hill Rd
Canton, CT 06019
|
- sq. feet
|
2 baths 3 beds |
show details | |

|
#34
Nutmeg Dr
Torrington, CT 06790
|
872 sq. feet
|
1 baths 4 beds |
show details | |

|
#35
Mcguinness St
Torrington, CT 06790
|
1,049 sq. feet
|
1 baths 3 beds |
show details | |

|
#36
Ed Holcomb Rd
Southwick, MA 01077
|
1,088 sq. feet
|
2 baths 3 beds |
show details | |

|
#37
Charles Johnson Rd
Southwick, MA 01077
|
2,082 sq. feet
|
2 baths 3 beds |
show details | |

|
#38
Wildcat Hill Rd
Harwinton, CT 06791
|
1,834 sq. feet
|
2 baths 4 beds |
show details | |

|
#39
Hillside Pl
Winsted, CT 06098
|
1,861 sq. feet
|
1 baths 3 beds |
show details | |

|
#40
N Main St
Winsted, CT 06098
|
1,839 sq. feet
|
2 baths 4 beds |
show details |
| Photo | Address | Area | Beds / Baths | Price | Details |
|---|---|---|---|---|---|

|
#41
E Mountain Ave
Winsted, CT 06098
|
1,835 sq. feet
|
2 baths 4 beds |
show details | |

|
#42
Winterset Ln
Simsbury, CT 06070
|
2,608 sq. feet
|
2 baths 4 beds |
show details | |

|
#43
Strong Ter
Winsted, CT 06098
|
1,590 sq. feet
|
1 baths 4 beds |
show details | |

|
#44
Great Pond Rd
Simsbury, CT 06070
|
2,053 sq. feet
|
3 baths 3 beds |
show details | |

|
#45
Granville Rd
Westfield, MA 01085
|
3,159 sq. feet
|
1 baths 3 beds |
show details | |

|
#46
S Sandisfield Rd
Great Barrington, MA 01230
|
1,983 sq. feet
|
2 baths 2 beds |
show details | |

|
#47
Greenwoods Rd
Torrington, CT 06790
|
1,038 sq. feet
|
1 baths 3 beds |
show details | |

|
#48
Greenwoods Rd
Torrington, CT 06790
|
1,848 sq. feet
|
1 baths 3 beds |
show details | |

|
#49
Cedar Ln
Torrington, CT 06790
|
1,502 sq. feet
|
2 baths 3 beds |
show details | |

|
Check over 1 million property listings on Foreclosure.com!
|
browse all offers | |||
Latest news about housing in Colebrook, CT collected exclusively by city-data.com from local newspapers, TV, and radio stations

 | 2024 Connecticut Town Tournament VI (Celebrating the 10-Year Anniversary & Dazzleman's Memorial) (1044 replies) |
| Connecticut TOWN TOURNAMENT V (2022) (831 replies) |
| Connecticut Weekend (21 replies) |
| Connecticut TOWN TOURNAMENT IV (2020) (849 replies) |
| Retirement Move from Newton, MA to CT (44 replies) |
| Economic Climate in CT (18750 replies) |

Household type by relationship:
Households: 187,123- In family households: 156,490 (36,561 male householders, 14,969 female householders)
41,185 spouses, 52,814 children (49,404 natural, 1,325 adopted, 2,085 stepchildren), 2,365 grandchildren, 1,073 brothers or sisters, 1,650 parents, foster children, 1,216 other relatives, 3,500 non-relatives
- In nonfamily households: 30,633 (11,692 male householders (9,019 living alone)), 13,418 female householders (11,384 living alone)), 5,523 nonrelatives
- In group quarters: 2,804 (1,566 institutionalized population)
34,479 married couples with children.
7,472 single-parent households (1,895 men, 5,577 women).
95.3% of residents of Colebrook speak English at home.
1.0% of residents speak Spanish at home (86% speak English very well, 14% speak English well).
3.6% of residents speak other Indo-European language at home (96% speak English very well, 4% speak English well).
0.1% of residents speak Asian or Pacific Island language at home (100% speak English very well).
Foreign born population: 121 (6.8%)
(69.4% of them are naturalized citizens)
| Here: | 7.2 |
| State: | 6.5 |
| Here: | 5.9 |
| State: | 4.0 |

- Bedrooms in owner-occupied houses and condos in Colebrook, Connecticut
- 0no bedroom
- 131 bedroom
- 832 bedrooms
- 2763 bedrooms
- 914 bedrooms
- 275+ bedrooms

- Bedrooms in renter-occupied apartments in Colebrook, Connecticut
- 4no bedroom
- 151 bedroom
- 272 bedrooms
- 213 bedrooms
- 64 bedrooms
- 35+ bedrooms

- Cars and other vehicles available in Colebrook in owner-occupied houses/condos
- 9no vehicle
- 951 vehicle
- 2342 vehicles
- 1103 vehicles
- 284 vehicles
- 145+ vehicles

- Cars and other vehicles available in Colebrook in renter-occupied apartments
- 0no vehicle
- 301 vehicle
- 332 vehicles
- 73 vehicles
- 44 vehicles
- 25+ vehicles

- Rooms in owner-occupied houses in Colebrook, Connecticut
- 01 room
- 42 rooms
- 63 rooms
- 334 rooms
- 795 rooms
- 1466 rooms
- 807 rooms
- 558 rooms
- 879+ rooms

- Rooms in renter-occupied apartments in Colebrook, Connecticut
- 21 room
- 62 rooms
- 93 rooms
- 104 rooms
- 175 rooms
- 136 rooms
- 97 rooms
- 108 rooms
- 09+ rooms


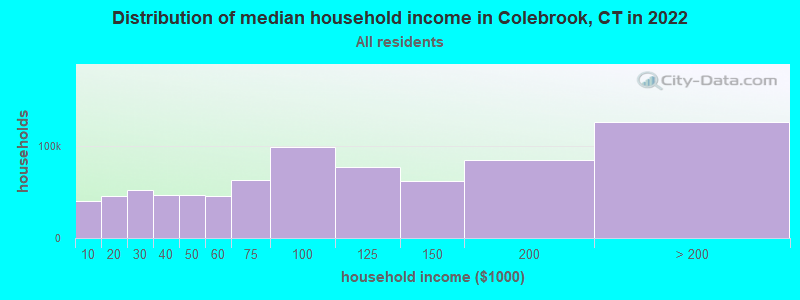
Colebrook, CT household income distribution

- 4,439Less than $10,000
- 3,603$10,000 to $19,999
- 5,634$20,000 to $29,999
- 7,266$30,000 to $39,999
- 5,883$40,000 to $49,999
- 7,127$50,000 to $59,999
- 13,794$60,000 to $74,999
- 19,929$75,000 to $99,999
- 19,006$100,000 to $124,999
- 15,321$125,000 to $149,999
- 22,055$150,000 to $199,999
- 40,556$200,000 or more
Percentage of workers working in this county: 78.6%
Number of people working at home: 170 (18.7% of all workers)
Travel time to work (commute)
- Less than 5 minutes: 31
- 5 to 9 minutes: 52
- 10 to 14 minutes: 77
- 15 to 19 minutes: 75
- 20 to 24 minutes: 99
- 25 to 29 minutes: 23
- 30 to 34 minutes: 124
- 35 to 39 minutes: 22
- 40 to 44 minutes: 57
- 45 to 59 minutes: 87
- 60 to 89 minutes: 66
- 90 or more minutes: 24
Means of transportation to work:
- Drove a car alone: 650 (83.9%)
- Carpooled: 49 (6.3%)
- Bus or trolley bus: 4 (0.5%)
- Railroad: 3 (0.4%)
- Motorcycle: 2 (0.3%)
- Bicycle: 2 (0.3%)
- Walked: 22 (2.8%)
- Other means: 5 (0.6%)
- Worked at home: 38 (4.9%)


- Year of entry for the foreign-born population in Colebrook, Connecticut
- 101995 to March 2000
- 131990 to 1994
- 51985 to 1989
- 21980 to 1984
- 01975 to 1979
- 61970 to 1974
- 71965 to 1969
- 30Before 1965

First ancestries reported:
- English: 356 (18.8%)
- Irish: 244 (12.9%)
- Italian: 209 (11.0%)
- French: 172 (9.1%)
- German: 164 (8.7%)
- Other: 155 (8.2%)
- United States: 139 (7.3%)
- Polish: 69 (3.6%)
- Scottish: 67 (3.5%)
- Swedish: 67 (3.5%)
- French Canadian: 65 (3.4%)
- Scotch-Irish: 52 (2.7%)
- Dutch: 21 (1.1%)
- Lithuanian: 21 (1.1%)
- Russian: 17 (0.9%)
- Czech: 11 (0.6%)
- Norwegian: 10 (0.5%)
- Ukrainian: 10 (0.5%)
- Slovak: 9 (0.5%)
- Danish: 8 (0.4%)
- Greek: 8 (0.4%)
- Arab: 5 (0.3%)
- Hungarian: 5 (0.3%)
- Swiss: 5 (0.3%)
- Welsh: 3 (0.2%)
- Portuguese: 2 (0.1%)
Most common places of birth for foreign-born residents (%):
| Colebrook: | 30.1% (22) |
| Connecticut: | 4.4% (16,395) |
| Colebrook: | 15.1% (11) |
| Connecticut: | 3.1% (11,432) |
| Colebrook: | 8.2% (6) |
| Connecticut: | 0.5% (1,983) |
| Colebrook: | 8.2% (6) |
| Connecticut: | 4.1% (15,108) |
| Colebrook: | 8.2% (6) |
| Connecticut: | 2.4% (9,020) |
| Colebrook: | 6.8% (5) |
| Connecticut: | 5.2% (19,083) |
| Colebrook: | 4.1% (3) |
| Connecticut: | 0.5% (1,894) |
| Colebrook: | 2.7% (2) |
| Connecticut: | 0.6% (2,220) |
| Colebrook: | 2.7% (2) |
| Connecticut: | 3.6% (13,234) |
| Colebrook: | 2.7% (2) |
| Connecticut: | 0.4% (1,463) |
| Colebrook: | 2.7% (2) |
| Connecticut: | 1.0% (3,822) |
| Colebrook: | 2.7% (2) |
| Connecticut: | 0.2% (566) |
| Colebrook: | 2.7% (2) |
| Connecticut: | 1.7% (6,247) |
| Colebrook: | 2.7% (2) |
| Connecticut: | 3.6% (13,282) |
Place of birth for U.S.-born residents:
- This state: 1,035
- Other state: 355
- Northeast: 254
- Midwest: 40
- South: 54
- West: 7
70% of Colebrook residents lived in the same house 5 years ago.
Out of people who lived in different houses, 71% lived in this county.
Out of people who lived in different counties, 38% lived in Connecticut.
Education attainment for males 25 years and older:
- No schooling: 0
- Nursery to 4th grade: 0
- 5th and 6th grade: 2
- 7th and 8th grade: 13
- 9th grade: 0
- 10th grade: 12
- 11th grade: 11
- 12th grade, no diploma: 17
- High school graduate (or equivalency): 175
- Less than 1 year of college: 24
- Some college more than 1 year, no degree: 69
- Associate degree: 36
- Bachelor's degree: 83
- Master's degree: 45
- Professional school degree: 17
- Doctorate degree: 9

Education attainment for females 25 years and older:
- No schooling: 0
- Nursery to 4th grade: 0
- 5th and 6th grade: 0
- 7th and 8th grade: 2
- 9th grade: 10
- 10th grade: 7
- 11th grade: 5
- 12th grade, no diploma: 23
- High school graduate (or equivalency): 148
- Less than 1 year of college: 30
- Some college more than 1 year, no degree: 55
- Associate degree: 56
- Bachelor's degree: 99
- Master's degree: 82
- Professional school degree: 4
- Doctorate degree: 11


Housing units in structures:
- One, detached: 627
- One, attached: 7
- Two: 18
- 3 or 4: 4
Housing units lacking complete kitchen facilities: 2.3%

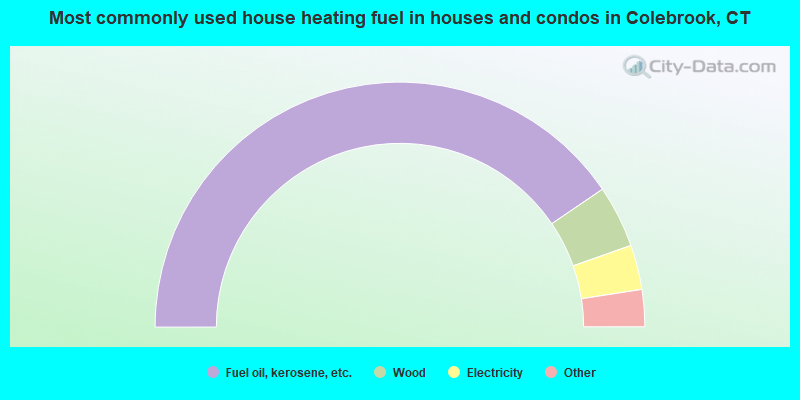
- 81.0%Fuel oil, kerosene, etc.
- 8.2%Wood
- 5.9%Electricity
- 3.7%Bottled, tank, or LP gas
- 0.8%Solar energy
- 0.4%Other fuel
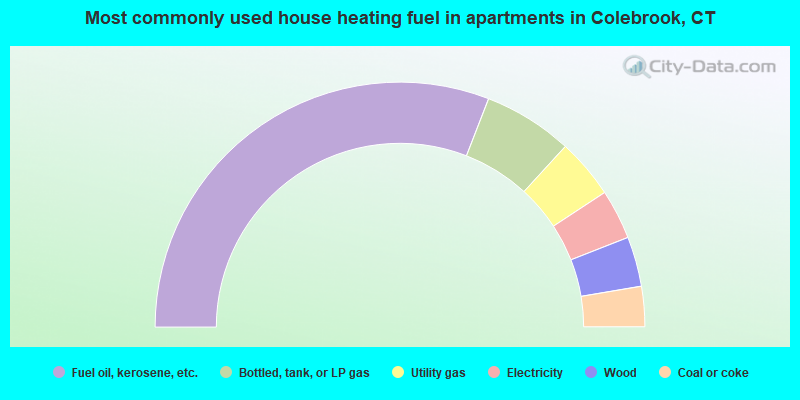
- 61.8%Fuel oil, kerosene, etc.
- 11.8%Bottled, tank, or LP gas
- 7.9%Utility gas
- 6.6%Electricity
- 6.6%Wood
- 5.3%Coal or coke
Private vs. public school enrollment:
| Here: | 8.7% |
| Connecticut: | 9.9% |
| Here: | 7.8% |
| Connecticut: | 11.0% |
| Here: | 14.0% |
| Connecticut: | 33.4% |


