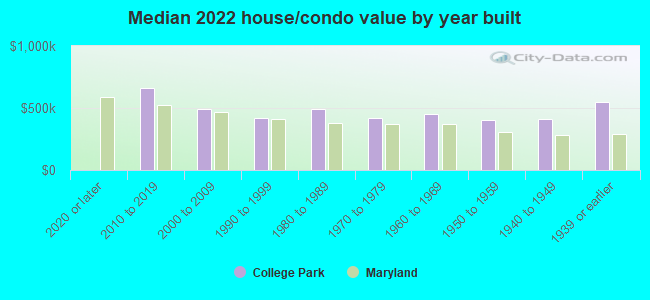
College Park, MD (Maryland) Houses and Residents
| College Park: | $436,927 |
| Maryland: | $398,100 |
Mean price in 2022:
Detached houses: $414,165
Here: $414,165 State: $526,819 Townhouses or other attached units: $345,174
Here: $345,174 State: $328,305 In 5-or-more-unit structures: $142,964
Here: $142,964 State: $350,378
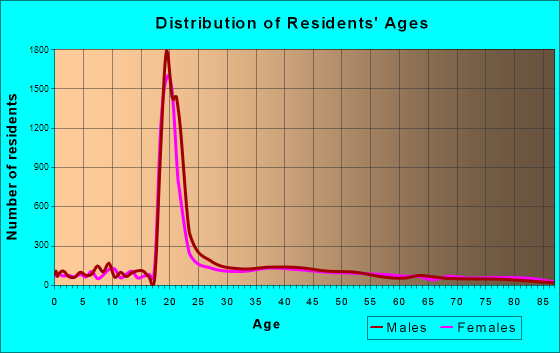
Total population: 32,256 (Urban population: 24,590, Rural population: 0)
Houses: 9,886 (8,953 occupied: 3,678 owner occupied, 5,316 renter occupied)
| % of renters here: | 59% |
| State: | 32% |
Housing density: 1,819 houses/condos per square mile
Median price asked for vacant for-sale houses and condos in 2022: $439,584.
Median contract rent in 2022: $1,595 (lower quartile is $1,051, upper quartile is over $2,000)
Median rent asked for vacant for-rent units in 2022: $2,309
Median gross rent in College Park, MD in 2022: $1,767
Housing units in College Park with a mortgage: 2,392 (239 second mortgage, 0 home equity loan, 255 both second mortgage and home equity loan)
Houses without a mortgage: 47
Median household income for houses/condos with a mortgage: $121,750
Median household income for apartments without a mortgage: $98,764
Median monthly housing costs: $1,712
Compare current foreclosures near College Park, MD:
| Photo | Address | Area | Beds / Baths | Price | Details |
|---|---|---|---|---|---|

|
#1
51st Ave
College Park, MD 20740
|
1,728 sq. feet
|
2 baths - beds |
show details | |

|
#2
Seminole Pl
College Park, MD 20740
|
1,168 sq. feet
|
2 baths - beds |
show details | |

|
#3
Wellesley Dr
College Park, MD 20740
|
1,177 sq. feet
|
2 baths - beds |
show details | |

|
#4
Muskogee St
College Park, MD 20740
|
1,139 sq. feet
|
1 baths - beds |
show details | |

|
#5
Stewart Ct
College Park, MD 20740
|
1,176 sq. feet
|
2 baths - beds |
show details | |

|
#6
48th Ave
College Park, MD 20740
|
960 sq. feet
|
3 baths - beds |
show details | |

|
#7
57th Ave
College Park, MD 20740
|
936 sq. feet
|
1 baths - beds |
show details | |

|
#8
Berwyn Rd
College Park, MD 20740
|
2,352 sq. feet
|
2 baths - beds |
show details | |

|
#9
Paducah Rd
College Park, MD 20740
|
1,176 sq. feet
|
2 baths - beds |
show details | |

|
#10
De Pauw Pl
College Park, MD 20740
|
- sq. feet
|
- baths - beds |
show details |
| Photo | Address | Area | Beds / Baths | Price | Details |
|---|---|---|---|---|---|

|
#11
Westchester Park Dr Apt 814
College Park, MD 20740
|
1,260 sq. feet
|
- baths - beds |
show details | |

|
#12
Cathedral Ave NW Apt 108
Washington, DC 20016
|
765 sq. feet
|
1 baths 1 beds |
$269,900
|
show details |

|
#13
Interlachen Dr Apt 111
Silver Spring, MD 20906
|
965 sq. feet
|
1 baths 2 beds |
$148,000
|
show details |

|
#14
9th St NW
Washington, DC 20011
|
1,604 sq. feet
|
2 baths 3 beds |
$598,000
|
show details |

|
#15
Gladys Retreat Cir
Bowie, MD 20720
|
2,880 sq. feet
|
3 baths 3 beds |
$409,900
|
show details |

|
#16
Ensleigh Ln
Bowie, MD 20716
|
1,656 sq. feet
|
2 baths 3 beds |
$374,900
|
show details |

|
#17
Addison Rd
Capitol Heights, MD 20743
|
1,400 sq. feet
|
1 baths 3 beds |
$260,000
|
show details |

|
#18
17th St NW Apt 504
Washington, DC 20009
|
800 sq. feet
|
1 baths 1 beds |
$405,000
|
show details |

|
#19
Henson Ln
Temple Hills, MD 20748
|
1,566 sq. feet
|
2 baths 3 beds |
$300,000
|
show details |

|
#20
Eastern Ave NE
Washington, DC 20011
|
1,024 sq. feet
|
1 baths 3 beds |
$395,000
|
show details |
| Photo | Address | Area | Beds / Baths | Price | Details |
|---|---|---|---|---|---|

|
#21
Hammersmith Cir
Silver Spring, MD 20906
|
1,152 sq. feet
|
1 baths 3 beds |
$353,600
|
show details |

|
#22
Elkhorn Ln
Bowie, MD 20716
|
1,514 sq. feet
|
2 baths 3 beds |
$425,250
|
show details |

|
#23
Monroe St NW
Washington, DC 20010
|
- sq. feet
|
2 baths 2 beds |
$665,000
|
show details |

|
#24
Heming Ln
Bowie, MD 20716
|
1,800 sq. feet
|
2 baths 3 beds |
$400,000
|
show details |

|
#25
Pooks Hill Rd Apt 1612s
Bethesda, MD 20814
|
1,250 sq. feet
|
1 baths 2 beds |
$289,000
|
show details |

|
#26
Pickett Dr
Suitland, MD 20746
|
1,296 sq. feet
|
1 baths 2 beds |
$349,900
|
show details |

|
#27
Baltimore Ave # 131
College Park, MD 20740
|
- sq. feet
|
- baths - beds |
show details | |

|
#28
Delaware Ave SW Apt N720
Washington, DC 20024
|
- sq. feet
|
1 baths 1 beds |
$149,900
|
show details |

|
#29
Brooke Ln
Upper Marlboro, MD 20772
|
- sq. feet
|
5 baths 6 beds |
$949,000
|
show details |

|
#30
Mandan Rd Apt 103 Unit 621
Greenbelt, MD 20770
|
- sq. feet
|
2 baths 3 beds |
$179,900
|
show details |
| Photo | Address | Area | Beds / Baths | Price | Details |
|---|---|---|---|---|---|

|
#31
T St SE Apt 3
Washington, DC 20020
|
- sq. feet
|
2 baths 4 beds |
$339,900
|
show details |

|
#32
Holbrook Ter NE
Washington, DC 20002
|
3,164 sq. feet
|
4 baths 8 beds |
show details | |

|
#33
Hill Way
Suitland, MD 20746
|
1,539 sq. feet
|
2 baths 4 beds |
show details | |

|
#34
Coronella Ct
Upper Marlboro, MD 20774
|
3,386 sq. feet
|
6 baths 6 beds |
show details | |

|
#35
Avena St
Silver Spring, MD 20902
|
1,188 sq. feet
|
2 baths 3 beds |
show details | |

|
#36
Sargent Rd NE
Washington, DC 20017
|
1,360 sq. feet
|
2 baths 3 beds |
show details | |

|
#37
Brandywine St SE Apt B1
Washington, DC 20032
|
822 sq. feet
|
1 baths 2 beds |
show details | |

|
#38
Ridge Rd SE
Washington, DC 20019
|
720 sq. feet
|
2 baths 1 beds |
show details | |

|
#39
16th St NW Apt 305
Washington, DC 20009
|
1,158 sq. feet
|
1 baths 2 beds |
show details | |

|
#40
Fern Pl NW
Washington, DC 20012
|
1,920 sq. feet
|
1 baths 4 beds |
show details |
| Photo | Address | Area | Beds / Baths | Price | Details |
|---|---|---|---|---|---|

|
#41
Henderson Chapel Ln
Bowie, MD 20720
|
4,002 sq. feet
|
3 baths 4 beds |
show details | |

|
#42
Byers St
Capitol Heights, MD 20743
|
2,238 sq. feet
|
2 baths 2 beds |
show details | |

|
#43
Newton Ct
Upper Marlboro, MD 20772
|
1,092 sq. feet
|
2 baths 3 beds |
show details | |

|
#44
Cathedral Ave NW Apt 404w
Washington, DC 20016
|
803 sq. feet
|
1 baths 1 beds |
show details | |

|
#45
S George Mason Dr Unit 918n
Falls Church, VA 22041
|
752 sq. feet
|
1 baths 1 beds |
show details | |

|
#46
Barnaby St SE
Washington, DC 20032
|
1,664 sq. feet
|
2 baths 3 beds |
show details | |

|
#47
Pearl Fog Way
Dunn Loring, VA 22027
|
3,497 sq. feet
|
4 baths 4 beds |
show details | |

|
#48
T Pl SE
Washington, DC 20020
|
900 sq. feet
|
2 baths 2 beds |
show details | |

|
#49
Rexford Way
Upper Marlboro, MD 20774
|
3,334 sq. feet
|
3 baths 5 beds |
show details | |

|
Check over 1 million property listings on Foreclosure.com!
|
browse all offers | |||


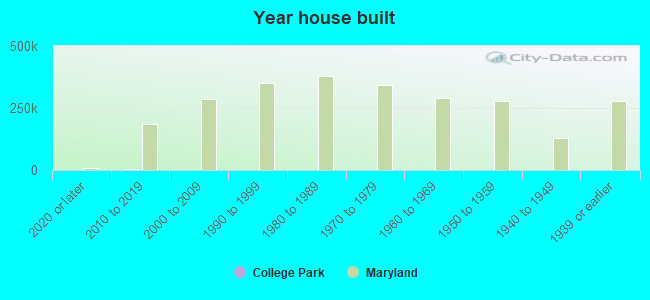
Median year apartment built: 2001
Household type by relationship:
Households: 34,048- Male householders: 4,646 (1,255 living alone), Female householders: 4,093 (1,321 living alone)
2,532 spouses (2,491 opposite-sex spouses), 929 unmarried partners, (846 opposite-sex unmarried partners), 4,031 children (3,911 natural, 14 adopted, 104 stepchildren), 226 grandchildren, 328 brothers or sisters, 346 parents, 0 foster children, 708 other relatives, 6,009 non-relatives
- In group quarters: 10,194
Size of family households: 1,487 2-persons, 1,016 3-persons, 608 4-persons, 468 5-persons, 195 6-persons, 20 7-or-more-persons.
Size of nonfamily households: 2,536 1-person, 1,289 2-persons, 375 3-persons, 521 4-persons, 237 5-persons, 111 6-persons, 29 7-or-more-persons.
2,114 married couples with children.
544 single-parent households (120 men, 424 women).
67.9% of residents of College Park speak English at home.
13.4% of residents speak Spanish at home (43% speak English very well, 17% speak English well, 24% speak English not well, 16% don't speak English at all).
5.9% of residents speak other Indo-European language at home (76% speak English very well, 20% speak English well, 4% speak English not well).
8.0% of residents speak Asian or Pacific Island language at home (57% speak English very well, 29% speak English well, 11% speak English not well, 4% don't speak English at all).
2.9% of residents speak other language at home (93% speak English very well, 6% speak English well, 1% speak English not well).
Foreign born population: 8,589 (25.2%)
(44.7% of them are naturalized citizens)
| Here: | 7.1 |
| State: | 7.3 |
| Here: | 3.9 |
| State: | 4.2 |
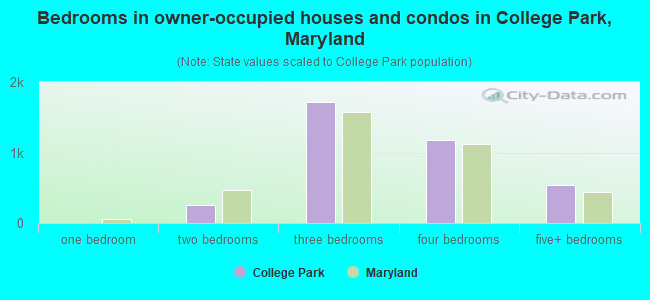
- Bedrooms in owner-occupied houses and condos in College Park, Maryland
- 0no bedroom
- 01 bedroom
- 2572 bedrooms
- 1,7113 bedrooms
- 1,1724 bedrooms
- 5395+ bedrooms
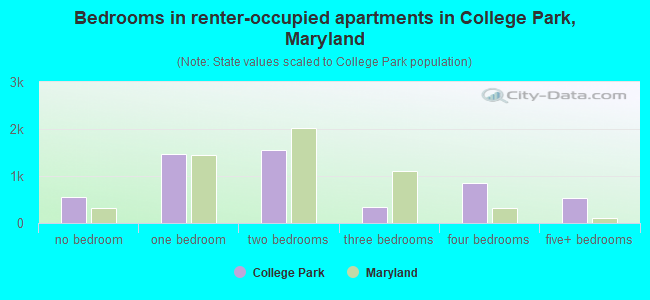
- Bedrooms in renter-occupied apartments in College Park, Maryland
- 550no bedroom
- 1,4681 bedroom
- 1,5552 bedrooms
- 3493 bedrooms
- 8534 bedrooms
- 5425+ bedrooms
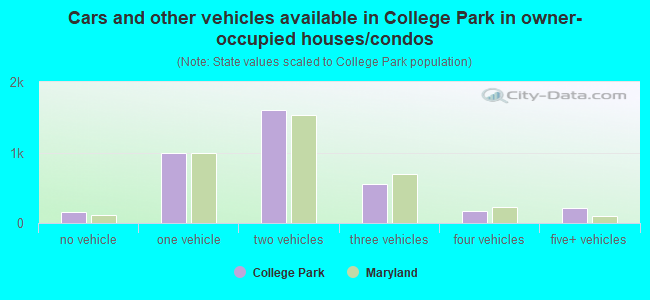
- Cars and other vehicles available in College Park in owner-occupied houses/condos
- 156no vehicle
- 9901 vehicle
- 1,6022 vehicles
- 5583 vehicles
- 1674 vehicles
- 2065+ vehicles
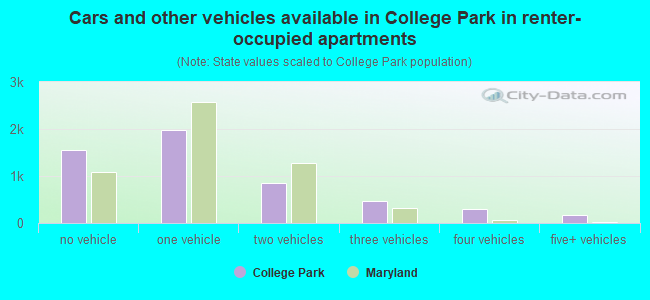
- Cars and other vehicles available in College Park in renter-occupied apartments
- 1,548no vehicle
- 1,9801 vehicle
- 8462 vehicles
- 4593 vehicles
- 3054 vehicles
- 1775+ vehicles
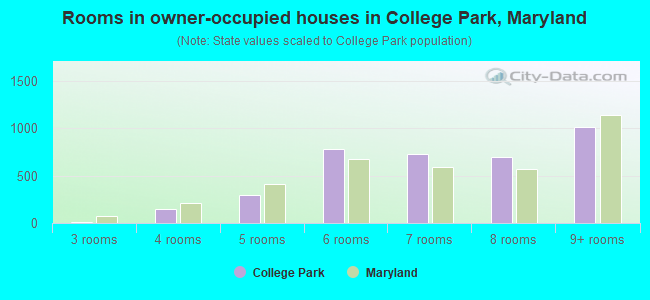
- Rooms in owner-occupied houses in College Park, Maryland
- 01 room
- 02 rooms
- 133 rooms
- 1504 rooms
- 2945 rooms
- 7826 rooms
- 7257 rooms
- 7018 rooms
- 1,0139+ rooms
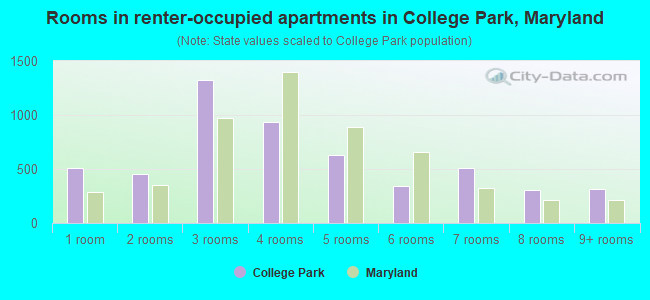
- Rooms in renter-occupied apartments in College Park, Maryland
- 5081 room
- 4522 rooms
- 1,3233 rooms
- 9344 rooms
- 6305 rooms
- 3396 rooms
- 5117 rooms
- 3068 rooms
- 3139+ rooms
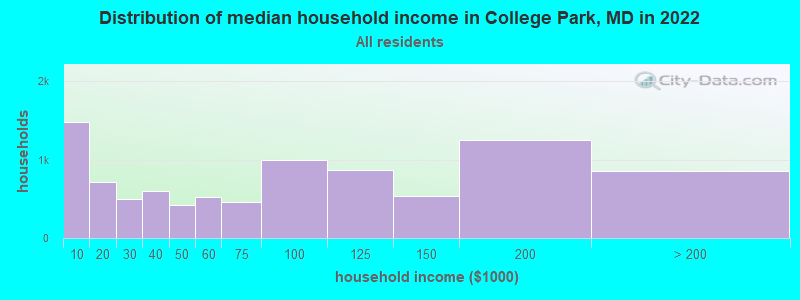
College Park, MD household income distribution

- 1,479Less than $10,000
- 714$10,000 to $19,999
- 492$20,000 to $29,999
- 604$30,000 to $39,999
- 423$40,000 to $49,999
- 518$50,000 to $59,999
- 453$60,000 to $74,999
- 990$75,000 to $99,999
- 865$100,000 to $124,999
- 531$125,000 to $149,999
- 1,245$150,000 to $199,999
- 857$200,000 or more
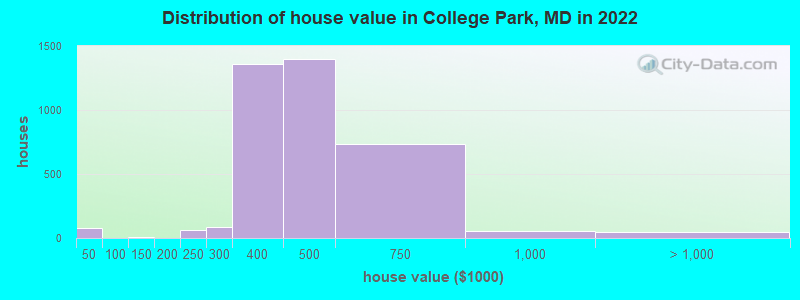
Home value of owner - occupied houses in 2022 in College Park, MD
-
- 76Less than $10,000
- 9$125,000 to $149,999
- 62$200,000 to $249,999
- 82$250,000 to $299,999
- 1,362$300,000 to $399,999
- 1,398$400,000 to $499,999
- 731$500,000 to $749,999
- 54$750,000 to $999,999
- 46$2,000,000 or more
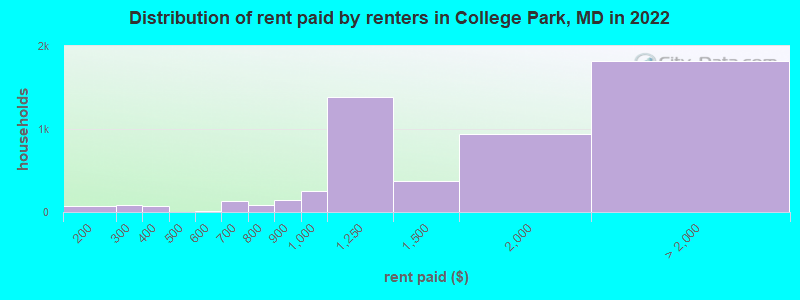
Rent paid by renters in 2022 in College Park, MD
-
- 77$150 to $199
- 17$200 to $249
- 66$250 to $299
- 17$300 to $349
- 52$350 to $399
- 5$400 to $449
- 7$500 to $549
- 7$550 to $599
- 126$600 to $649
- 6$650 to $699
- 70$700 to $749
- 11$750 to $799
- 144$800 to $899
- 255$900 to $999
- 1,387$1,000 to $1,249
- 371$1,250 to $1,499
- 940$1,500 to $1,999
- 1,250$2,000 to $2,499
- 230$2,500 to $2,999
- 109$3,000 to $3,499
- 131$3,500 or more
- 91No cash rent
Percentage of workers working in this county: 68.6%
Number of people working at home: 3,128 (19.7% of all workers)
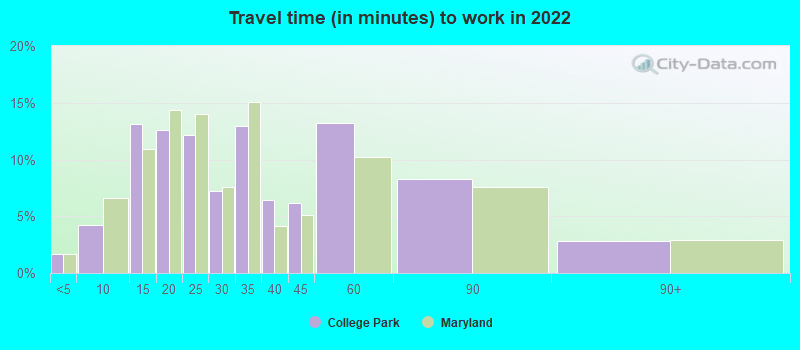
Travel time to work (commute)
- Less than 5 minutes: 420
- 5 to 9 minutes: 1,065
- 10 to 14 minutes: 3,025
- 15 to 19 minutes: 2,153
- 20 to 24 minutes: 1,771
- 25 to 29 minutes: 359
- 30 to 34 minutes: 1,515
- 35 to 39 minutes: 567
- 40 to 44 minutes: 478
- 45 to 59 minutes: 1,239
- 60 to 89 minutes: 714
- 90 or more minutes: 165
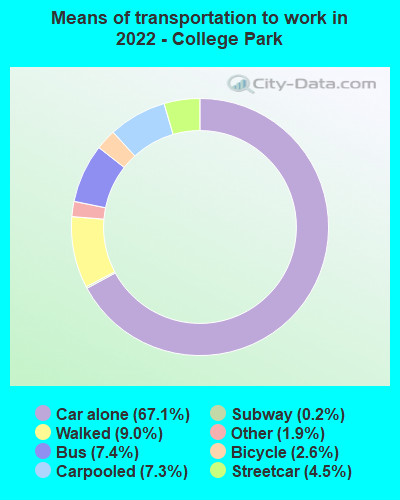
Means of transportation to work:
- Drove a car alone: 17,551 (58.6%)
- Carpooled: 1,726 (5.8%)
- Bus: 1,382 (4.6%)
- Subway or elevated rail: 822 (2.7%)
- Long-distance train or commuter rail: 32 (0.1%)
- Taxi: 649 (2.2%)
- Bicycle: 715 (2.4%)
- Walked: 2,358 (7.9%)
- Worked at home: 3,128 (10.4%)
- Unemployment by race in 2022
- Unemployment rate for White non-Hispanic residents
- 4.7%Males
- 5.5%Females
- Unemployment rate for Black residents
- 8.8%Males
- 5.2%Females
- Unemployment rate for Asian residents
- 12.3%Males
- 9.7%Females
- Unemployment rate for other race residents
- 0.9%Males
- 2.0%Females
- Unemployment rate for two or more race residents
- 4.6%Males
- Unemployment rate for Hispanic or Latino residents
- 2.0%Males
- 2.4%Females
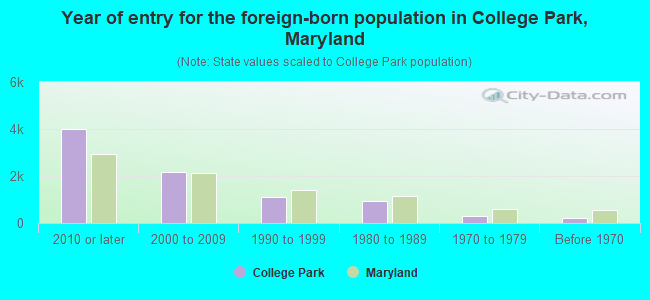
- Year of entry for the foreign-born population in College Park, Maryland
- 4,0172010 or later
- 2,1812000 to 2009
- 1,1031990 to 1999
- 9531980 to 1989
- 3151970 to 1979
- 226Before 1970
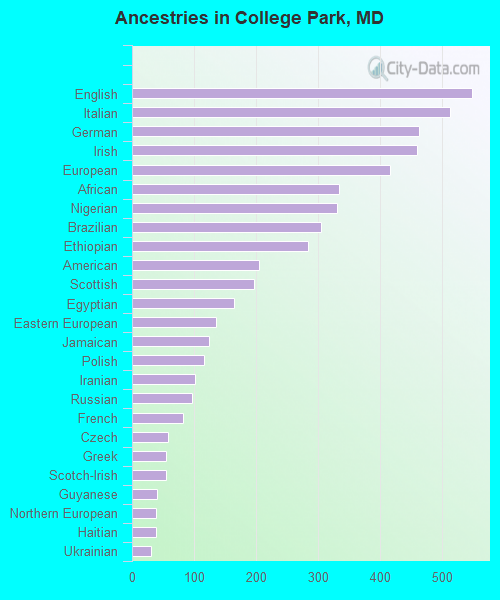
First ancestries reported:
- English: 548 (3.5%)
- Italian: 513 (3.2%)
- German: 462 (2.9%)
- Irish: 459 (2.9%)
- European: 416 (2.6%)
- African: 334 (2.1%)
- Nigerian: 331 (2.1%)
- Brazilian: 304 (1.9%)
- Ethiopian: 283 (1.8%)
- American: 205 (1.3%)
- Scottish: 196 (1.2%)
- Egyptian: 164 (1.0%)
- Eastern European: 135 (0.9%)
- Jamaican: 124 (0.8%)
- Polish: 116 (0.7%)
- Iranian: 102 (0.6%)
- Russian: 97 (0.6%)
- French: 82 (0.5%)
- Czech: 58 (0.4%)
- Greek: 55 (0.3%)
- Scotch-Irish: 54 (0.3%)
- Guyanese: 41 (0.3%)
- Northern European: 39 (0.2%)
- Haitian: 39 (0.2%)
- Ukrainian: 30 (0.2%)
- Liberian: 28 (0.2%)
- Portuguese: 25 (0.2%)
- Romanian: 24 (0.2%)
- Ghanaian: 22 (0.1%)
- British: 20 (0.1%)
- Kenyan: 15 (0.09%)
- Bermudan: 13 (0.08%)
- Dutch: 12 (0.08%)
- Sierra Leonean: 9 (0.06%)
- British West Indian: 8 (0.05%)
- Lebanese: 7 (0.04%)
- Arab: 6 (0.04%)
- Slovene: 6 (0.04%)
- Turkish: 6 (0.04%)
- Israeli: 6 (0.04%)
- Welsh: 5 (0.03%)
- Pennsylvania German: 4 (0.03%)
- Sudanese: 3 (0.02%)
- French Canadian: 3 (0.02%)
- Moroccan: 1 (0.01%)
- Danish: 1 (0.01%)
- Latvian: 1 (0.01%)
Most common places of birth for foreign-born residents (%):
| College Park: | 14.0% (1,189) |
| Maryland: | 2.5% (24,026) |
| College Park: | 11.7% (991) |
| Maryland: | 4.6% (44,742) |
| College Park: | 9.5% (804) |
| Maryland: | 12.0% (115,412) |
| College Park: | 8.3% (706) |
| Maryland: | 6.4% (61,725) |
| College Park: | 6.4% (540) |
| Maryland: | 4.4% (42,350) |
| College Park: | 4.4% (375) |
| Maryland: | 0.7% (7,124) |
| College Park: | 4.4% (371) |
| Maryland: | 3.4% (32,635) |
| College Park: | 3.9% (328) |
| Maryland: | 0.1% (805) |
| College Park: | 3.7% (312) |
| Maryland: | 1.2% (11,980) |
| College Park: | 3.3% (280) |
| Maryland: | 4.6% (44,825) |
| College Park: | 3.2% (275) |
| Maryland: | 0.4% (3,756) |
| College Park: | 2.7% (229) |
| Maryland: | 1.3% (12,898) |
| College Park: | 2.1% (174) |
| Maryland: | 0.8% (8,109) |
| College Park: | 2.1% (174) |
| Maryland: | 2.8% (27,444) |
| College Park: | 1.8% (155) |
| Maryland: | 0.7% (7,000) |
| College Park: | 1.7% (148) |
| Maryland: | 3.5% (34,065) |
| College Park: | 1.6% (136) |
| Maryland: | 3.8% (36,698) |
Place of birth for U.S.-born residents:
- This state: 12,003
- Other state: 12,937
- Northeast: 4,365
- Midwest: 1,653
- South: 6,209
- West: 1,240
62.6% of College Park residents lived in the same house 1 years ago.
Out of people who lived in different houses, 28.4% lived in this county.
Out of people who lived in different counties, 71.4% lived in Maryland.
| College Park: | 62.6% |
| State average: | 88.5% |
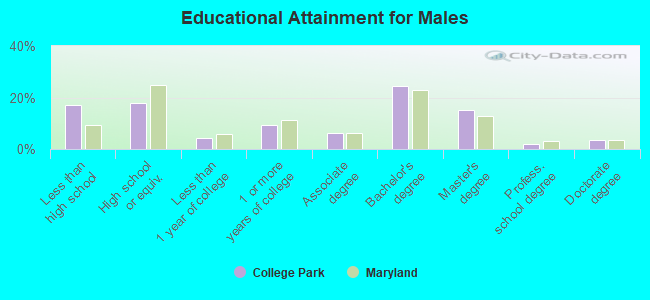
Education attainment for males 25 years and older:
- No schooling: 425
- Nursery to 4th grade: 60
- 5th and 6th grade: 312
- 7th and 8th grade: 106
- 9th grade: 139
- 10th grade: 103
- 11th grade: 19
- 12th grade, no diploma: 111
- High school graduate (or equivalency): 1,319
- Less than 1 year of college: 329
- Some college more than 1 year, no degree: 694
- Associate degree: 460
- Bachelor's degree: 1,818
- Master's degree: 1,117
- Professional school degree: 133
- Doctorate degree: 251
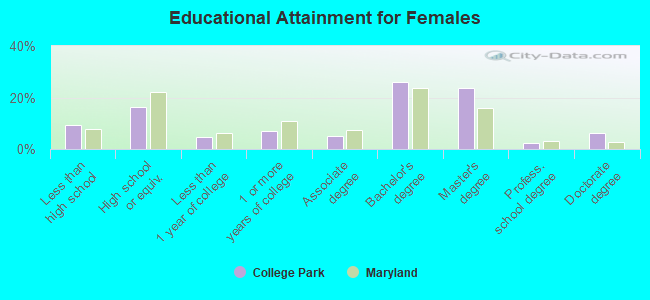
Education attainment for females 25 years and older:
- No schooling: 273
- Nursery to 4th grade: 9
- 5th and 6th grade: 60
- 7th and 8th grade: 62
- 9th grade: 27
- 10th grade: 41
- 11th grade: 61
- 12th grade, no diploma: 45
- High school graduate (or equivalency): 1,020
- Less than 1 year of college: 287
- Some college more than 1 year, no degree: 441
- Associate degree: 323
- Bachelor's degree: 1,647
- Master's degree: 1,488
- Professional school degree: 151
- Doctorate degree: 392
Housing units in structures:
- One, detached: 4,790
- One, attached: 168
- Two: 40
- 3 or 4: 237
- 5 to 9: 358
- 10 to 19: 431
- 20 to 49: 420
- 50 or more: 3,439
Housing units lacking complete kitchen facilities in 2022: 1.6%
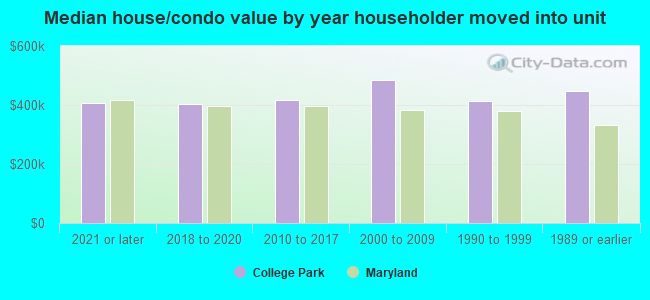
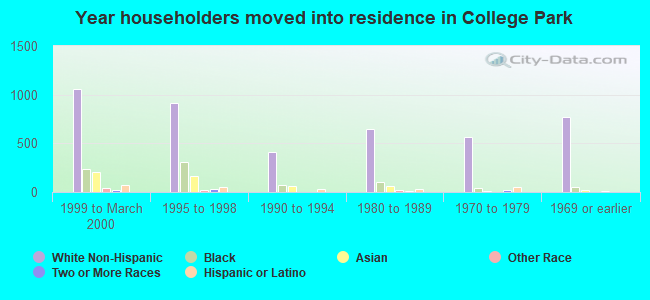
House/condo owner moved in on average 15 years ago
Renter moved in on average 1 years ago
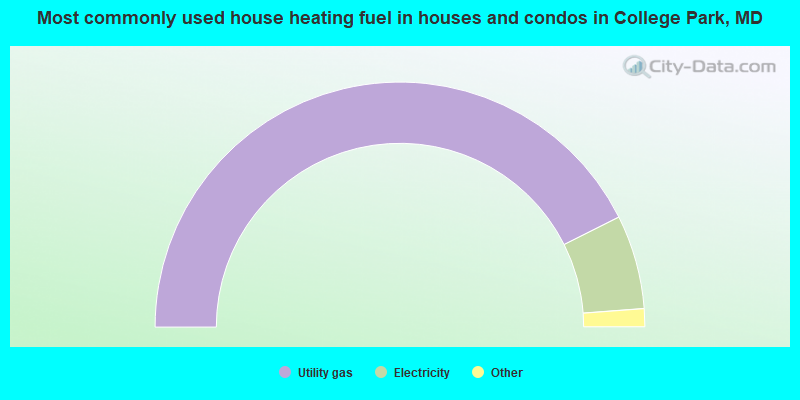
- 85.2%Utility gas
- 12.4%Electricity
- 1.4%Bottled, tank, or LP gas
- 1.0%Fuel oil, kerosene, etc.
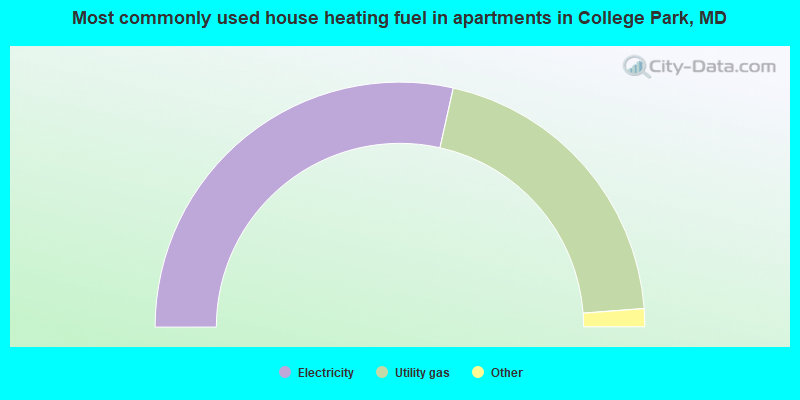
- 57.0%Electricity
- 40.6%Utility gas
- 1.1%Bottled, tank, or LP gas
- 0.5%Fuel oil, kerosene, etc.
- 0.4%No fuel used
- 0.3%Other fuel
- 0.2%Coal or coke
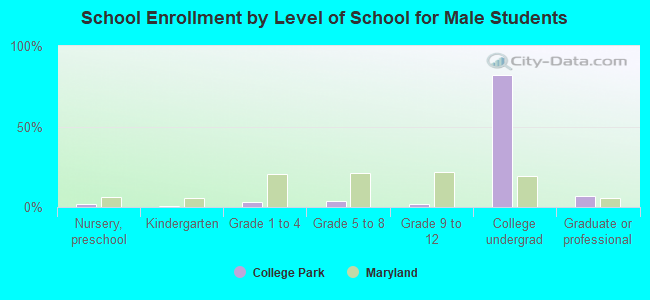
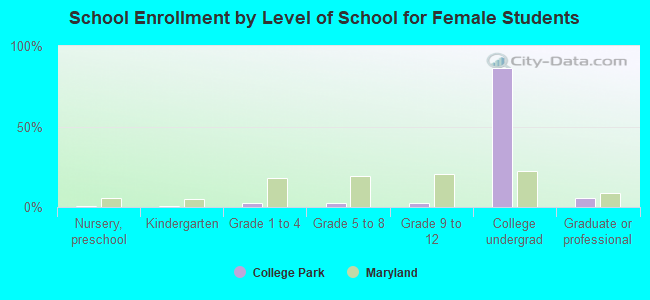
Private vs. public school enrollment:
| Here: | 35.8% |
| Maryland: | 15.2% |
| Here: | 26.9% |
| Maryland: | 14.4% |
| Here: | 3.3% |
| Maryland: | 20.2% |