Colstrip, MT (Montana) Houses and Residents
| Colstrip: | $176,788 |
| Montana: | $366,400 |
Mean price in 2022:
Detached houses: $259,332
Here: $259,332 State: $518,333 Mobile homes: $63,230
Here: $63,230 State: $139,111
Total population: 2,316 (Urban population: 0, Rural population: 2,346 (all nonfarm))
Houses: 1,054 (962 occupied: 822 owner occupied, 160 renter occupied)
| % of renters here: | 16% |
| State: | 31% |
Housing density: 235 houses/condos per square mile
Median price asked for vacant for-sale houses and condos in 2022: $590,780.
Median contract rent in 2022: $599 (lower quartile is $525, upper quartile is $736)
Median rent asked for vacant for-rent units in 2022: $625
Median gross rent in Colstrip, MT in 2022: $658
Housing units in Colstrip with a mortgage: 367 (16 second mortgage, 0 home equity loan, 6 both second mortgage and home equity loan)
Houses without a mortgage: 0
Median household income for houses/condos with a mortgage: $106,571
Median monthly housing costs: $652
Compare current foreclosures near your location:
| Photo | Address | Area | Beds / Baths | Price | Details |
|---|---|---|---|---|---|

|
#1
S High St
Columbus, OH 43207
|
1,678 sq. feet
|
2 baths 4 beds |
$27,500
|
show details |

|
#2
Bayberry Cir
Columbus, OH 43207
|
1,564 sq. feet
|
1 baths 3 beds |
$127,500
|
show details |

|
#3
E 21st Ave
Columbus, OH 43211
|
1,061 sq. feet
|
1 baths 3 beds |
$179,900
|
show details |

|
#4
Hildreth Ave
Columbus, OH 43203
|
1,798 sq. feet
|
2 baths 4 beds |
show details | |

|
#5
Upton Rd E
Columbus, OH 43232
|
852 sq. feet
|
1 baths 3 beds |
show details | |

|
#6
Glenmate Ct
Columbus, OH 43223
|
1,050 sq. feet
|
1 baths 3 beds |
show details | |

|
#7
Hiawatha Park Dr
Columbus, OH 43211
|
1,278 sq. feet
|
1 baths 4 beds |
show details | |

|
#8
Fergus Rd
Grove City, OH 43123
|
3,312 sq. feet
|
2 baths 4 beds |
show details | |

|
#9
Cannonade Ct
Columbus, OH 43230
|
2,023 sq. feet
|
2 baths 3 beds |
show details | |

|
#10
Fairfield Ave
Columbus, OH 43203
|
984 sq. feet
|
1 baths 2 beds |
show details |
| Photo | Address | Area | Beds / Baths | Price | Details |
|---|---|---|---|---|---|

|
#11
E Howard Rd
Columbus, OH 43207
|
1,056 sq. feet
|
1 baths 3 beds |
show details | |

|
#12
E Welch Ave
Columbus, OH 43207
|
1,864 sq. feet
|
2 baths 4 beds |
show details | |

|
#13
Chester Rd
Columbus, OH 43221
|
3,300 sq. feet
|
4 baths 5 beds |
show details | |

|
#14
S Champion Ave
Columbus, OH 43207
|
1,157 sq. feet
|
1 baths 2 beds |
show details | |

|
#15
Executive Ct
Westerville, OH 43081
|
1,811 sq. feet
|
2 baths 3 beds |
show details | |

|
#16
Lehner Rd
Columbus, OH 43224
|
1,628 sq. feet
|
2 baths 4 beds |
show details | |

|
#17
Wrexham Ave
Columbus, OH 43223
|
1,235 sq. feet
|
1 baths 3 beds |
show details | |

|
#18
Summertree Ln
Westerville, OH 43081
|
2,496 sq. feet
|
2 baths 3 beds |
show details | |

|
#19
Armada Rd
Columbus, OH 43232
|
1,028 sq. feet
|
1 baths 4 beds |
show details | |

|
#20
Chidley St
Galloway, OH 43119
|
1,502 sq. feet
|
1 baths 3 beds |
show details |
| Photo | Address | Area | Beds / Baths | Price | Details |
|---|---|---|---|---|---|

|
#21
London Groveport Rd
Grove City, OH 43123
|
816 sq. feet
|
1 baths 2 beds |
show details | |

|
#22
N Roys Ave
Columbus, OH 43204
|
648 sq. feet
|
2 baths 3 beds |
show details | |

|
#23
E Lincoln Ave
Columbus, OH 43214
|
874 sq. feet
|
1 baths 3 beds |
show details | |

|
#24
N Roys Ave
Columbus, OH 43204
|
1,248 sq. feet
|
2 baths 3 beds |
show details | |

|
#25
Falls Peak Ln
Delaware, OH 43015
|
1,352 sq. feet
|
2 baths 2 beds |
show details | |

|
#26
Striebel Ct
Columbus, OH 43227
|
925 sq. feet
|
1 baths 3 beds |
show details | |

|
#27
Rosewood Ct
Powell, OH 43065
|
2,801 sq. feet
|
3 baths 4 beds |
show details | |

|
#28
Whittman Ct
Plain City, OH 43064
|
3,186 sq. feet
|
3 baths 4 beds |
show details | |

|
#29
Hamilton Ave
Columbus, OH 43211
|
1,061 sq. feet
|
1 baths 3 beds |
show details | |

|
#30
High Free Pike
West Jefferson, OH 43162
|
1,216 sq. feet
|
2 baths 4 beds |
show details |
| Photo | Address | Area | Beds / Baths | Price | Details |
|---|---|---|---|---|---|

|
#31
Kelton Ave
Columbus, OH 43206
|
1,080 sq. feet
|
1 baths 3 beds |
show details | |

|
#32
Ashgrove Dr
Grove City, OH 43123
|
1,772 sq. feet
|
2 baths 4 beds |
show details | |

|
#33
Roundelay Rd N
Reynoldsburg, OH 43068
|
1,712 sq. feet
|
2 baths 3 beds |
show details | |

|
#34
Grasmere Ave
Columbus, OH 43211
|
720 sq. feet
|
1 baths 2 beds |
show details | |

|
#35
S Richardson Ave
Columbus, OH 43204
|
1,520 sq. feet
|
2 baths 3 beds |
show details | |

|
#36
N 18th St
Columbus, OH 43203
|
1,690 sq. feet
|
1 baths 4 beds |
show details | |

|
#37
Gladys Rd
Columbus, OH 43228
|
832 sq. feet
|
1 baths 3 beds |
show details | |

|
#38
Plainview Dr
Columbus, OH 43204
|
730 sq. feet
|
1 baths 2 beds |
show details | |

|
#39
Lowery Dr
Columbus, OH 43231
|
1,557 sq. feet
|
2 baths 3 beds |
show details | |

|
#40
Gertrude Dr
Columbus, OH 43227
|
1,287 sq. feet
|
1 baths 3 beds |
show details |
| Photo | Address | Area | Beds / Baths | Price | Details |
|---|---|---|---|---|---|

|
#41
Grand Bend Dr
Groveport, OH 43125
|
1,612 sq. feet
|
1 baths 3 beds |
show details | |

|
#42
Justin Rd
Columbus, OH 43227
|
986 sq. feet
|
1 baths 3 beds |
show details | |

|
#43
Crocker Rd
Columbus, OH 43232
|
895 sq. feet
|
1 baths 3 beds |
show details | |

|
#44
Wendler Blvd
Columbus, OH 43230
|
1,040 sq. feet
|
1 baths 3 beds |
show details | |

|
#45
Sapphire Dr
Grove City, OH 43123
|
3,241 sq. feet
|
3 baths 4 beds |
show details | |

|
#46
Dinard Way
Columbus, OH 43221
|
1,647 sq. feet
|
2 baths 3 beds |
show details | |

|
#47
Edgeview Rd
Columbus, OH 43207
|
1,352 sq. feet
|
1 baths 4 beds |
show details | |

|
#48
Torchwood Loop E
Columbus, OH 43229
|
2,116 sq. feet
|
2 baths 4 beds |
show details | |

|
#49
Pegwood Dr
Columbus, OH 43229
|
878 sq. feet
|
1 baths 1 beds |
show details | |

|
Check over 1 million property listings on Foreclosure.com!
|
browse all offers | |||

Latest news about housing in Colstrip, MT collected exclusively by city-data.com from local newspapers, TV, and radio stations

 | Looking to Rent a Home in Forsyth/Colstrip area. (19 replies) |
| Coal? (17 replies) |
| Need ride from colstrip to billings May 12 th (1 reply) |
| Montanans travel through Wyoming (32 replies) |
| Colstrip, Montana (110 replies) |
| Possibly Moving to Rosebud County Area (3 replies) |

Median year apartment built: 1986
Household type by relationship:
Households: 2,393- Male householders: 487 (209 living alone), Female householders: 480 (116 living alone)
553 spouses (541 opposite-sex spouses), 0 unmarried partners, (0 opposite-sex unmarried partners), 811 children (802 natural, 9 adopted, 0 stepchildren), 0 grandchildren, 0 brothers or sisters, 0 parents, 0 foster children, 0 other relatives, 59 non-relatives
- In group quarters: 1
Size of family households: 249 2-persons, 158 3-persons, 120 4-persons, 64 5-persons, 30 7-or-more-persons.
Size of nonfamily households: 326 1-person, 34 2-persons.
545 married couples with children.
146 single-parent households (42 men, 104 women).
91.4% of residents of Colstrip speak English at home.
4.9% of residents speak Spanish at home (66% speak English very well, 34% speak English well).
2.2% of residents speak other Indo-European language at home (100% speak English very well).
0.6% of residents speak Asian or Pacific Island language at home (100% speak English very well).
Foreign born population: 69 (2.9%)
(47.8% of them are naturalized citizens)
| Here: | 7.1 |
| State: | 6.4 |
| Here: | 4.5 |
| State: | 4.2 |

- Bedrooms in owner-occupied houses and condos in Colstrip, Montana
- 17no bedroom
- 381 bedroom
- 402 bedrooms
- 2593 bedrooms
- 2954 bedrooms
- 1755+ bedrooms

- Bedrooms in renter-occupied apartments in Colstrip, Montana
- 0no bedroom
- 261 bedroom
- 772 bedrooms
- 573 bedrooms
- 04 bedrooms
- 05+ bedrooms

- Cars and other vehicles available in Colstrip in owner-occupied houses/condos
- 6no vehicle
- 901 vehicle
- 2342 vehicles
- 1453 vehicles
- 2144 vehicles
- 1335+ vehicles

- Cars and other vehicles available in Colstrip in renter-occupied apartments
- 0no vehicle
- 1071 vehicle
- 542 vehicles
- 03 vehicles
- 04 vehicles
- 05+ vehicles

- Rooms in owner-occupied houses in Colstrip, Montana
- 171 room
- 02 rooms
- 413 rooms
- 104 rooms
- 575 rooms
- 1096 rooms
- 2457 rooms
- 868 rooms
- 2589+ rooms

- Rooms in renter-occupied apartments in Colstrip, Montana
- 01 room
- 02 rooms
- 563 rooms
- 194 rooms
- 645 rooms
- 06 rooms
- 187 rooms
- 48 rooms
- 09+ rooms


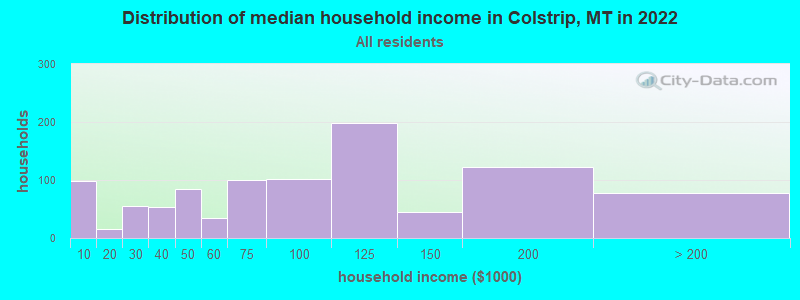
Colstrip, MT household income distribution

- 99Less than $10,000
- 16$10,000 to $19,999
- 56$20,000 to $29,999
- 53$30,000 to $39,999
- 85$40,000 to $49,999
- 35$50,000 to $59,999
- 100$60,000 to $74,999
- 101$75,000 to $99,999
- 198$100,000 to $124,999
- 45$125,000 to $149,999
- 123$150,000 to $199,999
- 77$200,000 or more
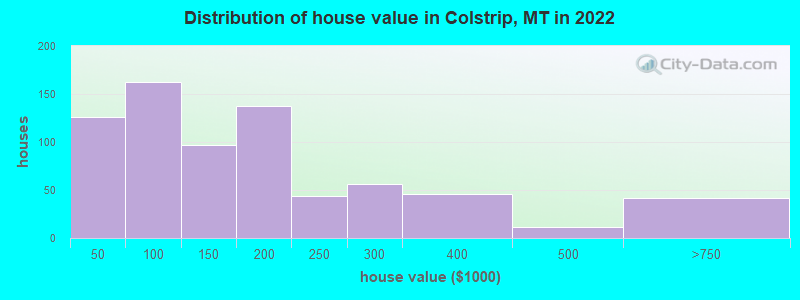
Home value of owner - occupied houses in 2022 in Colstrip, MT
-
- 18Less than $10,000
- 34$10,000 to $14,999
- 12$20,000 to $24,999
- 41$25,000 to $29,999
- 18$40,000 to $49,999
- 40$50,000 to $59,999
- 9$60,000 to $69,999
- 91$70,000 to $79,999
- 2$90,000 to $99,999
- 60$100,000 to $124,999
- 36$125,000 to $149,999
- 92$150,000 to $174,999
- 44$175,000 to $199,999
- 43$200,000 to $249,999
- 55$250,000 to $299,999
- 45$300,000 to $399,999
- 10$400,000 to $499,999
- 41$500,000 to $749,999
Rent paid by renters in 2022 in Colstrip, MT
-
- 9$300 to $349
- 15$450 to $499
- 25$500 to $549
- 24$550 to $599
- 33$650 to $699
- 25$700 to $749
- 6$750 to $799
- 4No cash rent


Percentage of workers working in this county: 98.9%
Number of people working at home: 0 (0.0% of all workers)
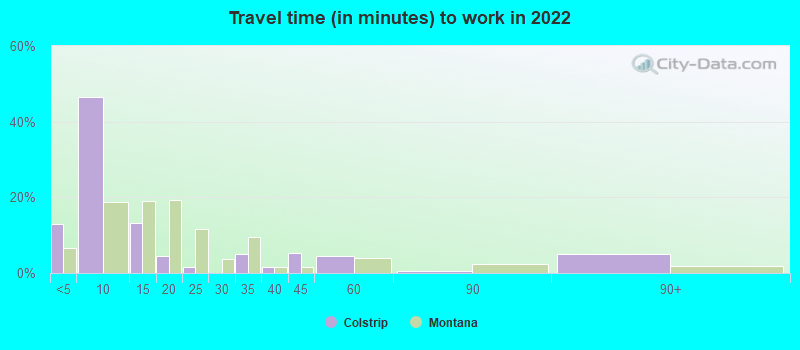
Travel time to work (commute)
- Less than 5 minutes: 92
- 5 to 9 minutes: 623
- 10 to 14 minutes: 157
- 15 to 19 minutes: 14
- 20 to 24 minutes: 101
- 25 to 29 minutes: 69
- 30 to 34 minutes: 11
- 35 to 39 minutes: 26
- 40 to 44 minutes: 32
- 45 to 59 minutes: 8
- 60 to 89 minutes: 9
- 90 or more minutes: 0
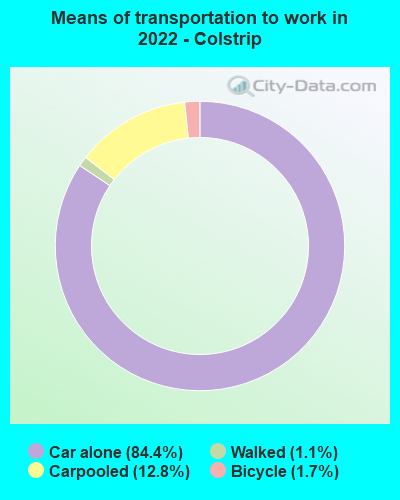
Means of transportation to work:
- Drove a car alone: 829 (80.5%)
- Carpooled: 148 (14.4%)
- Bicycle: 15 (1.5%)
- Walked: 12 (1.2%)

- Unemployment by race in 2022
- Unemployment rate for White non-Hispanic residents
- 2.3%Males
- Unemployment rate for American Indian and Alaska Native residents
- 47.9%Males
- 30.4%Females

- Year of entry for the foreign-born population in Colstrip, Montana
- 232010 or later
- 112000 to 2009
- 01990 to 1999
- 41980 to 1989
- 01970 to 1979
- 8Before 1970
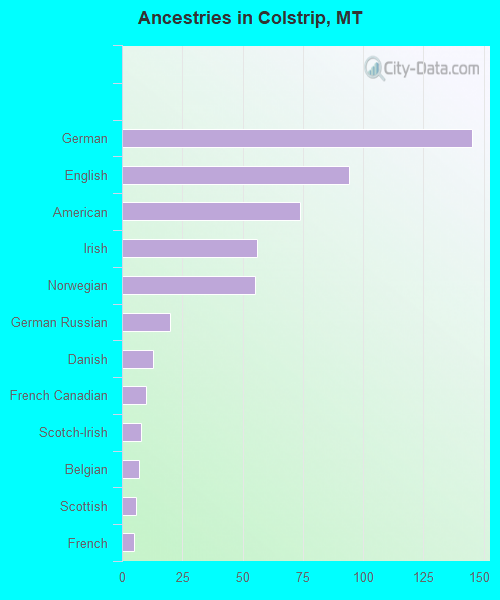
First ancestries reported:
- German: 145 (16.7%)
- English: 94 (10.8%)
- American: 74 (8.5%)
- Irish: 56 (6.4%)
- Norwegian: 55 (6.3%)
- German Russian: 20 (2.3%)
- Danish: 13 (1.5%)
- French Canadian: 10 (1.1%)
- Scotch-Irish: 8 (0.9%)
- Belgian: 7 (0.8%)
- Scottish: 6 (0.7%)
- French: 5 (0.6%)
Most common places of birth for foreign-born residents (%):
| Colstrip: | 43.9% (29) |
| Montana: | 0.1% (31) |
| Colstrip: | 27.3% (18) |
| Montana: | 7.0% (1,735) |
| Colstrip: | 21.2% (14) |
| Montana: | 9.3% (2,310) |
Place of birth for U.S.-born residents:
- This state: 1,229
- Other state: 1,082
- Northeast: 51
- Midwest: 329
- South: 138
- West: 563
99.5% of Colstrip residents lived in the same house 1 years ago.
Out of people who lived in different houses, 47.2% lived in this county.
| Colstrip: | 99.5% |
| State average: | 86.7% |
Education attainment for males 25 years and older:
- No schooling: 0
- Nursery to 4th grade: 0
- 5th and 6th grade: 0
- 7th and 8th grade: 45
- 9th grade: 0
- 10th grade: 13
- 11th grade: 0
- 12th grade, no diploma: 7
- High school graduate (or equivalency): 298
- Less than 1 year of college: 87
- Some college more than 1 year, no degree: 149
- Associate degree: 129
- Bachelor's degree: 71
- Master's degree: 38
- Professional school degree: 0
- Doctorate degree: 0

Education attainment for females 25 years and older:
- No schooling: 0
- Nursery to 4th grade: 0
- 5th and 6th grade: 0
- 7th and 8th grade: 13
- 9th grade: 0
- 10th grade: 0
- 11th grade: 0
- 12th grade, no diploma: 8
- High school graduate (or equivalency): 176
- Less than 1 year of college: 27
- Some college more than 1 year, no degree: 139
- Associate degree: 102
- Bachelor's degree: 179
- Master's degree: 72
- Professional school degree: 13
- Doctorate degree: 31


Housing units in structures:
- One, detached: 615
- Two: 17
- 3 or 4: 100
- 5 to 9: 57
- Mobile homes: 247
- Boats, RVs, vans, etc.: 16
Median worth of mobile homes: $44,741
House/condo owner moved in on average 13 years ago
Renter moved in on average 5 years ago

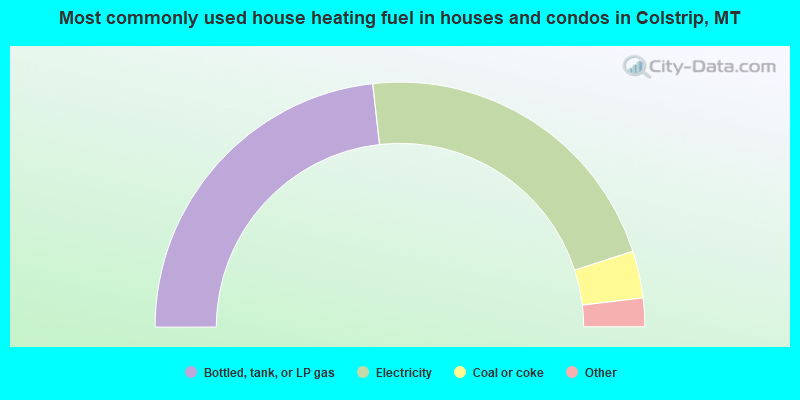
- 46.5%Bottled, tank, or LP gas
- 43.6%Electricity
- 6.2%Coal or coke
- 1.8%Fuel oil, kerosene, etc.
- 1.3%Utility gas
- 0.6%Wood
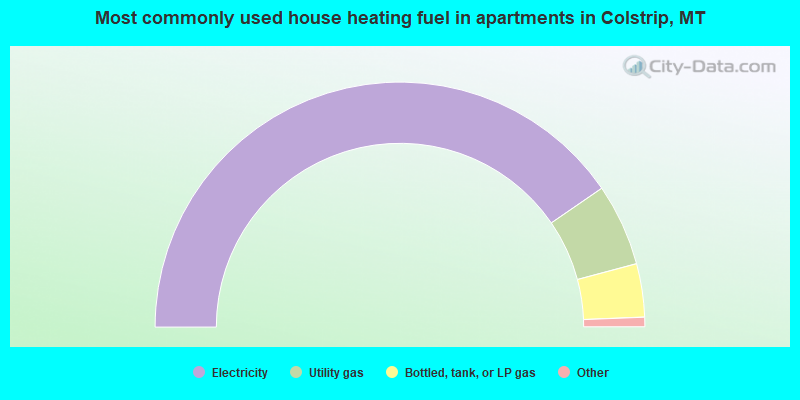
- 81.8%Electricity
- 11.0%Utility gas
- 7.1%Bottled, tank, or LP gas
Private vs. public school enrollment:
| Here: | 10.7% |
| Montana: | 15.3% |
| Here: | 17.3% |
| Montana: | 12.2% |
| Here: | 36.8% |
| Montana: | 15.0% |


