Columbus, GA (Georgia) Houses and Residents
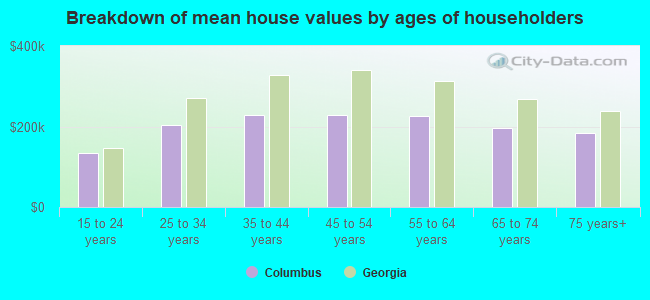
Estimated median house or condo value in 2022: $185,823 (it was $83,200 in 2000 )
Columbus:
$185,823Georgia:
$297,400
Lower value quartile - upper value quartile: $115,086 - $279,132Total population: 185,888 (Urban population: 181,073, Rural population: 4,724 (56 farm, 4,668 nonfarm ))
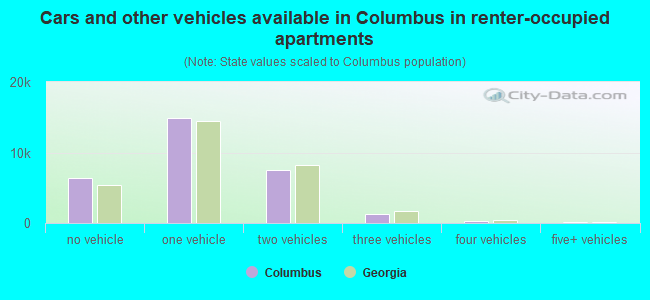
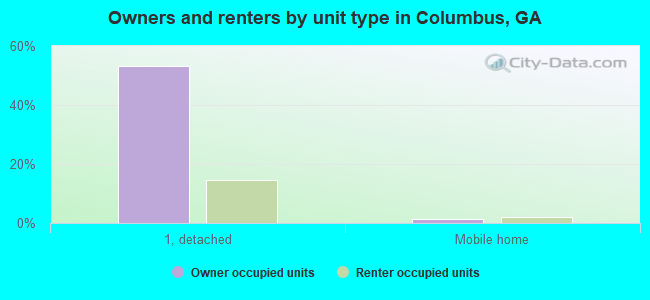
Houses: 75,938 (69,597 occupied: 39,266 owner occupied, 30,331 renter occupied )
% of renters here:
44%State:
34%
Housing density: 351 houses/condos per square mile
Median price asked for vacant for-sale houses and condos in 2022 in this county: $170,737.
Median contract rent in 2022: $807 (lower quartile is $638, upper quartile is $1,248)
Median rent asked for vacant for-rent units in 2022: $665
Median gross rent in Columbus, GA in 2022: $1,043
Housing units in Columbus with a mortgage: 26,511 (3,939 second mortgage, 2,477 home equity loan, 91 both second mortgage and home equity loan )Houses without a mortgage: 9,803
Data:
Median house or condo value ($)
Median house or condo value ($ change since 2000)
Median house or condo value ($) - White
Median house or condo value ($) - Black or African American
Median house or condo value ($) - Asian
Median house or condo value ($) - Hispanic or Latino
Median house or condo value ($) - American Indian and Alaska Native
Median house or condo value ($) - Multirace
Median house or condo value ($) - Other Race
Median price asked for mobile homes ($)
Household density (households per square mile)
Mean house or condo value by units in structure - 1, detached ($)
Mean house or condo value by units in structure - 1, attached ($)
Mean house or condo value by units in structure - 2 ($)
Mean house or condo value by units in structure by units in structure - 3 or 4 ($)
Mean house or condo value by units in structure - 5 or more ($)
Mean house or condo value by units in structure - Boat, RV, van, etc. ($)
Mean house or condo value by units in structure - Mobile home ($)
Median contract rent ($)
Median contract rent - Lower quartile ($)
Median contract rent - Upper quartile ($)
Median gross rent ($)
Urban houses (%)
Rural houses (%)
Houses occupied (%)
Houses occupied (% change since 2000)
Houses owner occupied (%)
Houses owner occupied (% change since 2000)
Houses renter occupied (%)
Houses renter occupied (% change since 2000)
Vacant housing units - For rent (%)
Vacant housing units - For rent (% change since 2000)
Vacant housing units - For sale only (%)
Vacant housing units - For sale only (% change since 2000)
Vacant housing units - Rented or sold, not occupied (%)
Vacant housing units - Rented or sold, not occupied (% change since 2000)
Vacant housing units - For seasonal, recreational, or occasional use (%)
Vacant housing units - For seasonal, recreational, or occasional use (% change since 2000)
Vacant housing units - For migrant workers (%)
Vacant housing units - For migrant workers (% change since 2000)
Vacant housing units - Other vacant (%)
Vacant housing units - Other vacant (% change since 2000)
Median monthly housing costs ($)
Median household income for houses/condos with a mortgage ($)
Median household income for houses/condos without a mortgage ($)
Median household income ($)
Median household income ($) - White
Median household income ($) - Black or African American
Median household income ($) - Asian
Median household income ($) - Hispanic or Latino
Median household income ($) - American Indian and Alaska Native
Median household income ($) - Multirace
Median household income ($) - Other Race
Mortgage status - with mortgage (%)
Mortgage status - with second mortgage (%)
Mortgage status - with home equity loan (%)
Mortgage status - with both second mortgage and home equity loan (%)
Mortgage status - without a mortgage (%)
Median year house/condo built
Median year apartment built
Household type by relationship - Male householder living alone (%)
Household type by relationship - Male householder not living alone (%)
Household type by relationship - Female householder living alone (%)
Household type by relationship - Female householder not living alone (%)
Household type by relationship - Opposite-Sex spouse (%)
Household type by relationship - Same-Sex spouse (%)
Household type by relationship - Opposite-Sex unmarried partner (%)
Household type by relationship - Same-Sex unmarried partner (%)
Household type by relationship - In group quarters (%)
Size of family households - 2-person household (%)
Size of family households - 3-person household (%)
Size of family households - 4-person household (%)
Size of family households - 5-person household (%)
Size of family households - 6-person household (%)
Size of family households - 7-or-more-person household (%)
Size of nonfamily households - 1-person household (%)
Size of nonfamily households - 2-person household (%)
Size of nonfamily households - 3-person household (%)
Size of nonfamily households - 4-person household (%)
Size of nonfamily households - 5-person household (%)
Size of nonfamily households - 6-person household (%)
Size of nonfamily households - 7-or-moreperson household (%)
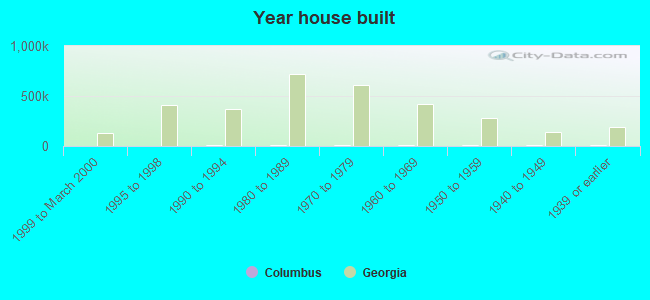
Year house built - Built 2010 or later (%)
Year house built - Built 2000 to 2009 (%)
Year house built - Built 1990 to 1999 (%)
Year house built - Built 1980 to 1989 (%)
Year house built - Built 1970 to 1979 (%)
Year house built - Built 1960 to 1969 (%)
Year house built - Built 1950 to 1959 (%)
Year house built - Built 1940 to 1949 (%)
Year house built - Built 1939 or earlier (%)
Median number of rooms in houses and condos
Median number of rooms in apartments
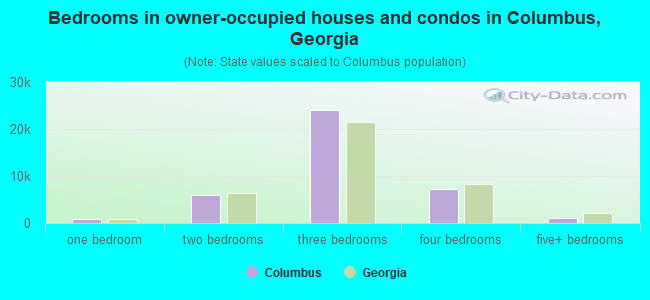
Median number of bedrooms in owner occupied houses
Mean number of bedrooms in owner occupied houses
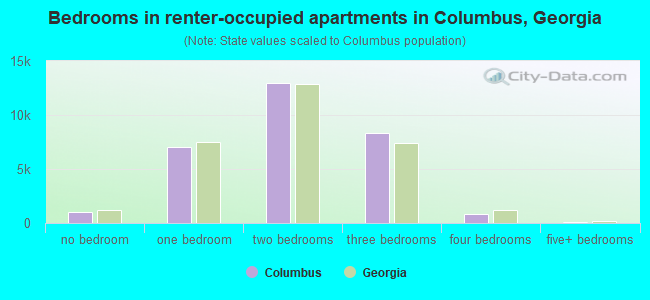
Median number of bedrooms in renter occupied houses
Mean number of bedrooms in renter occupied houses
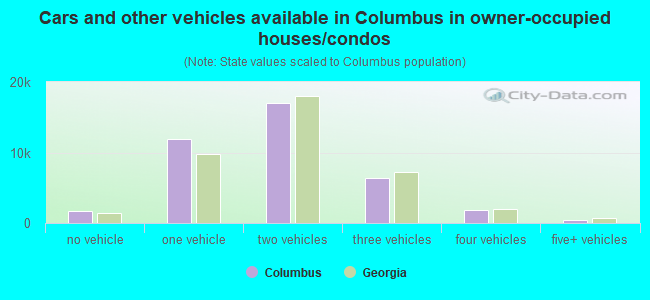
Median number of vehichles in owner occupied houses
Mean number of vehichles in owner occupied houses
Median number of vehichles in renter occupied houses
Mean number of vehichles in renter occupied houses
Rooms in owner-occupied houses - 1 room (%)
Rooms in owner-occupied houses - 2 rooms (%)
Rooms in owner-occupied houses - 3 rooms (%)
Rooms in owner-occupied houses - 4 rooms (%)
Rooms in owner-occupied houses - 5 rooms (%)
Rooms in owner-occupied houses - 6 rooms (%)
Rooms in owner-occupied houses - 7 rooms (%)
Rooms in owner-occupied houses - 8 rooms (%)
Rooms in owner-occupied houses - 9+ rooms (%)
Rooms in renter-occupied houses - 1 room (%)
Rooms in renter-occupied houses - 2 rooms (%)
Rooms in renter-occupied houses - 3 rooms (%)
Rooms in renter-occupied houses - 4 rooms (%)
Rooms in renter-occupied houses - 5 rooms (%)
Rooms in renter-occupied houses - 6 rooms (%)
Rooms in renter-occupied houses - 7 rooms (%)
Rooms in renter-occupied houses - 8 rooms (%)
Rooms in renter-occupied houses - 9+ rooms (%)
Bedrooms in owner-occupied houses - no bedrooms (%)
Bedrooms in owner-occupied houses - 1 bedroom (%)
Bedrooms in owner-occupied houses - 2 bedrooms (%)
Bedrooms in owner-occupied houses - 3 bedrooms (%)
Bedrooms in owner-occupied houses - 4 bedrooms (%)
Bedrooms in owner-occupied houses - 5+ bedrooms (%)
Bedrooms in renter-occupied houses - no bedrooms (%)
Bedrooms in renter-occupied houses - 1 bedroom (%)
Bedrooms in renter-occupied houses - 2 bedrooms (%)
Bedrooms in renter-occupied houses - 3 bedrooms (%)
Bedrooms in renter-occupied houses - 4 bedrooms (%)
Bedrooms in renter-occupied houses - 5+ bedrooms (%)
Vehicles available in owner-occupied houses - no vehicle available (%)
Vehicles available in owner-occupied houses - 1 vehicle available(%)
Vehicles available in owner-occupied houses - 2 Vehicles available (%)
Vehicles available in owner-occupied houses - 3 Vehicles available (%)
Vehicles available in owner-occupied houses - 4 Vehicles available (%)
Vehicles available in owner-occupied houses - 5+ Vehicles available (%)
Vehicles available in renter-occupied houses - no vehicle available (%)
Vehicles available in renter-occupied houses - 1 vehicle available (%)
Vehicles available in renter-occupied houses - 2 Vehicles available (%)
Vehicles available in renter-occupied houses - 3 Vehicles available (%)
Vehicles available in renter-occupied houses - 4 Vehicles available (%)
Vehicles available in renter-occupied houses - 5+ Vehicles available (%)
Housing units in structures - 1, detached (%)
Housing units in structures - 1, attached (%)
Housing units in structures - 2 (%)
Housing units in structures - 3 or 4 (%)
Housing units in structures - 5 to 9 (%)
Housing units in structures - 10 to 19 (%)
Housing units in structures - 20 to 49 (%)
Housing units in structures - 50 or more (%)
Housing units in structures - Mobile home (%)
Housing units in structures - Boat, RV, van, etc. (%)
Housing units in structures - Owners - 1, detached (%)
Housing units in structures - Owners - 1, attached (%)
Housing units in structures - Owners - 2 (%)
Housing units in structures - Owners - 3 or 4 (%)
Housing units in structures - Owners - 5 to 9 (%)
Housing units in structures - Owners - 10 to 19 (%)
Housing units in structures - Owners - 20 to 49 (%)
Housing units in structures - Owners - 50 or more (%)
Housing units in structures - Owners - Mobile home (%)
Housing units in structures - Owners - Boat, RV, van, etc. (%)
Housing units in structures - Renters - 1, detached (%)
Housing units in structures - Renters - 1, attached (%)
Housing units in structures - Renters - 2 (%)
Housing units in structures - Renters - 3 or 4 (%)
Housing units in structures - Renters - 5 to 9 (%)
Housing units in structures - Renters - 10 to 19 (%)
Housing units in structures - Renters - 20 to 49 (%)
Housing units in structures - Renters - 50 or more (%)
Housing units in structures - Renters - Mobile home (%)
Housing units in structures - Renters - Boat, RV, van, etc. (%)
House/condo owner moved in on average (years ago)
Renter moved in on average (years ago)
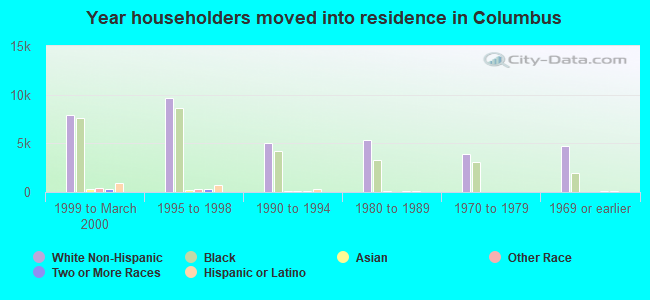
Year householder moved into unit - Moved in 1999 to March 2000 (%)
Year householder moved into unit - Moved in 1999 to March 2000 (%) - White
Year householder moved into unit - Moved in 1999 to March 2000 (%) - Black or African American
Year householder moved into unit - Moved in 1999 to March 2000 (%) - Asian
Year householder moved into unit - Moved in 1999 to March 2000 (%) - Hispanic or Latino
Year householder moved into unit - Moved in 1999 to March 2000 (%) - American Indian and Alaska Native
Year householder moved into unit - Moved in 1999 to March 2000 (%) - Multirace
Year householder moved into unit - Moved in 1999 to March 2000 (%) - Other Race
Year householder moved into unit - Moved in 1995 to 1998 (%)
Year householder moved into unit - Moved in 1995 to 1998 (%) - White
Year householder moved into unit - Moved in 1995 to 1998 (%) - Black or African American
Year householder moved into unit - Moved in 1995 to 1998 (%) - Asian
Year householder moved into unit - Moved in 1995 to 1998 (%) - Hispanic or Latino
Year householder moved into unit - Moved in 1995 to 1998 (%) - American Indian and Alaska Native
Year householder moved into unit - Moved in 1995 to 1998 (%) - Multirace
Year householder moved into unit - Moved in 1995 to 1998 (%) - Other Race
Year householder moved into unit - Moved in 1990 to 1994 (%)
Year householder moved into unit - Moved in 1990 to 1994 (%) - White
Year householder moved into unit - Moved in 1990 to 1994 (%) - Black or African American
Year householder moved into unit - Moved in 1990 to 1994 (%) - Asian
Year householder moved into unit - Moved in 1990 to 1994 (%) - Hispanic or Latino
Year householder moved into unit - Moved in 1990 to 1994 (%) - American Indian and Alaska Native
Year householder moved into unit - Moved in 1990 to 1994 (%) - Multirace
Year householder moved into unit - Moved in 1990 to 1994 (%) - Other Race
Year householder moved into unit - Moved in 1980 to 1989 (%)
Year householder moved into unit - Moved in 1980 to 1989 (%) - White
Year householder moved into unit - Moved in 1980 to 1989 (%) - Black or African American
Year householder moved into unit - Moved in 1980 to 1989 (%) - Asian
Year householder moved into unit - Moved in 1980 to 1989 (%) - Hispanic or Latino
Year householder moved into unit - Moved in 1980 to 1989 (%) - American Indian and Alaska Native
Year householder moved into unit - Moved in 1980 to 1989 (%) - Multirace
Year householder moved into unit - Moved in 1980 to 1989 (%) - Other Race
Year householder moved into unit - Moved in 1970 to 1979 (%)
Year householder moved into unit - Moved in 1970 to 1979 (%) - White
Year householder moved into unit - Moved in 1970 to 1979 (%) - Black or African American
Year householder moved into unit - Moved in 1970 to 1979 (%) - Asian
Year householder moved into unit - Moved in 1970 to 1979 (%) - Hispanic or Latino
Year householder moved into unit - Moved in 1970 to 1979 (%) - American Indian and Alaska Native
Year householder moved into unit - Moved in 1970 to 1979 (%) - Multirace
Year householder moved into unit - Moved in 1970 to 1979 (%) - Other Race
Year householder moved into unit - Moved in 1969 or earlier (%)
Year householder moved into unit - Moved in 1969 or earlier (%) - White
Year householder moved into unit - Moved in 1969 or earlier (%) - Black or African American
Year householder moved into unit - Moved in 1969 or earlier (%) - Asian
Year householder moved into unit - Moved in 1969 or earlier (%) - Hispanic or Latino
Year householder moved into unit - Moved in 1969 or earlier (%) - American Indian and Alaska Native
Year householder moved into unit - Moved in 1969 or earlier (%) - Multirace
Year householder moved into unit - Moved in 1969 or earlier (%) - Other Race
Housing units lacking complete plumbing facilities (%)
Housing units lacking complete kitchen facilities (%)
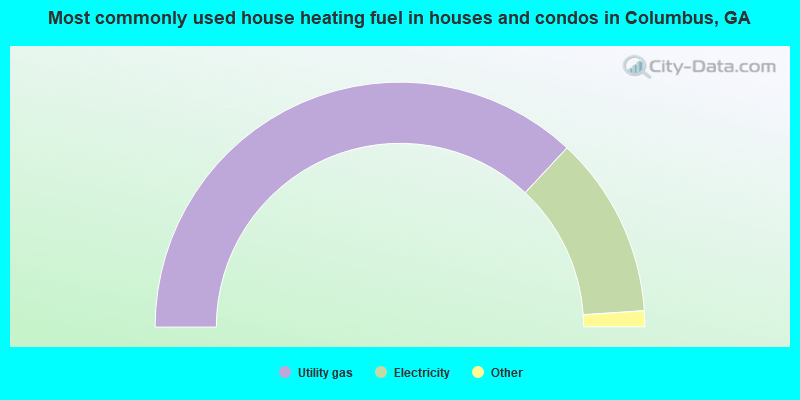
House heating fuel used in houses and condos - Utility gas (%)
House heating fuel used in houses and condos - Bottled, tank, or LP gas (%)
House heating fuel used in houses and condos - Electricity (%)
House heating fuel used in houses and condos - Fuel oil, kerosene, etc. (%)
House heating fuel used in houses and condos - Coal or coke (%)
House heating fuel used in houses and condos - Wood (%)
House heating fuel used in houses and condos - Solar energy (%)
House heating fuel used in houses and condos - Other fuel (%)
House heating fuel used in houses and condos - No fuel used (%)
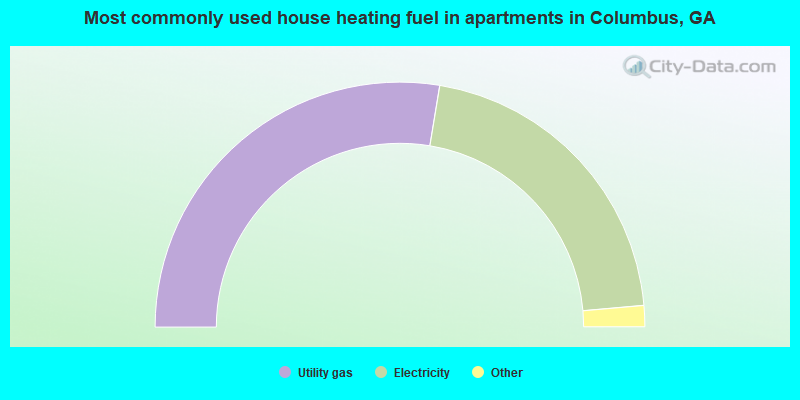
House heating fuel used in apartments - Utility gas (%)
House heating fuel used in apartments - Bottled, tank, or LP gas (%)
House heating fuel used in apartments - Electricity (%)
House heating fuel used in apartments - Fuel oil, kerosene, etc. (%)
House heating fuel used in apartments - Coal or coke (%)
House heating fuel used in apartments - Wood (%)
House heating fuel used in apartments - Solar energy (%)
House heating fuel used in apartments - Other fuel (%)
House heating fuel used in apartments - No fuel used (%)
Latest news about housing in Columbus, GA collected exclusively by city-data.com from local newspapers, TV, and radio stations
Household type by relationship:
Households: 182,868
In family households: 151,219 (26,454 male householders , 21,288 female householders )
28,366 spouses , 56,604 children (52,252 natural , 1,087 adopted , 3,265 stepchildren ), 6,363 grandchildren , 2,431 brothers or sisters , 1,647 parents , foster children , 2,985 other relatives , 4,222 non-relatives In nonfamily households: 31,649 (11,937 male householders (9,489 living alone )), 14,402 female householders (12,678 living alone )), 5,310 nonrelatives In group quarters: 7,017 (3,486 institutionalized population)
25,750 married couples with children. single-parent households (2,257 men , 15,040 women ).
91.9% of residents of Columbus speak English at home. of residents speak Spanish at home (64% speak English very well , 19% speak English well , 14% speak English not well , 3% don't speak English at all ).of residents speak other Indo-European language at home (73% speak English very well , 20% speak English well , 7% speak English not well ).of residents speak Asian or Pacific Island language at home (54% speak English very well , 32% speak English well , 13% speak English not well , 2% don't speak English at all ).of residents speak other language at home (83% speak English very well , 7% speak English well , 4% speak English not well , 7% don't speak English at all ).
Foreign born population: 10,304 (5.1%)of them are naturalized citizens )
Median number of rooms in houses and condos:
Median number of rooms in apartments
Owner-occupied Renter-occupied
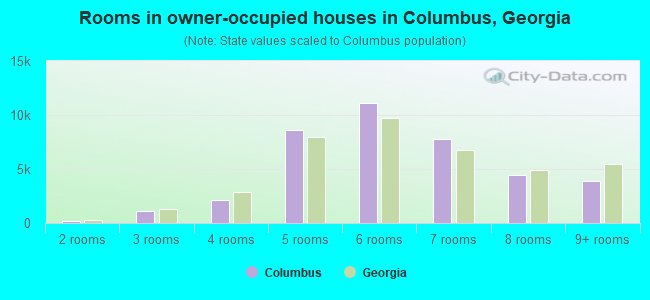
Rooms in owner-occupied houses in Columbus, Georgia
5 1 room 177 2 rooms 1,156 3 rooms 2,084 4 rooms 8,568 5 rooms 11,070 6 rooms 7,824 7 rooms 4,482 8 rooms 3,900 9+ rooms
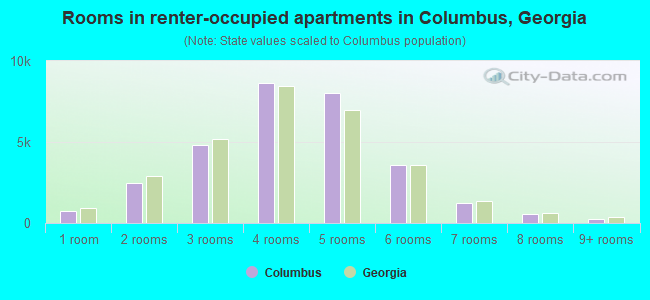
Rooms in renter-occupied apartments in Columbus, Georgia
759 1 room 2,487 2 rooms 4,799 3 rooms 8,671 4 rooms 8,008 5 rooms 3,566 6 rooms 1,210 7 rooms 554 8 rooms 277 9+ rooms
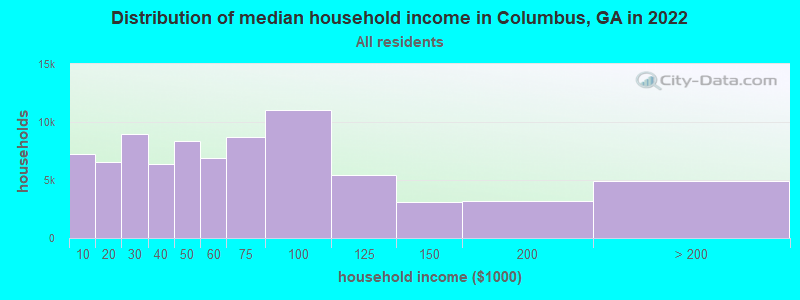
Columbus, GA household income distribution 7,274 Less than $10,0006,589 $10,000 to $19,9998,956 $20,000 to $29,9996,365 $30,000 to $39,9998,389 $40,000 to $49,9996,883 $50,000 to $59,9998,701 $60,000 to $74,99911,002 $75,000 to $99,9995,423 $100,000 to $124,9993,076 $125,000 to $149,9993,208 $150,000 to $199,9994,956 $200,000 or more
Percentage of workers working in this county: 85.9%Number of people working at home: 21,175 (18.0% of all workers )
Travel time to work (commute)
Less than 5 minutes: 2,9185 to 9 minutes: 9,83910 to 14 minutes: 16,06215 to 19 minutes: 20,66220 to 24 minutes: 15,08125 to 29 minutes: 3,74630 to 34 minutes: 6,21635 to 39 minutes: 74340 to 44 minutes: 71745 to 59 minutes: 2,01460 to 89 minutes: 1,54290 or more minutes: 1,754
Means of transportation to work:
Drove a car alone: 62,516 (75.5%)Carpooled: 12,077 (14.6%)Bus or trolley bus : 900 (1.1%)Subway or elevated : 22 (0.0%)Taxi: 277 (0.3%)Motorcycle: 36 (0.0%)Bicycle: 94 (0.1%)Walked: 3,882 (4.7%)Other means: 1,490 (1.8%)Worked at home: 1,484 (1.8%)
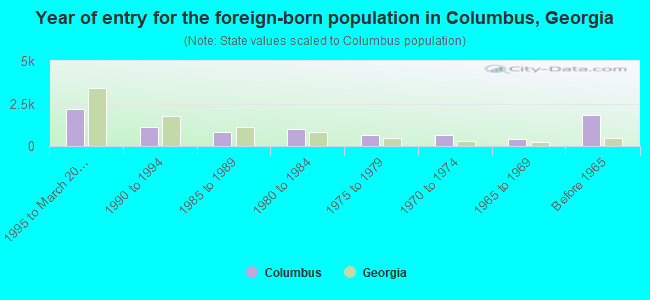
Year of entry for the foreign-born population in Columbus, Georgia
2,186 1995 to March 2000 1,099 1990 to 1994 803 1985 to 1989 988 1980 to 1984 640 1975 to 1979 669 1970 to 1974 422 1965 to 1969 1,825 Before 1965
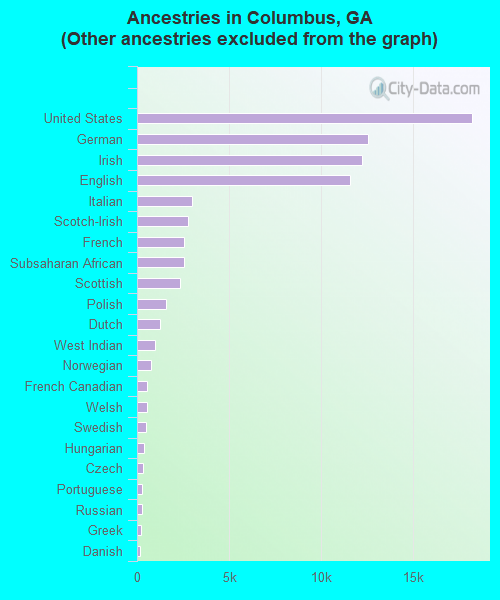
First ancestries reported:
Other: 90,124 (54.3%)
United States: 18,200 (11.0%)
German: 12,529 (7.5%)
Irish: 12,223 (7.4%)
English: 11,560 (7.0%)
Italian: 3,008 (1.8%)
Scotch-Irish: 2,742 (1.7%)
French: 2,527 (1.5%)
Subsaharan African: 2,526 (1.5%)
Scottish: 2,328 (1.4%)
Polish: 1,567 (0.9%)
Dutch: 1,258 (0.8%)
West Indian: 979 (0.6%)
Norwegian: 762 (0.5%)
French Canadian: 567 (0.3%)
Welsh: 547 (0.3%)
Swedish: 508 (0.3%)
Hungarian: 386 (0.2%)
Czech: 344 (0.2%)
Portuguese: 289 (0.2%)
Russian: 284 (0.2%)
Greek: 210 (0.1%)
Danish: 189 (0.1%)
Swiss: 106 (0.06%)
Lithuanian: 99 (0.06%)
Slovak: 93 (0.06%)
Arab: 79 (0.05%)
Ukrainian: 79 (0.05%) Most common places of birth for foreign-born residents (%): Germany Columbus:
21.4% (1,851)Georgia:
3.3% (19,039)
Mexico Columbus:
15.3% (1,324)Georgia:
33.0% (190,621)
Korea Columbus:
7.0% (602)Georgia:
4.0% (23,188)
India Columbus:
5.1% (442)Georgia:
4.8% (27,834)
Panama Columbus:
5.0% (430)Georgia:
0.7% (4,103)
Philippines Columbus:
3.7% (320)Georgia:
1.5% (8,832)
Japan Columbus:
3.5% (299)Georgia:
1.2% (6,750)
United Kingdom Columbus:
2.7% (231)Georgia:
2.9% (16,457)
Jamaica Columbus:
2.1% (185)Georgia:
2.6% (15,057)
Vietnam Columbus:
2.1% (182)Georgia:
4.4% (25,672)
Guatemala Columbus:
2.0% (175)Georgia:
2.3% (13,076)
Colombia Columbus:
1.7% (144)Georgia:
1.8% (10,584)
Other Caribbean Columbus:
1.7% (144)Georgia:
0.8% (4,626)
Dominican Republic Columbus:
1.5% (133)Georgia:
0.5% (2,845)
Place of birth for U.S.-born residents:
This state: 97,940Other state: 74,145Northeast: 9,891Midwest: 10,694South: 47,078West: 6,482 49% of Columbus residents lived in the same house 5 years ago.
Out of people who lived in different houses, 55% lived in this county.
Out of people who lived in different counties, 28% lived in Georgia.
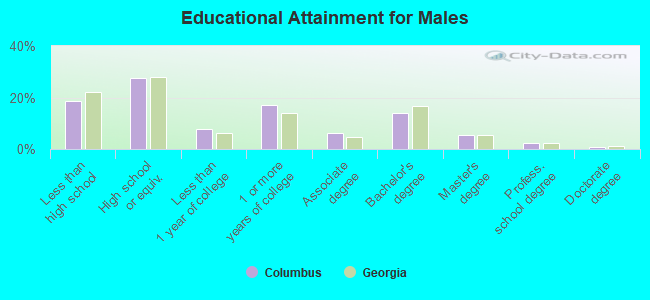
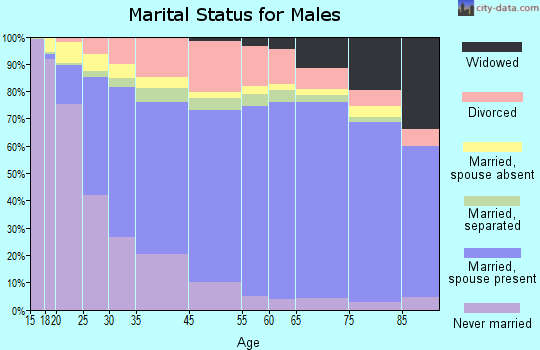
Education attainment for males 25 years and older:
No schooling: 488Nursery to 4th grade: 3605th and 6th grade: 9717th and 8th grade: 1,5249th grade: 1,29810th grade: 1,62611th grade: 1,67912th grade, no diploma: 1,820High school graduate (or equivalency): 14,320Less than 1 year of college: 4,086Some college more than 1 year, no degree: 8,978Associate degree: 3,266Bachelor's degree: 7,334Master's degree: 2,751Professional school degree: 1,162Doctorate degree: 358
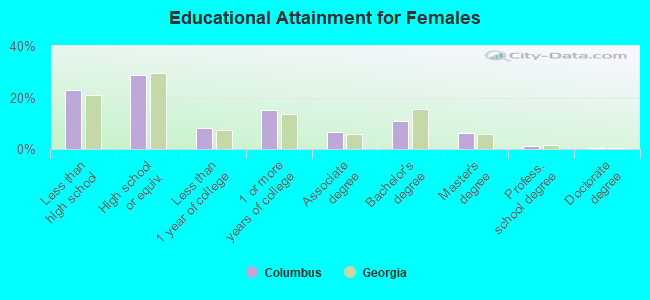
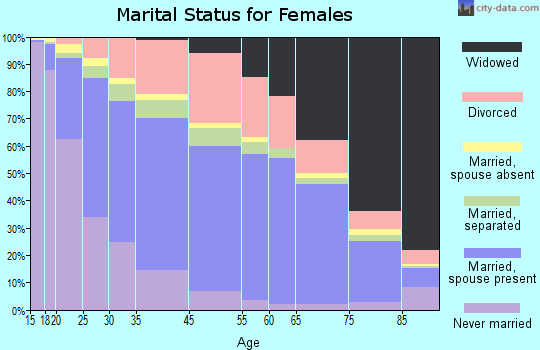
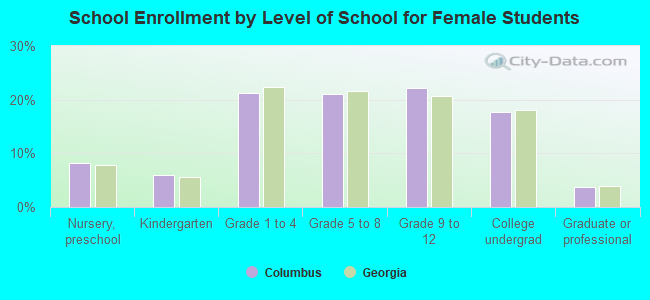
Education attainment for females 25 years and older:
No schooling: 663Nursery to 4th grade: 3925th and 6th grade: 1,3247th and 8th grade: 2,1849th grade: 1,91810th grade: 2,56511th grade: 2,52012th grade, no diploma: 2,534High school graduate (or equivalency): 17,722Less than 1 year of college: 4,961Some college more than 1 year, no degree: 9,355Associate degree: 3,998Bachelor's degree: 6,743Master's degree: 3,845Professional school degree: 749Doctorate degree: 224
Housing units in structures:
One, detached: 49,751One, attached: 2,343Two: 2,5873 or 4: 5,1785 to 9: 5,66510 to 19: 3,05320 to 49: 1,73450 or more: 2,764Mobile homes: 2,863Median worth of mobile homes: $26,582
Housing units lacking complete plumbing facilities: 0.5%Housing units lacking complete kitchen facilities: 0.8%Private vs. public school enrollment:
Students in private schools in grades 1 to 8 (elementary and middle school): 2,100 Students in private schools in grades 9 to 12 (high school): 880 Students in private undergraduate colleges: 694