Compton, CA (California) Houses and Residents
Estimated median house or condo value in 2022: $554,600 (it was $135,700 in 2000 )
Compton:
$554,600California:
$715,900
Lower value quartile - upper value quartile: $441,400 - $674,900Mean price in 2022: Detached houses: $564,145 Here:
$564,145State:
$988,808
Townhouses or other attached units: $719,349 Here:
$719,349State:
$838,546
In 2-unit structures: $544,244 Here:
$544,244State:
$1,138,100
In 3-to-4-unit structures: $647,166 Here:
$647,166State:
$824,253
In 5-or-more-unit structures: $550,641 Here:
$550,641State:
$730,996
Mobile homes: $306,928 Here:
$306,928State:
$184,506
Total population: 98,597 (Urban population: 93,226, Rural population: 0)
Houses: 24,380 (23,389 occupied: 12,269 owner occupied, 11,120 renter occupied )
% of renters here:
48%State:
44%
Housing density: 2,406 houses/condos per square mile
Median price asked for vacant for-sale houses and condos in 2022: $445,172.
Median contract rent in 2022: $1,507 (lower quartile is $1,119, upper quartile is $1,891)
Median rent asked for vacant for-rent units in 2022: $1,239
Median gross rent in Compton, CA in 2022: $1,618
Housing units in Compton with a mortgage: 8,378 (568 second mortgage, 0 home equity loan, 91 both second mortgage and home equity loan )Houses without a mortgage: 0
Median household income for houses/condos with a mortgage: $97,944
Median household income for apartments without a mortgage: $47,335
Median monthly housing costs: $1,653
Data:
Median house or condo value ($)
Median house or condo value ($ change since 2000)
Median house or condo value ($) - White
Median house or condo value ($) - Black or African American
Median house or condo value ($) - Asian
Median house or condo value ($) - Hispanic or Latino
Median house or condo value ($) - American Indian and Alaska Native
Median house or condo value ($) - Multirace
Median house or condo value ($) - Other Race
Median price asked for mobile homes ($)
Household density (households per square mile)
Mean house or condo value by units in structure - 1, detached ($)
Mean house or condo value by units in structure - 1, attached ($)
Mean house or condo value by units in structure - 2 ($)
Mean house or condo value by units in structure by units in structure - 3 or 4 ($)
Mean house or condo value by units in structure - 5 or more ($)
Mean house or condo value by units in structure - Boat, RV, van, etc. ($)
Mean house or condo value by units in structure - Mobile home ($)
Median contract rent ($)
Median contract rent - Lower quartile ($)
Median contract rent - Upper quartile ($)
Median gross rent ($)
Urban houses (%)
Rural houses (%)
Houses occupied (%)
Houses occupied (% change since 2000)
Houses owner occupied (%)
Houses owner occupied (% change since 2000)
Houses renter occupied (%)
Houses renter occupied (% change since 2000)
Vacant housing units - For rent (%)
Vacant housing units - For rent (% change since 2000)
Vacant housing units - For sale only (%)
Vacant housing units - For sale only (% change since 2000)
Vacant housing units - Rented or sold, not occupied (%)
Vacant housing units - Rented or sold, not occupied (% change since 2000)
Vacant housing units - For seasonal, recreational, or occasional use (%)
Vacant housing units - For seasonal, recreational, or occasional use (% change since 2000)
Vacant housing units - For migrant workers (%)
Vacant housing units - For migrant workers (% change since 2000)
Vacant housing units - Other vacant (%)
Vacant housing units - Other vacant (% change since 2000)
Median monthly housing costs ($)
Median household income for houses/condos with a mortgage ($)
Median household income for houses/condos without a mortgage ($)
Median household income ($)
Median household income ($) - White
Median household income ($) - Black or African American
Median household income ($) - Asian
Median household income ($) - Hispanic or Latino
Median household income ($) - American Indian and Alaska Native
Median household income ($) - Multirace
Median household income ($) - Other Race
Mortgage status - with mortgage (%)
Mortgage status - with second mortgage (%)
Mortgage status - with home equity loan (%)
Mortgage status - with both second mortgage and home equity loan (%)
Mortgage status - without a mortgage (%)
Median year house/condo built
Median year apartment built
Household type by relationship - Male householder living alone (%)
Household type by relationship - Male householder not living alone (%)
Household type by relationship - Female householder living alone (%)
Household type by relationship - Female householder not living alone (%)
Household type by relationship - Opposite-Sex spouse (%)
Household type by relationship - Same-Sex spouse (%)
Household type by relationship - Opposite-Sex unmarried partner (%)
Household type by relationship - Same-Sex unmarried partner (%)
Household type by relationship - In group quarters (%)
Size of family households - 2-person household (%)
Size of family households - 3-person household (%)
Size of family households - 4-person household (%)
Size of family households - 5-person household (%)
Size of family households - 6-person household (%)
Size of family households - 7-or-more-person household (%)
Size of nonfamily households - 1-person household (%)
Size of nonfamily households - 2-person household (%)
Size of nonfamily households - 3-person household (%)
Size of nonfamily households - 4-person household (%)
Size of nonfamily households - 5-person household (%)
Size of nonfamily households - 6-person household (%)
Size of nonfamily households - 7-or-moreperson household (%)
Year house built - Built 2010 or later (%)
Year house built - Built 2000 to 2009 (%)
Year house built - Built 1990 to 1999 (%)
Year house built - Built 1980 to 1989 (%)
Year house built - Built 1970 to 1979 (%)
Year house built - Built 1960 to 1969 (%)
Year house built - Built 1950 to 1959 (%)
Year house built - Built 1940 to 1949 (%)
Year house built - Built 1939 or earlier (%)
Median number of rooms in houses and condos
Median number of rooms in apartments
Median number of bedrooms in owner occupied houses
Mean number of bedrooms in owner occupied houses
Median number of bedrooms in renter occupied houses
Mean number of bedrooms in renter occupied houses
Median number of vehichles in owner occupied houses
Mean number of vehichles in owner occupied houses
Median number of vehichles in renter occupied houses
Mean number of vehichles in renter occupied houses
Rooms in owner-occupied houses - 1 room (%)
Rooms in owner-occupied houses - 2 rooms (%)
Rooms in owner-occupied houses - 3 rooms (%)
Rooms in owner-occupied houses - 4 rooms (%)
Rooms in owner-occupied houses - 5 rooms (%)
Rooms in owner-occupied houses - 6 rooms (%)
Rooms in owner-occupied houses - 7 rooms (%)
Rooms in owner-occupied houses - 8 rooms (%)
Rooms in owner-occupied houses - 9+ rooms (%)
Rooms in renter-occupied houses - 1 room (%)
Rooms in renter-occupied houses - 2 rooms (%)
Rooms in renter-occupied houses - 3 rooms (%)
Rooms in renter-occupied houses - 4 rooms (%)
Rooms in renter-occupied houses - 5 rooms (%)
Rooms in renter-occupied houses - 6 rooms (%)
Rooms in renter-occupied houses - 7 rooms (%)
Rooms in renter-occupied houses - 8 rooms (%)
Rooms in renter-occupied houses - 9+ rooms (%)
Bedrooms in owner-occupied houses - no bedrooms (%)
Bedrooms in owner-occupied houses - 1 bedroom (%)
Bedrooms in owner-occupied houses - 2 bedrooms (%)
Bedrooms in owner-occupied houses - 3 bedrooms (%)
Bedrooms in owner-occupied houses - 4 bedrooms (%)
Bedrooms in owner-occupied houses - 5+ bedrooms (%)
Bedrooms in renter-occupied houses - no bedrooms (%)
Bedrooms in renter-occupied houses - 1 bedroom (%)
Bedrooms in renter-occupied houses - 2 bedrooms (%)
Bedrooms in renter-occupied houses - 3 bedrooms (%)
Bedrooms in renter-occupied houses - 4 bedrooms (%)
Bedrooms in renter-occupied houses - 5+ bedrooms (%)
Vehicles available in owner-occupied houses - no vehicle available (%)
Vehicles available in owner-occupied houses - 1 vehicle available(%)
Vehicles available in owner-occupied houses - 2 Vehicles available (%)
Vehicles available in owner-occupied houses - 3 Vehicles available (%)
Vehicles available in owner-occupied houses - 4 Vehicles available (%)
Vehicles available in owner-occupied houses - 5+ Vehicles available (%)
Vehicles available in renter-occupied houses - no vehicle available (%)
Vehicles available in renter-occupied houses - 1 vehicle available (%)
Vehicles available in renter-occupied houses - 2 Vehicles available (%)
Vehicles available in renter-occupied houses - 3 Vehicles available (%)
Vehicles available in renter-occupied houses - 4 Vehicles available (%)
Vehicles available in renter-occupied houses - 5+ Vehicles available (%)
Housing units in structures - 1, detached (%)
Housing units in structures - 1, attached (%)
Housing units in structures - 2 (%)
Housing units in structures - 3 or 4 (%)
Housing units in structures - 5 to 9 (%)
Housing units in structures - 10 to 19 (%)
Housing units in structures - 20 to 49 (%)
Housing units in structures - 50 or more (%)
Housing units in structures - Mobile home (%)
Housing units in structures - Boat, RV, van, etc. (%)
Housing units in structures - Owners - 1, detached (%)
Housing units in structures - Owners - 1, attached (%)
Housing units in structures - Owners - 2 (%)
Housing units in structures - Owners - 3 or 4 (%)
Housing units in structures - Owners - 5 to 9 (%)
Housing units in structures - Owners - 10 to 19 (%)
Housing units in structures - Owners - 20 to 49 (%)
Housing units in structures - Owners - 50 or more (%)
Housing units in structures - Owners - Mobile home (%)
Housing units in structures - Owners - Boat, RV, van, etc. (%)
Housing units in structures - Renters - 1, detached (%)
Housing units in structures - Renters - 1, attached (%)
Housing units in structures - Renters - 2 (%)
Housing units in structures - Renters - 3 or 4 (%)
Housing units in structures - Renters - 5 to 9 (%)
Housing units in structures - Renters - 10 to 19 (%)
Housing units in structures - Renters - 20 to 49 (%)
Housing units in structures - Renters - 50 or more (%)
Housing units in structures - Renters - Mobile home (%)
Housing units in structures - Renters - Boat, RV, van, etc. (%)
House/condo owner moved in on average (years ago)
Renter moved in on average (years ago)
Year householder moved into unit - Moved in 1999 to March 2000 (%)
Year householder moved into unit - Moved in 1999 to March 2000 (%) - White
Year householder moved into unit - Moved in 1999 to March 2000 (%) - Black or African American
Year householder moved into unit - Moved in 1999 to March 2000 (%) - Asian
Year householder moved into unit - Moved in 1999 to March 2000 (%) - Hispanic or Latino
Year householder moved into unit - Moved in 1999 to March 2000 (%) - American Indian and Alaska Native
Year householder moved into unit - Moved in 1999 to March 2000 (%) - Multirace
Year householder moved into unit - Moved in 1999 to March 2000 (%) - Other Race
Year householder moved into unit - Moved in 1995 to 1998 (%)
Year householder moved into unit - Moved in 1995 to 1998 (%) - White
Year householder moved into unit - Moved in 1995 to 1998 (%) - Black or African American
Year householder moved into unit - Moved in 1995 to 1998 (%) - Asian
Year householder moved into unit - Moved in 1995 to 1998 (%) - Hispanic or Latino
Year householder moved into unit - Moved in 1995 to 1998 (%) - American Indian and Alaska Native
Year householder moved into unit - Moved in 1995 to 1998 (%) - Multirace
Year householder moved into unit - Moved in 1995 to 1998 (%) - Other Race
Year householder moved into unit - Moved in 1990 to 1994 (%)
Year householder moved into unit - Moved in 1990 to 1994 (%) - White
Year householder moved into unit - Moved in 1990 to 1994 (%) - Black or African American
Year householder moved into unit - Moved in 1990 to 1994 (%) - Asian
Year householder moved into unit - Moved in 1990 to 1994 (%) - Hispanic or Latino
Year householder moved into unit - Moved in 1990 to 1994 (%) - American Indian and Alaska Native
Year householder moved into unit - Moved in 1990 to 1994 (%) - Multirace
Year householder moved into unit - Moved in 1990 to 1994 (%) - Other Race
Year householder moved into unit - Moved in 1980 to 1989 (%)
Year householder moved into unit - Moved in 1980 to 1989 (%) - White
Year householder moved into unit - Moved in 1980 to 1989 (%) - Black or African American
Year householder moved into unit - Moved in 1980 to 1989 (%) - Asian
Year householder moved into unit - Moved in 1980 to 1989 (%) - Hispanic or Latino
Year householder moved into unit - Moved in 1980 to 1989 (%) - American Indian and Alaska Native
Year householder moved into unit - Moved in 1980 to 1989 (%) - Multirace
Year householder moved into unit - Moved in 1980 to 1989 (%) - Other Race
Year householder moved into unit - Moved in 1970 to 1979 (%)
Year householder moved into unit - Moved in 1970 to 1979 (%) - White
Year householder moved into unit - Moved in 1970 to 1979 (%) - Black or African American
Year householder moved into unit - Moved in 1970 to 1979 (%) - Asian
Year householder moved into unit - Moved in 1970 to 1979 (%) - Hispanic or Latino
Year householder moved into unit - Moved in 1970 to 1979 (%) - American Indian and Alaska Native
Year householder moved into unit - Moved in 1970 to 1979 (%) - Multirace
Year householder moved into unit - Moved in 1970 to 1979 (%) - Other Race
Year householder moved into unit - Moved in 1969 or earlier (%)
Year householder moved into unit - Moved in 1969 or earlier (%) - White
Year householder moved into unit - Moved in 1969 or earlier (%) - Black or African American
Year householder moved into unit - Moved in 1969 or earlier (%) - Asian
Year householder moved into unit - Moved in 1969 or earlier (%) - Hispanic or Latino
Year householder moved into unit - Moved in 1969 or earlier (%) - American Indian and Alaska Native
Year householder moved into unit - Moved in 1969 or earlier (%) - Multirace
Year householder moved into unit - Moved in 1969 or earlier (%) - Other Race
Housing units lacking complete plumbing facilities (%)
Housing units lacking complete kitchen facilities (%)
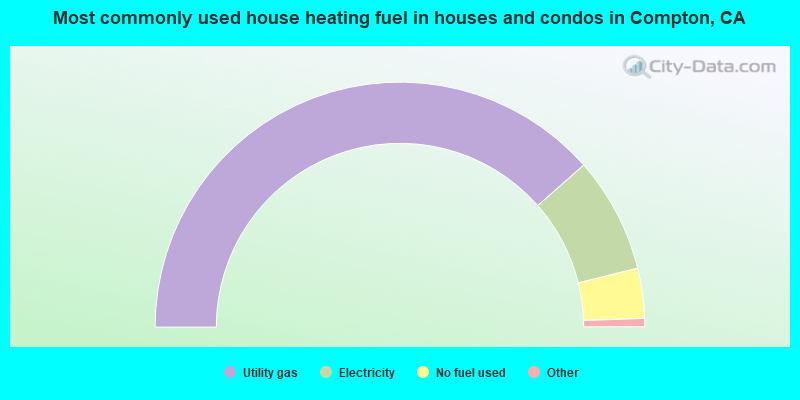
House heating fuel used in houses and condos - Utility gas (%)
House heating fuel used in houses and condos - Bottled, tank, or LP gas (%)
House heating fuel used in houses and condos - Electricity (%)
House heating fuel used in houses and condos - Fuel oil, kerosene, etc. (%)
House heating fuel used in houses and condos - Coal or coke (%)
House heating fuel used in houses and condos - Wood (%)
House heating fuel used in houses and condos - Solar energy (%)
House heating fuel used in houses and condos - Other fuel (%)
House heating fuel used in houses and condos - No fuel used (%)
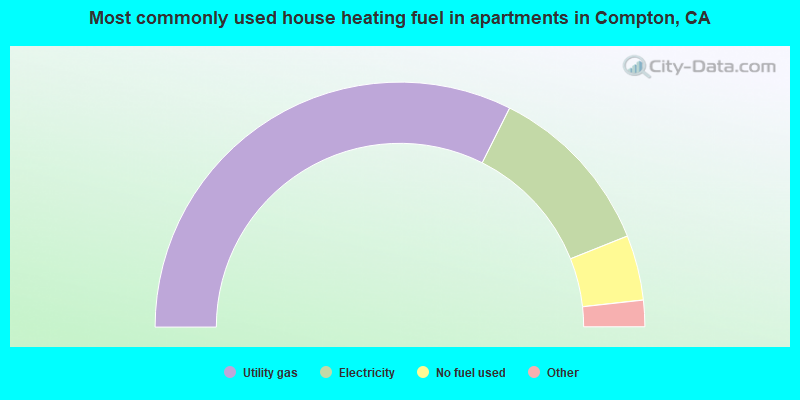
House heating fuel used in apartments - Utility gas (%)
House heating fuel used in apartments - Bottled, tank, or LP gas (%)
House heating fuel used in apartments - Electricity (%)
House heating fuel used in apartments - Fuel oil, kerosene, etc. (%)
House heating fuel used in apartments - Coal or coke (%)
House heating fuel used in apartments - Wood (%)
House heating fuel used in apartments - Solar energy (%)
House heating fuel used in apartments - Other fuel (%)
House heating fuel used in apartments - No fuel used (%)
Latest news about housing in Compton, CA collected exclusively by city-data.com from local newspapers, TV, and radio stations
Median year house/condo built: 1955Median year apartment built: 1974Household type by relationship:
Households: 91,979
Male householders: 10,878 (1,117 living alone ), Female householders: 12,511 (3,064 living alone )10,714 spouses (10,615 opposite-sex spouses ), 1,239 unmarried partners , (1,017 opposite-sex unmarried partners ), 33,018 children (31,468 natural , 406 adopted , 1,144 stepchildren ), 7,172 grandchildren , 3,984 brothers or sisters , 3,524 parents , 226 foster children , 5,149 other relatives , 3,153 non-relatives In group quarters: 411
Size of family households: 3,872 2-persons , 2,853 3-persons , 4,239 4-persons , 3,603 5-persons , 1,329 6-persons , 2,796 7-or-more-persons .
Size of nonfamily households: 4,181 1-person , 233 2-persons , 237 3-persons , 46 4-persons .
12,429 married couples with children. single-parent households (2,003 men , 3,461 women ).
35.7% of residents of Compton speak English at home. of residents speak Spanish at home (64% speak English very well , 15% speak English well , 11% speak English not well , 10% don't speak English at all ).of residents speak other Indo-European language at home (93% speak English very well , 7% speak English well ).of residents speak Asian or Pacific Island language at home (54% speak English very well , 18% speak English well , 23% speak English not well , 5% don't speak English at all ).
Foreign born population: 26,778 (29.1%)of them are naturalized citizens )
Median number of rooms in houses and condos:
Median number of rooms in apartments
Owner-occupied Renter-occupied
Rooms in owner-occupied houses in Compton, California
90 1 room 130 2 rooms 181 3 rooms 2,681 4 rooms 3,615 5 rooms 2,594 6 rooms 1,341 7 rooms 1,136 8 rooms 501 9+ rooms
Rooms in renter-occupied apartments in Compton, California
475 1 room 612 2 rooms 2,171 3 rooms 3,652 4 rooms 2,389 5 rooms 1,210 6 rooms 470 7 rooms 107 8 rooms 34 9+ rooms
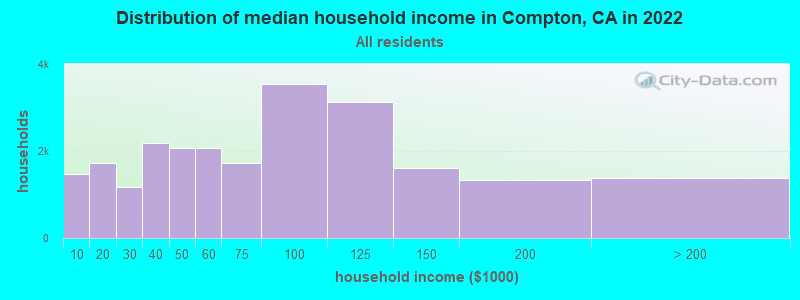
Compton, CA household income distribution 1,475 Less than $10,0001,732 $10,000 to $19,9991,181 $20,000 to $29,9992,173 $30,000 to $39,9992,061 $40,000 to $49,9992,067 $50,000 to $59,9991,715 $60,000 to $74,9993,548 $75,000 to $99,9993,115 $100,000 to $124,9991,601 $125,000 to $149,9991,342 $150,000 to $199,9991,379 $200,000 or more
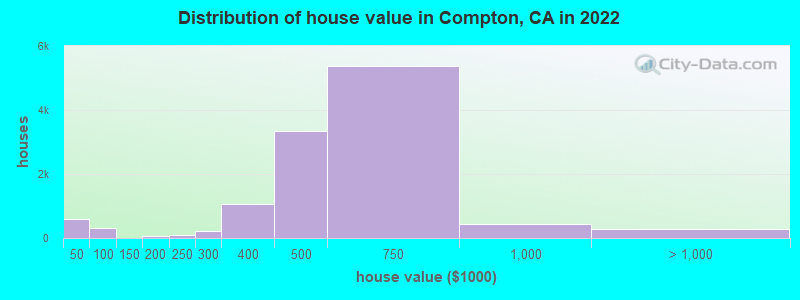
Home value of owner - occupied houses in 2022 in Compton, CA 318 Less than $10,00011 $10,000 to $14,99914 $15,000 to $19,99910 $20,000 to $24,99945 $30,000 to $34,9994 $35,000 to $39,999177 $40,000 to $49,99976 $50,000 to $59,9997 $80,000 to $89,99956 $90,000 to $99,99914 $125,000 to $149,99956 $150,000 to $174,99916 $175,000 to $199,999104 $200,000 to $249,999224 $250,000 to $299,9991,067 $300,000 to $399,9993,340 $400,000 to $499,9995,365 $500,000 to $749,999424 $750,000 to $999,99993 $1,000,000 to $1,499,999181 $2,000,000 or moreRent paid by renters in 2022 in Compton, CA 76 Less than $10041 $100 to $149189 $200 to $24976 $250 to $29947 $300 to $34952 $350 to $39948 $400 to $44964 $450 to $49933 $500 to $54969 $550 to $59983 $600 to $64975 $650 to $699117 $700 to $749118 $750 to $799527 $800 to $899857 $900 to $9992,071 $1,000 to $1,2491,919 $1,250 to $1,4992,909 $1,500 to $1,999841 $2,000 to $2,499123 $2,500 to $2,99986 $3,000 to $3,49947 $3,500 or more238 No cash rent
Percentage of workers working in this county: 95.5%Number of people working at home: 1,707 (4.3% of all workers )
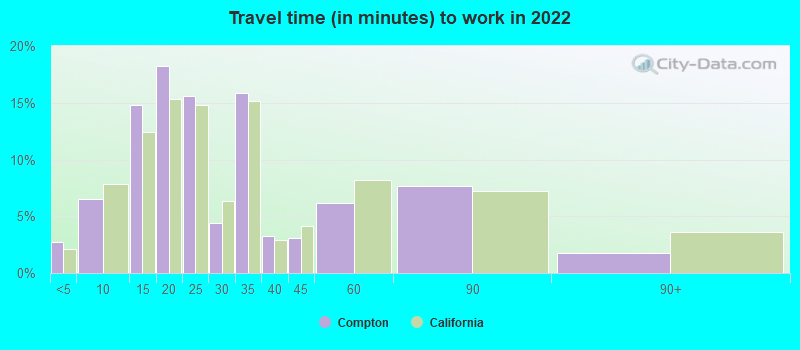
Travel time to work (commute)
Less than 5 minutes: 9085 to 9 minutes: 1,17810 to 14 minutes: 3,59715 to 19 minutes: 4,72120 to 24 minutes: 6,63725 to 29 minutes: 2,23630 to 34 minutes: 7,60935 to 39 minutes: 1,40540 to 44 minutes: 1,65945 to 59 minutes: 2,28260 to 89 minutes: 1,85590 or more minutes: 824
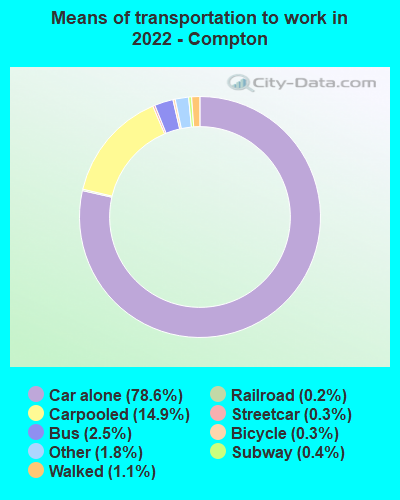
Means of transportation to work:
Drove a car alone: 20,173 (71.1%)Carpooled: 4,223 (14.9%)Bus : 581 (2.0%)Subway or elevated rail : 56 (0.2%)Long-distance train or commuter rail : 55 (0.2%)Light rail, streetcar or trolley : 26 (0.1%)Taxi: 499 (1.8%)Bicycle: 86 (0.3%)Walked: 302 (1.1%)Worked at home: 1,707 (6.0%)
Unemployment by race in 2022
Unemployment rate for White non-Hispanic residents 1.1% MalesUnemployment rate for Black residents 20.5% Males1.1% FemalesUnemployment rate for American Indian and Alaska Native residents 13.7% Males3.9% FemalesUnemployment rate for Asian residents 3.8% FemalesUnemployment rate for other race residents 8.8% Males5.5% FemalesUnemployment rate for two or more race residents 6.8% Males7.2% FemalesUnemployment rate for Hispanic or Latino residents 8.3% Males6.0% Females
Year of entry for the foreign-born population in Compton, California
2,774 2010 or later 4,657 2000 to 2009 6,875 1990 to 1999 10,688 1980 to 1989 7,203 1970 to 1979 1,372 Before 1970
First ancestries reported:
African: 1,182 (1.6%)
American: 287 (0.4%)
Belizean: 118 (0.2%)
Jamaican: 85 (0.1%)
Canadian: 50 (0.07%)
Italian: 46 (0.06%)
Nigerian: 30 (0.04%)
French: 27 (0.04%)
German: 23 (0.03%)
Welsh: 21 (0.03%)
Russian: 17 (0.02%)
Iranian: 13 (0.02%)
Northern European: 12 (0.02%)
European: 11 (0.02%) Most common places of birth for foreign-born residents (%): Mexico Compton:
77.0% (20,910)California:
37.2% (3,881,193)
El Salvador Compton:
8.5% (2,308)California:
4.2% (440,287)
Guatemala Compton:
5.0% (1,356)California:
2.8% (290,436)
Honduras Compton:
2.6% (719)California:
0.6% (66,590)
Place of birth for U.S.-born residents:
This state: 59,897Other state: 4,720Northeast: 162Midwest: 745South: 3,103West: 710 96.2% of Compton residents lived in the same house 1 years ago.
Out of people who lived in different houses, 45.5% lived in this county.
Out of people who lived in different counties, 47.4% lived in California.
Compton:
96.2%State average:
88.9%
Education attainment for males 25 years and older:
No schooling: 1,659Nursery to 4th grade: 8025th and 6th grade: 2,6947th and 8th grade: 1,0679th grade: 50910th grade: 30711th grade: 54812th grade, no diploma: 2,184High school graduate (or equivalency): 6,539Less than 1 year of college: 2,520Some college more than 1 year, no degree: 3,026Associate degree: 2,775Bachelor's degree: 2,011Master's degree: 489Professional school degree: 0Doctorate degree: 0
Education attainment for females 25 years and older:
No schooling: 2,040Nursery to 4th grade: 1,5075th and 6th grade: 1,8437th and 8th grade: 1,2769th grade: 64410th grade: 85911th grade: 49712th grade, no diploma: 1,245High school graduate (or equivalency): 7,672Less than 1 year of college: 1,851Some college more than 1 year, no degree: 2,682Associate degree: 2,677Bachelor's degree: 2,688Master's degree: 1,957Professional school degree: 165Doctorate degree: 76
Housing units in structures:
One, detached: 17,083One, attached: 1,668Two: 5063 or 4: 1,7585 to 9: 46810 to 19: 1,28620 to 49: 25050 or more: 669Mobile homes: 692Median worth of mobile homes: $9,999
Housing units lacking complete plumbing facilities in 2022: 1.5%Housing units lacking complete kitchen facilities in 2022: 1.7%House/condo owner moved in on average 18 years ago
Renter moved in on average 8 years ago
Private vs. public school enrollment:
Students in private schools in grades 1 to 8 (elementary and middle school): 313 Here:
2.9%California:
10.5%
Students in private schools in grades 9 to 12 (high school): 122 Students in private undergraduate colleges: 500 Here:
11.8%California:
15.9%