Concord, NH (New Hampshire) Houses and Residents
Estimated median house or condo value in 2022: $348,097 (it was $105,700 in 2000 )
Concord:
$348,097New Hampshire:
$384,700
Lower value quartile - upper value quartile: $258,464 - $460,110Mean price in 2022: Detached houses: $386,442 Here:
$386,442State:
$491,479
Townhouses or other attached units: $177,998 Here:
$177,998State:
$361,001
In 2-unit structures: $379,330 Here:
$379,330State:
$368,847
In 3-to-4-unit structures: $382,983 Here:
$382,983State:
$575,942
In 5-or-more-unit structures: $394,296 Here:
$394,296State:
$274,068
Mobile homes: $79,285 Here:
$79,285State:
$124,817
Total population: 42,444 (Urban population: 34,538 (all inside urban clusters), Rural population: 6,149 (115 farm, 6,034 nonfarm ))
Houses: 19,093 (18,173 occupied: 10,648 owner occupied, 7,958 renter occupied )
% of renters here:
43%State:
28%
Housing density: 297 houses/condos per square mile
Median price asked for vacant for-sale houses and condos in 2022: $75,351.
Median contract rent in 2022: $1,217 (lower quartile is $875, upper quartile is $1,535)
Median rent asked for vacant for-rent units in 2022: $1,438
Median gross rent in Concord, NH in 2022: $1,394
Housing units in Concord with a mortgage: 7,069 (562 second mortgage, 13 home equity loan, 532 both second mortgage and home equity loan )Houses without a mortgage: 310
Median household income for houses/condos with a mortgage: $108,934
Median household income for apartments without a mortgage: $88,259
Median monthly housing costs: $1,460
Data:
Median house or condo value ($)
Median house or condo value ($ change since 2000)
Median house or condo value ($) - White
Median house or condo value ($) - Black or African American
Median house or condo value ($) - Asian
Median house or condo value ($) - Hispanic or Latino
Median house or condo value ($) - American Indian and Alaska Native
Median house or condo value ($) - Multirace
Median house or condo value ($) - Other Race
Median price asked for mobile homes ($)
Household density (households per square mile)
Mean house or condo value by units in structure - 1, detached ($)
Mean house or condo value by units in structure - 1, attached ($)
Mean house or condo value by units in structure - 2 ($)
Mean house or condo value by units in structure by units in structure - 3 or 4 ($)
Mean house or condo value by units in structure - 5 or more ($)
Mean house or condo value by units in structure - Boat, RV, van, etc. ($)
Mean house or condo value by units in structure - Mobile home ($)
Median contract rent ($)
Median contract rent - Lower quartile ($)
Median contract rent - Upper quartile ($)
Median gross rent ($)
Urban houses (%)
Rural houses (%)
Houses occupied (%)
Houses occupied (% change since 2000)
Houses owner occupied (%)
Houses owner occupied (% change since 2000)
Houses renter occupied (%)
Houses renter occupied (% change since 2000)
Vacant housing units - For rent (%)
Vacant housing units - For rent (% change since 2000)
Vacant housing units - For sale only (%)
Vacant housing units - For sale only (% change since 2000)
Vacant housing units - Rented or sold, not occupied (%)
Vacant housing units - Rented or sold, not occupied (% change since 2000)
Vacant housing units - For seasonal, recreational, or occasional use (%)
Vacant housing units - For seasonal, recreational, or occasional use (% change since 2000)
Vacant housing units - For migrant workers (%)
Vacant housing units - For migrant workers (% change since 2000)
Vacant housing units - Other vacant (%)
Vacant housing units - Other vacant (% change since 2000)
Median monthly housing costs ($)
Median household income for houses/condos with a mortgage ($)
Median household income for houses/condos without a mortgage ($)
Median household income ($)
Median household income ($) - White
Median household income ($) - Black or African American
Median household income ($) - Asian
Median household income ($) - Hispanic or Latino
Median household income ($) - American Indian and Alaska Native
Median household income ($) - Multirace
Median household income ($) - Other Race
Mortgage status - with mortgage (%)
Mortgage status - with second mortgage (%)
Mortgage status - with home equity loan (%)
Mortgage status - with both second mortgage and home equity loan (%)
Mortgage status - without a mortgage (%)
Median year house/condo built
Median year apartment built
Household type by relationship - Male householder living alone (%)
Household type by relationship - Male householder not living alone (%)
Household type by relationship - Female householder living alone (%)
Household type by relationship - Female householder not living alone (%)
Household type by relationship - Opposite-Sex spouse (%)
Household type by relationship - Same-Sex spouse (%)
Household type by relationship - Opposite-Sex unmarried partner (%)
Household type by relationship - Same-Sex unmarried partner (%)
Household type by relationship - In group quarters (%)
Size of family households - 2-person household (%)
Size of family households - 3-person household (%)
Size of family households - 4-person household (%)
Size of family households - 5-person household (%)
Size of family households - 6-person household (%)
Size of family households - 7-or-more-person household (%)
Size of nonfamily households - 1-person household (%)
Size of nonfamily households - 2-person household (%)
Size of nonfamily households - 3-person household (%)
Size of nonfamily households - 4-person household (%)
Size of nonfamily households - 5-person household (%)
Size of nonfamily households - 6-person household (%)
Size of nonfamily households - 7-or-moreperson household (%)
Year house built - Built 2010 or later (%)
Year house built - Built 2000 to 2009 (%)
Year house built - Built 1990 to 1999 (%)
Year house built - Built 1980 to 1989 (%)
Year house built - Built 1970 to 1979 (%)
Year house built - Built 1960 to 1969 (%)
Year house built - Built 1950 to 1959 (%)
Year house built - Built 1940 to 1949 (%)
Year house built - Built 1939 or earlier (%)
Median number of rooms in houses and condos
Median number of rooms in apartments
Median number of bedrooms in owner occupied houses
Mean number of bedrooms in owner occupied houses
Median number of bedrooms in renter occupied houses
Mean number of bedrooms in renter occupied houses
Median number of vehichles in owner occupied houses
Mean number of vehichles in owner occupied houses
Median number of vehichles in renter occupied houses
Mean number of vehichles in renter occupied houses
Rooms in owner-occupied houses - 1 room (%)
Rooms in owner-occupied houses - 2 rooms (%)
Rooms in owner-occupied houses - 3 rooms (%)
Rooms in owner-occupied houses - 4 rooms (%)
Rooms in owner-occupied houses - 5 rooms (%)
Rooms in owner-occupied houses - 6 rooms (%)
Rooms in owner-occupied houses - 7 rooms (%)
Rooms in owner-occupied houses - 8 rooms (%)
Rooms in owner-occupied houses - 9+ rooms (%)
Rooms in renter-occupied houses - 1 room (%)
Rooms in renter-occupied houses - 2 rooms (%)
Rooms in renter-occupied houses - 3 rooms (%)
Rooms in renter-occupied houses - 4 rooms (%)
Rooms in renter-occupied houses - 5 rooms (%)
Rooms in renter-occupied houses - 6 rooms (%)
Rooms in renter-occupied houses - 7 rooms (%)
Rooms in renter-occupied houses - 8 rooms (%)
Rooms in renter-occupied houses - 9+ rooms (%)
Bedrooms in owner-occupied houses - no bedrooms (%)
Bedrooms in owner-occupied houses - 1 bedroom (%)
Bedrooms in owner-occupied houses - 2 bedrooms (%)
Bedrooms in owner-occupied houses - 3 bedrooms (%)
Bedrooms in owner-occupied houses - 4 bedrooms (%)
Bedrooms in owner-occupied houses - 5+ bedrooms (%)
Bedrooms in renter-occupied houses - no bedrooms (%)
Bedrooms in renter-occupied houses - 1 bedroom (%)
Bedrooms in renter-occupied houses - 2 bedrooms (%)
Bedrooms in renter-occupied houses - 3 bedrooms (%)
Bedrooms in renter-occupied houses - 4 bedrooms (%)
Bedrooms in renter-occupied houses - 5+ bedrooms (%)
Vehicles available in owner-occupied houses - no vehicle available (%)
Vehicles available in owner-occupied houses - 1 vehicle available(%)
Vehicles available in owner-occupied houses - 2 Vehicles available (%)
Vehicles available in owner-occupied houses - 3 Vehicles available (%)
Vehicles available in owner-occupied houses - 4 Vehicles available (%)
Vehicles available in owner-occupied houses - 5+ Vehicles available (%)
Vehicles available in renter-occupied houses - no vehicle available (%)
Vehicles available in renter-occupied houses - 1 vehicle available (%)
Vehicles available in renter-occupied houses - 2 Vehicles available (%)
Vehicles available in renter-occupied houses - 3 Vehicles available (%)
Vehicles available in renter-occupied houses - 4 Vehicles available (%)
Vehicles available in renter-occupied houses - 5+ Vehicles available (%)
Housing units in structures - 1, detached (%)
Housing units in structures - 1, attached (%)
Housing units in structures - 2 (%)
Housing units in structures - 3 or 4 (%)
Housing units in structures - 5 to 9 (%)
Housing units in structures - 10 to 19 (%)
Housing units in structures - 20 to 49 (%)
Housing units in structures - 50 or more (%)
Housing units in structures - Mobile home (%)
Housing units in structures - Boat, RV, van, etc. (%)
Housing units in structures - Owners - 1, detached (%)
Housing units in structures - Owners - 1, attached (%)
Housing units in structures - Owners - 2 (%)
Housing units in structures - Owners - 3 or 4 (%)
Housing units in structures - Owners - 5 to 9 (%)
Housing units in structures - Owners - 10 to 19 (%)
Housing units in structures - Owners - 20 to 49 (%)
Housing units in structures - Owners - 50 or more (%)
Housing units in structures - Owners - Mobile home (%)
Housing units in structures - Owners - Boat, RV, van, etc. (%)
Housing units in structures - Renters - 1, detached (%)
Housing units in structures - Renters - 1, attached (%)
Housing units in structures - Renters - 2 (%)
Housing units in structures - Renters - 3 or 4 (%)
Housing units in structures - Renters - 5 to 9 (%)
Housing units in structures - Renters - 10 to 19 (%)
Housing units in structures - Renters - 20 to 49 (%)
Housing units in structures - Renters - 50 or more (%)
Housing units in structures - Renters - Mobile home (%)
Housing units in structures - Renters - Boat, RV, van, etc. (%)
House/condo owner moved in on average (years ago)
Renter moved in on average (years ago)
Year householder moved into unit - Moved in 1999 to March 2000 (%)
Year householder moved into unit - Moved in 1999 to March 2000 (%) - White
Year householder moved into unit - Moved in 1999 to March 2000 (%) - Black or African American
Year householder moved into unit - Moved in 1999 to March 2000 (%) - Asian
Year householder moved into unit - Moved in 1999 to March 2000 (%) - Hispanic or Latino
Year householder moved into unit - Moved in 1999 to March 2000 (%) - American Indian and Alaska Native
Year householder moved into unit - Moved in 1999 to March 2000 (%) - Multirace
Year householder moved into unit - Moved in 1999 to March 2000 (%) - Other Race
Year householder moved into unit - Moved in 1995 to 1998 (%)
Year householder moved into unit - Moved in 1995 to 1998 (%) - White
Year householder moved into unit - Moved in 1995 to 1998 (%) - Black or African American
Year householder moved into unit - Moved in 1995 to 1998 (%) - Asian
Year householder moved into unit - Moved in 1995 to 1998 (%) - Hispanic or Latino
Year householder moved into unit - Moved in 1995 to 1998 (%) - American Indian and Alaska Native
Year householder moved into unit - Moved in 1995 to 1998 (%) - Multirace
Year householder moved into unit - Moved in 1995 to 1998 (%) - Other Race
Year householder moved into unit - Moved in 1990 to 1994 (%)
Year householder moved into unit - Moved in 1990 to 1994 (%) - White
Year householder moved into unit - Moved in 1990 to 1994 (%) - Black or African American
Year householder moved into unit - Moved in 1990 to 1994 (%) - Asian
Year householder moved into unit - Moved in 1990 to 1994 (%) - Hispanic or Latino
Year householder moved into unit - Moved in 1990 to 1994 (%) - American Indian and Alaska Native
Year householder moved into unit - Moved in 1990 to 1994 (%) - Multirace
Year householder moved into unit - Moved in 1990 to 1994 (%) - Other Race
Year householder moved into unit - Moved in 1980 to 1989 (%)
Year householder moved into unit - Moved in 1980 to 1989 (%) - White
Year householder moved into unit - Moved in 1980 to 1989 (%) - Black or African American
Year householder moved into unit - Moved in 1980 to 1989 (%) - Asian
Year householder moved into unit - Moved in 1980 to 1989 (%) - Hispanic or Latino
Year householder moved into unit - Moved in 1980 to 1989 (%) - American Indian and Alaska Native
Year householder moved into unit - Moved in 1980 to 1989 (%) - Multirace
Year householder moved into unit - Moved in 1980 to 1989 (%) - Other Race
Year householder moved into unit - Moved in 1970 to 1979 (%)
Year householder moved into unit - Moved in 1970 to 1979 (%) - White
Year householder moved into unit - Moved in 1970 to 1979 (%) - Black or African American
Year householder moved into unit - Moved in 1970 to 1979 (%) - Asian
Year householder moved into unit - Moved in 1970 to 1979 (%) - Hispanic or Latino
Year householder moved into unit - Moved in 1970 to 1979 (%) - American Indian and Alaska Native
Year householder moved into unit - Moved in 1970 to 1979 (%) - Multirace
Year householder moved into unit - Moved in 1970 to 1979 (%) - Other Race
Year householder moved into unit - Moved in 1969 or earlier (%)
Year householder moved into unit - Moved in 1969 or earlier (%) - White
Year householder moved into unit - Moved in 1969 or earlier (%) - Black or African American
Year householder moved into unit - Moved in 1969 or earlier (%) - Asian
Year householder moved into unit - Moved in 1969 or earlier (%) - Hispanic or Latino
Year householder moved into unit - Moved in 1969 or earlier (%) - American Indian and Alaska Native
Year householder moved into unit - Moved in 1969 or earlier (%) - Multirace
Year householder moved into unit - Moved in 1969 or earlier (%) - Other Race
Housing units lacking complete plumbing facilities (%)
Housing units lacking complete kitchen facilities (%)
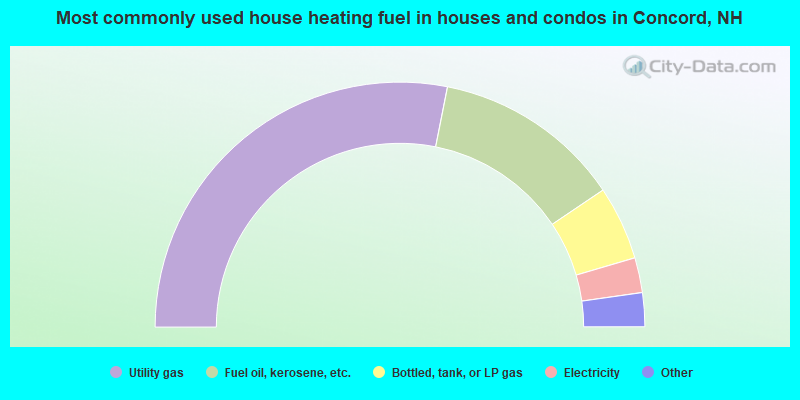
House heating fuel used in houses and condos - Utility gas (%)
House heating fuel used in houses and condos - Bottled, tank, or LP gas (%)
House heating fuel used in houses and condos - Electricity (%)
House heating fuel used in houses and condos - Fuel oil, kerosene, etc. (%)
House heating fuel used in houses and condos - Coal or coke (%)
House heating fuel used in houses and condos - Wood (%)
House heating fuel used in houses and condos - Solar energy (%)
House heating fuel used in houses and condos - Other fuel (%)
House heating fuel used in houses and condos - No fuel used (%)
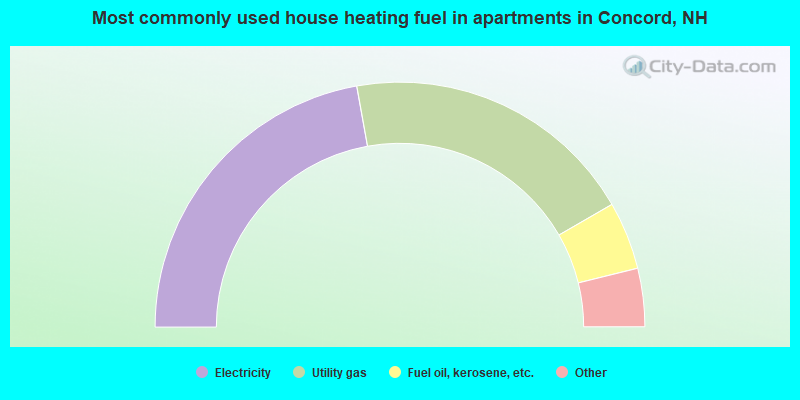
House heating fuel used in apartments - Utility gas (%)
House heating fuel used in apartments - Bottled, tank, or LP gas (%)
House heating fuel used in apartments - Electricity (%)
House heating fuel used in apartments - Fuel oil, kerosene, etc. (%)
House heating fuel used in apartments - Coal or coke (%)
House heating fuel used in apartments - Wood (%)
House heating fuel used in apartments - Solar energy (%)
House heating fuel used in apartments - Other fuel (%)
House heating fuel used in apartments - No fuel used (%)
Latest news about housing in Concord, NH collected exclusively by city-data.com from local newspapers, TV, and radio stations
Median year house/condo built: 1974Median year apartment built: 1973Household type by relationship:
Households: 44,650
Male householders: 9,169 (2,520 living alone ), Female householders: 9,030 (3,321 living alone )7,909 spouses (7,784 opposite-sex spouses ), 1,660 unmarried partners , (1,593 opposite-sex unmarried partners ), 10,066 children (9,358 natural , 264 adopted , 443 stepchildren ), 601 grandchildren , 549 brothers or sisters , 573 parents , 0 foster children , 594 other relatives , 1,468 non-relatives In group quarters: 3,026
Size of family households: 5,897 2-persons , 1,993 3-persons , 1,810 4-persons , 644 5-persons , 386 6-persons , 104 7-or-more-persons .
Size of nonfamily households: 6,439 1-person , 1,301 2-persons , 135 3-persons , 49 4-persons , 28 5-persons , 1 6-persons .
4,987 married couples with children. single-parent households (714 men , 1,135 women ).
91.1% of residents of Concord speak English at home. of residents speak Spanish at home (79% speak English very well , 11% speak English well , 10% speak English not well ).of residents speak other Indo-European language at home (54% speak English very well , 25% speak English well , 14% speak English not well , 8% don't speak English at all ).of residents speak Asian or Pacific Island language at home (78% speak English very well , 16% speak English well , 6% speak English not well ).of residents speak other language at home (17% speak English very well , 39% speak English well , 27% speak English not well , 17% don't speak English at all ).
Foreign born population: 2,686 (6.0%)of them are naturalized citizens )
Median number of rooms in houses and condos:
Median number of rooms in apartments
Owner-occupied Renter-occupied
Rooms in owner-occupied houses in Concord, New Hampshire
24 1 room 44 2 rooms 308 3 rooms 1,169 4 rooms 1,680 5 rooms 2,072 6 rooms 1,976 7 rooms 1,516 8 rooms 1,860 9+ rooms
Rooms in renter-occupied apartments in Concord, New Hampshire
301 1 room 463 2 rooms 2,177 3 rooms 2,677 4 rooms 1,047 5 rooms 613 6 rooms 351 7 rooms 191 8 rooms 139 9+ rooms
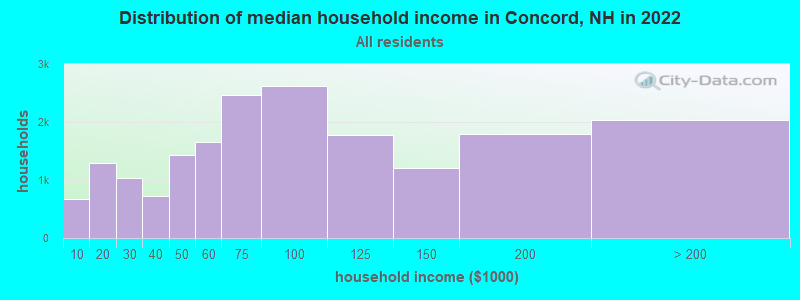
Concord, NH household income distribution 677 Less than $10,0001,295 $10,000 to $19,9991,031 $20,000 to $29,999719 $30,000 to $39,9991,434 $40,000 to $49,9991,660 $50,000 to $59,9992,459 $60,000 to $74,9992,617 $75,000 to $99,9991,782 $100,000 to $124,9991,215 $125,000 to $149,9991,788 $150,000 to $199,9992,036 $200,000 or more
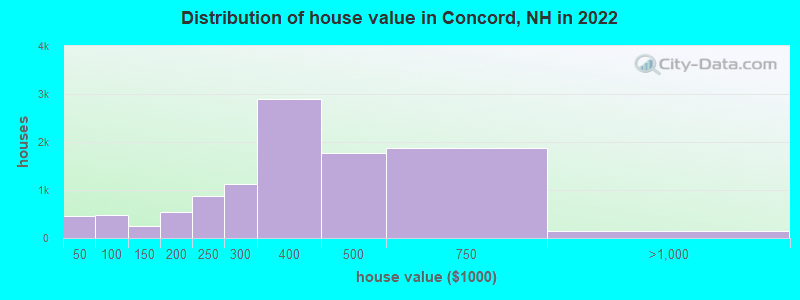
Home value of owner - occupied houses in 2022 in Concord, NH 91 Less than $10,00049 $10,000 to $14,99911 $15,000 to $19,99955 $20,000 to $24,99942 $25,000 to $29,99971 $30,000 to $34,99947 $35,000 to $39,99992 $40,000 to $49,99979 $50,000 to $59,99938 $60,000 to $69,999163 $70,000 to $79,999101 $80,000 to $89,99911 $90,000 to $99,99981 $100,000 to $124,999163 $125,000 to $149,999281 $150,000 to $174,999270 $175,000 to $199,999878 $200,000 to $249,9991,126 $250,000 to $299,9992,892 $300,000 to $399,9991,774 $400,000 to $499,9991,885 $500,000 to $749,999114 $750,000 to $999,99921 $1,000,000 to $1,499,9998 $1,500,000 to $1,999,9998 $2,000,000 or moreRent paid by renters in 2022 in Concord, NH 47 Less than $1007 $100 to $14925 $150 to $19950 $200 to $249355 $250 to $299103 $300 to $34964 $350 to $39962 $400 to $44913 $450 to $49975 $500 to $54927 $550 to $599125 $600 to $64973 $650 to $699251 $700 to $749176 $750 to $799385 $800 to $899517 $900 to $9992,027 $1,000 to $1,2491,675 $1,250 to $1,4991,343 $1,500 to $1,999212 $2,000 to $2,49991 $2,500 to $2,99987 $3,500 or more67 No cash rent
Percentage of workers working in this county: 80.3%Number of people working at home: 3,650 (16.6% of all workers )
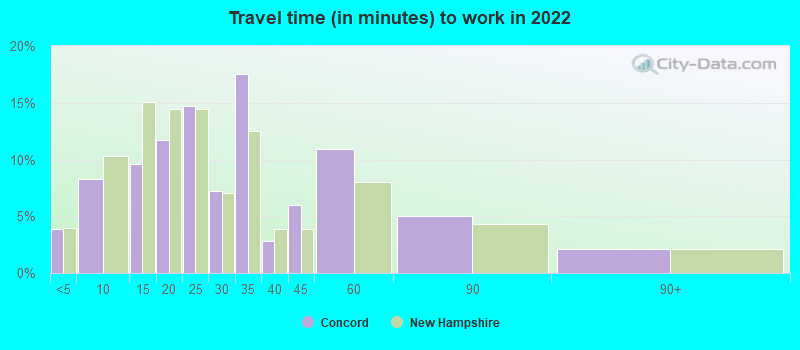
Travel time to work (commute)
Less than 5 minutes: 1,2005 to 9 minutes: 2,83310 to 14 minutes: 2,72015 to 19 minutes: 2,57120 to 24 minutes: 2,45325 to 29 minutes: 80130 to 34 minutes: 2,04235 to 39 minutes: 39640 to 44 minutes: 56245 to 59 minutes: 1,21860 to 89 minutes: 88290 or more minutes: 297
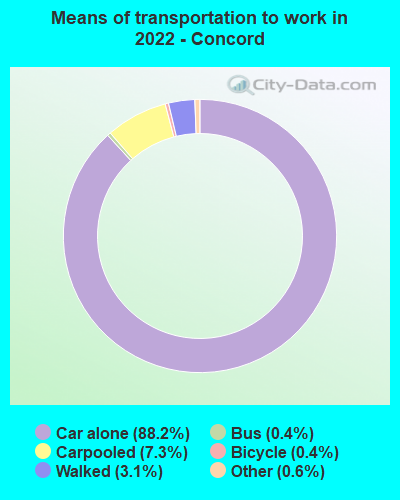
Means of transportation to work:
Drove a car alone: 30,545 (76.7%)Carpooled: 3,007 (7.6%)Bus : 67 (0.2%)Subway or elevated rail : 23 (0.1%)Taxi: 279 (0.7%)Bicycle: 147 (0.4%)Walked: 1,060 (2.7%)Worked at home: 3,650 (9.2%)
Unemployment by race in 2022
Unemployment rate for White non-Hispanic residents 4.8% Males4.7% FemalesUnemployment rate for Asian residents 7.5% FemalesUnemployment rate for two or more race residents 0.4% Males4.1% FemalesUnemployment rate for Hispanic or Latino residents 16.3% Males
Year of entry for the foreign-born population in Concord, New Hampshire
1,564 2010 or later 1,084 2000 to 2009 409 1990 to 1999 353 1980 to 1989 124 1970 to 1979 588 Before 1970
First ancestries reported:
English: 3,068 (16.5%)
Irish: 2,425 (13.0%)
French Canadian: 1,591 (8.5%)
French: 1,504 (8.1%)
American: 1,484 (8.0%)
Italian: 992 (5.3%)
German: 880 (4.7%)
African: 461 (2.5%)
Scottish: 441 (2.4%)
Scotch-Irish: 366 (2.0%)
Polish: 289 (1.6%)
European: 274 (1.5%)
Yugoslavian: 196 (1.1%)
Greek: 182 (1.0%)
Canadian: 143 (0.8%)
Liberian: 126 (0.7%)
Ghanaian: 116 (0.6%)
Russian: 105 (0.6%)
Albanian: 93 (0.5%)
Lithuanian: 87 (0.5%)
Norwegian: 80 (0.4%)
Northern European: 75 (0.4%)
Swedish: 68 (0.4%)
Bulgarian: 66 (0.4%)
Turkish: 63 (0.3%)
Portuguese: 62 (0.3%)
Ethiopian: 61 (0.3%)
Welsh: 60 (0.3%)
British: 58 (0.3%)
Sudanese: 56 (0.3%)
Danish: 55 (0.3%)
Dutch: 51 (0.3%)
Austrian: 44 (0.2%)
Scandinavian: 38 (0.2%)
Ukrainian: 34 (0.2%)
South African: 29 (0.2%)
Croatian: 29 (0.2%)
Armenian: 29 (0.2%)
Eastern European: 28 (0.2%)
Romanian: 22 (0.1%)
Latvian: 20 (0.1%)
Hungarian: 19 (0.1%)
Trinidadian and Tobagonian: 16 (0.09%)
Jamaican: 12 (0.06%)
Finnish: 11 (0.06%)
Lebanese: 10 (0.05%)
Haitian: 8 (0.04%)
Czech: 7 (0.04%)
Syrian: 7 (0.04%)
Belgian: 6 (0.03%)
Cape Verdean: 5 (0.03%)
Kenyan: 5 (0.03%)
West Indian: 2 (0.01%)
Most common places of birth for foreign-born residents (%): Nepal Concord:
7.9% (291)New Hampshire:
2.5% (2,112)
Bhutan Concord:
7.6% (283)New Hampshire:
1.0% (799)
India Concord:
6.3% (233)New Hampshire:
9.1% (7,609)
Congo Concord:
5.9% (220)New Hampshire:
0.3% (238)
Philippines Concord:
5.9% (217)New Hampshire:
3.3% (2,768)
Africa, n.e.c. Concord:
5.6% (206)New Hampshire:
0.8% (674)
China, excluding Hong Kong and Taiwan Concord:
5.4% (200)New Hampshire:
4.5% (3,775)
Canada Concord:
5.0% (186)New Hampshire:
9.1% (7,618)
Bosnia and Herzegovina Concord:
2.9% (108)New Hampshire:
1.3% (1,068)
Peru Concord:
2.8% (103)New Hampshire:
0.8% (686)
Dominican Republic Concord:
2.6% (98)New Hampshire:
7.0% (5,842)
Korea Concord:
2.5% (92)New Hampshire:
2.7% (2,211)
Liberia Concord:
2.3% (87)New Hampshire:
0.6% (467)
Turkey Concord:
2.2% (83)New Hampshire:
0.5% (436)
Albania Concord:
2.0% (74)New Hampshire:
0.6% (491)
Bulgaria Concord:
1.9% (69)New Hampshire:
0.3% (246)
Uruguay Concord:
1.6% (61)New Hampshire:
0.2% (131)
Other Eastern Africa Concord:
1.6% (60)New Hampshire:
0.8% (653)
Ethiopia Concord:
1.6% (59)New Hampshire:
0.5% (385)
Sudan Concord:
1.5% (56)New Hampshire:
0.4% (299)
Place of birth for U.S.-born residents:
This state: 22,834Other state: 18,077Northeast: 13,120Midwest: 1,591South: 2,087West: 1,236 86.2% of Concord residents lived in the same house 1 years ago.
Out of people who lived in different houses, 28.6% lived in this county.
Out of people who lived in different counties, 55.6% lived in New Hampshire.
Concord:
86.2%State average:
89.8%
Education attainment for males 25 years and older:
No schooling: 137Nursery to 4th grade: 1155th and 6th grade: 367th and 8th grade: 1449th grade: 28810th grade: 25711th grade: 19112th grade, no diploma: 240High school graduate (or equivalency): 4,677Less than 1 year of college: 1,185Some college more than 1 year, no degree: 1,548Associate degree: 1,515Bachelor's degree: 4,157Master's degree: 1,991Professional school degree: 737Doctorate degree: 431
Education attainment for females 25 years and older:
No schooling: 101Nursery to 4th grade: 285th and 6th grade: 627th and 8th grade: 1559th grade: 1910th grade: 29011th grade: 12912th grade, no diploma: 142High school graduate (or equivalency): 4,113Less than 1 year of college: 735Some college more than 1 year, no degree: 1,741Associate degree: 1,492Bachelor's degree: 4,498Master's degree: 2,019Professional school degree: 426Doctorate degree: 234
Housing units in structures:
One, detached: 8,049One, attached: 1,191Two: 1,9183 or 4: 1,6265 to 9: 1,37010 to 19: 1,26520 to 49: 1,72850 or more: 991Mobile homes: 927Boats, RVs, vans, etc.: 24Median worth of mobile homes: $62,593
Housing units lacking complete plumbing facilities in 2022: 0.7%Housing units lacking complete kitchen facilities in 2022: 1.0%House/condo owner moved in on average 9 years ago
Renter moved in on average 3 years ago
Private vs. public school enrollment:
Students in private schools in grades 1 to 8 (elementary and middle school): 711 Here:
19.4%New Hampshire:
11.4%
Students in private schools in grades 9 to 12 (high school): 221 Here:
12.6%New Hampshire:
14.0%
Students in private undergraduate colleges: 416 Here:
33.1%New Hampshire:
38.0%