Housing density: 856 houses/condos per square mile
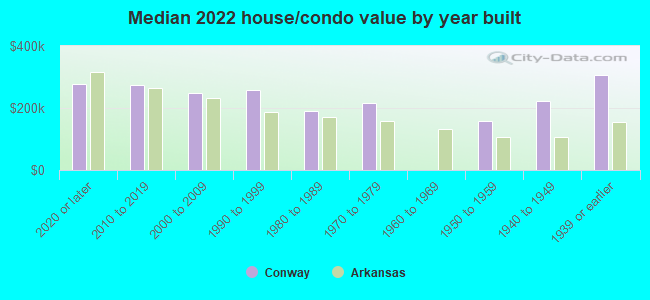
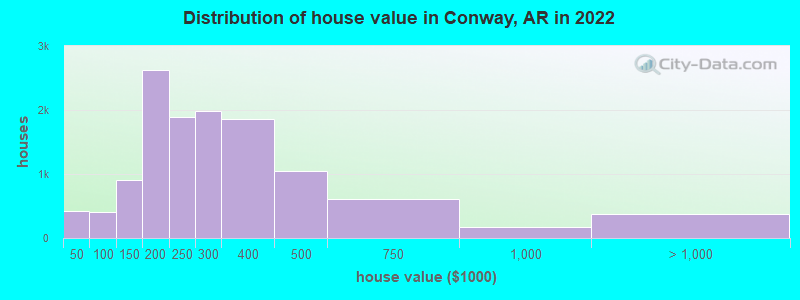
Median price asked for vacant for-sale houses and condos in 2022: $305,524.
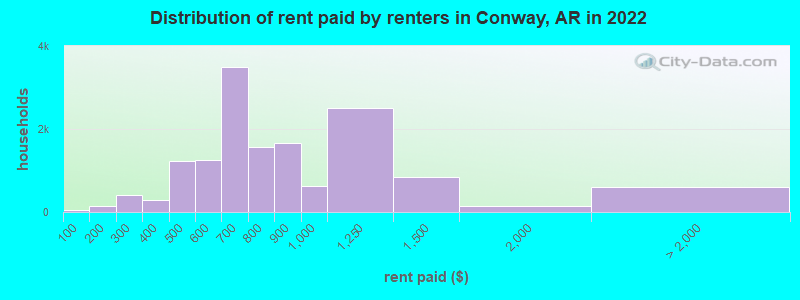
Median contract rent in 2022: $718 (lower quartile is $614, upper quartile is $999)
Median rent asked for vacant for-rent units in 2022: $413
Median gross rent in Conway, AR in 2022: $931
Housing units in Conway with a mortgage: 7,367 (1,071 second mortgage, 0 home equity loan, 746 both second mortgage and home equity loan) Houses without a mortgage: 0
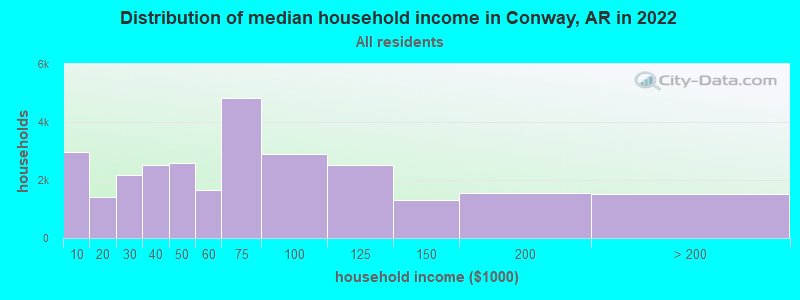
Median household income for houses/condos with a mortgage: $103,012
Median household income for apartments without a mortgage: $73,984
Size of family households: 7,452 2-persons, 4,413 3-persons, 2,732 4-persons, 1,060 5-persons, 158 6-persons, 68 7-or-more-persons.
Size of nonfamily households: 8,066 1-person, 3,033 2-persons, 968 3-persons.
6,146 married couples with children.
5,776 single-parent households (796 men, 4,980 women).
93.6% of residents of Conway speak English at home.
3.6% of residents speak Spanish at home (60% speak English very well, 12% speak English well, 18% speak English not well, 10% don't speak English at all).
1.1% of residents speak other Indo-European language at home (93% speak English very well, 4% speak English well, 3% speak English not well).
1.2% of residents speak Asian or Pacific Island language at home (67% speak English very well, 26% speak English well, 7% speak English not well).
0.2% of residents speak other language at home (94% speak English very well, 6% speak English well).
Foreign born population: 3,239 (4.8%)
(39.9% of them are naturalized citizens)
Percentage of workers working in this county: 76.1% Number of people working at home: 3,129 (9.7% of all workers)
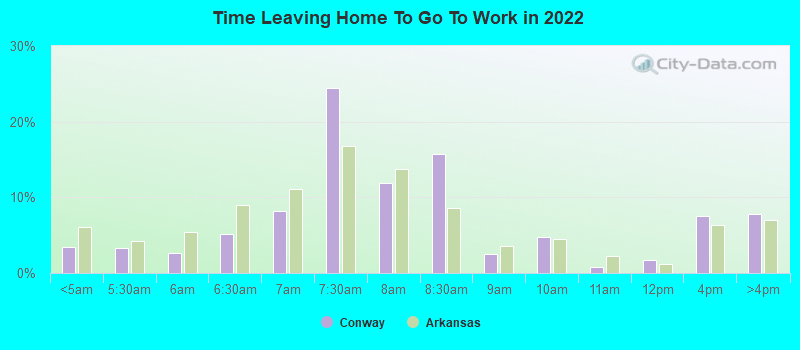
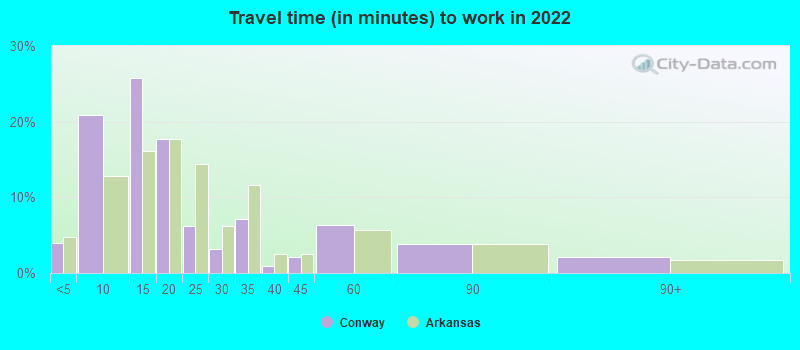
Travel time to work (commute)
Less than 5 minutes: 1,443
5 to 9 minutes: 6,825
10 to 14 minutes: 7,066
15 to 19 minutes: 3,468
20 to 24 minutes: 490
25 to 29 minutes: 935
30 to 34 minutes: 2,120
35 to 39 minutes: 721
40 to 44 minutes: 1,015
45 to 59 minutes: 2,636
60 to 89 minutes: 625
90 or more minutes: 461
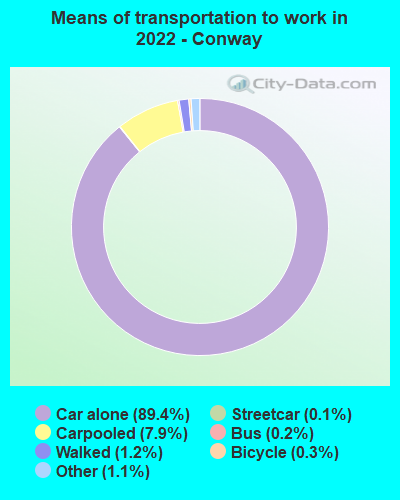
Means of transportation to work:
Drove a car alone: 30,602 (82.7%)
Carpooled: 2,349 (6.3%)
Bus: 60 (0.2%)
Subway or elevated rail: 42 (0.1%)
Taxi: 388 (1.0%)
Bicycle: 69 (0.2%)
Walked: 429 (1.2%)
Worked at home: 3,129 (8.5%)
Unemployment by race in 2022
Unemployment rate for White non-Hispanic residents
3.9%Females
Unemployment rate for Black residents
1.0%Males
4.6%Females
Unemployment rate for Asian residents
4.4%Females
Unemployment rate for two or more race residents
4.4%Males
2.5%Females
Unemployment rate for Hispanic or Latino residents
0.2%Males
5.3%Females
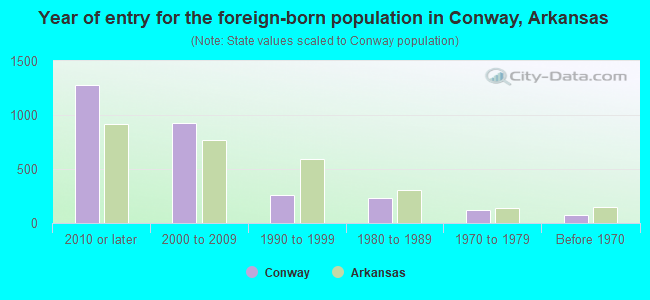
Year of entry for the foreign-born population in Conway, Arkansas
1,2742010 or later
9222000 to 2009
2601990 to 1999
2341980 to 1989
1201970 to 1979
72Before 1970
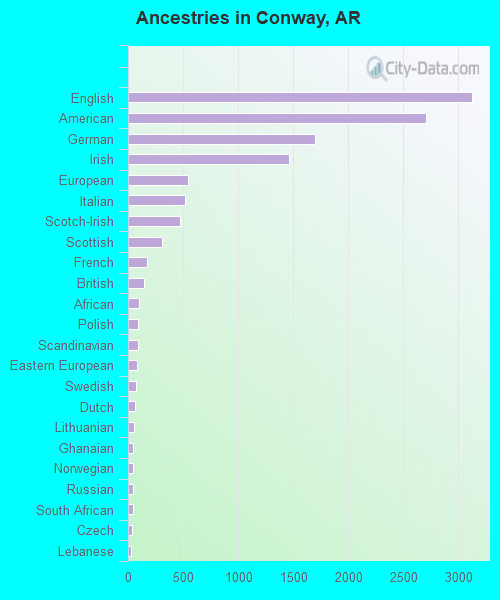
First ancestries reported:
English: 3,124 (8.4%)
American: 2,705 (7.2%)
German: 1,701 (4.5%)
Irish: 1,459 (3.9%)
European: 546 (1.5%)
Italian: 521 (1.4%)
Scotch-Irish: 468 (1.3%)
Scottish: 306 (0.8%)
French: 177 (0.5%)
British: 145 (0.4%)
African: 97 (0.3%)
Polish: 91 (0.2%)
Scandinavian: 88 (0.2%)
Eastern European: 84 (0.2%)
Swedish: 75 (0.2%)
Dutch: 65 (0.2%)
Lithuanian: 52 (0.1%)
Ghanaian: 48 (0.1%)
Norwegian: 45 (0.1%)
Russian: 44 (0.1%)
South African: 41 (0.1%)
Czech: 33 (0.09%)
Lebanese: 30 (0.08%)
Nigerian: 23 (0.06%)
Austrian: 18 (0.05%)
French Canadian: 17 (0.05%)
Serbian: 15 (0.04%)
Welsh: 15 (0.04%)
Greek: 13 (0.03%)
Iranian: 13 (0.03%)
Northern European: 11 (0.03%)
Canadian: 10 (0.03%)
Brazilian: 9 (0.02%)
Portuguese: 8 (0.02%)
Cajun: 7 (0.02%)
Swiss: 3 (0.01%)
Most common places of birth for foreign-born residents (%):
El Salvador
Conway:
23.7% (712)
Arkansas:
10.7% (16,210)
Mexico
Conway:
19.6% (589)
Arkansas:
40.2% (61,075)
India
Conway:
10.1% (305)
Arkansas:
6.1% (9,278)
Korea
Conway:
7.2% (218)
Arkansas:
1.2% (1,813)
England
Conway:
6.2% (188)
Arkansas:
0.9% (1,434)
Philippines
Conway:
4.7% (141)
Arkansas:
2.7% (4,128)
Cambodia
Conway:
2.9% (87)
Arkansas:
0.2% (338)
China, excluding Hong Kong and Taiwan
Conway:
2.7% (81)
Arkansas:
2.3% (3,503)
Vietnam
Conway:
2.3% (69)
Arkansas:
2.7% (4,028)
Ghana
Conway:
2.2% (66)
Arkansas:
0.3% (425)
Russia
Conway:
2.2% (65)
Arkansas:
0.2% (360)
Africa, n.e.c.
Conway:
1.9% (56)
Arkansas:
0.2% (269)
Place of birth for U.S.-born residents:
This state: 43,528
Other state: 20,780
Northeast: 629
Midwest: 6,049
South: 10,582
West: 3,520
85.9% of Conway residents lived in the same house 1 years ago. Out of people who lived in different houses, 26.6% lived in this county. Out of people who lived in different counties, 67.3% lived in Arkansas.
Conway:
85.9%
State average:
87.0%
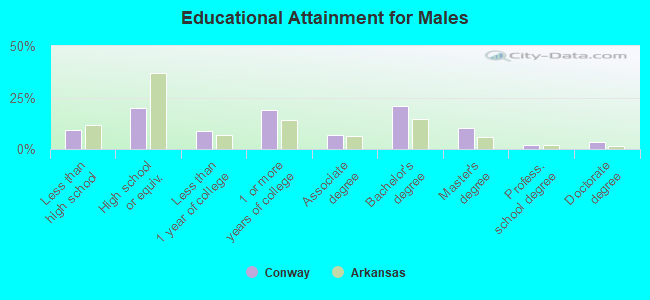
Education attainment for males 25 years and older:
No schooling: 432
Nursery to 4th grade: 0
5th and 6th grade: 64
7th and 8th grade: 725
9th grade: 135
10th grade: 116
11th grade: 370
12th grade, no diploma: 12
High school graduate (or equivalency): 3,919
Less than 1 year of college: 1,724
Some college more than 1 year, no degree: 3,693
Associate degree: 1,300
Bachelor's degree: 4,130
Master's degree: 1,998
Professional school degree: 400
Doctorate degree: 671
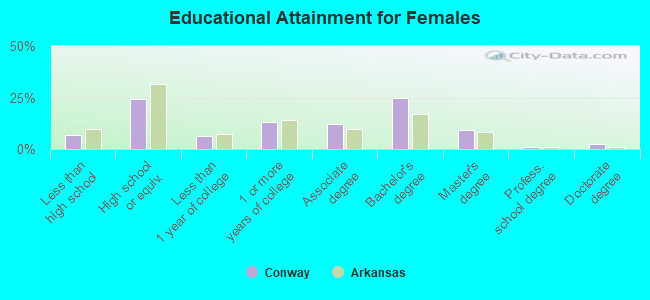
Education attainment for females 25 years and older:
No schooling: 400
Nursery to 4th grade: 0
5th and 6th grade: 103
7th and 8th grade: 458
9th grade: 243
10th grade: 0
11th grade: 36
12th grade, no diploma: 190
High school graduate (or equivalency): 5,298
Less than 1 year of college: 1,343
Some college more than 1 year, no degree: 2,875
Associate degree: 2,644
Bachelor's degree: 5,408
Master's degree: 1,960
Professional school degree: 243
Doctorate degree: 537
Housing units in structures:
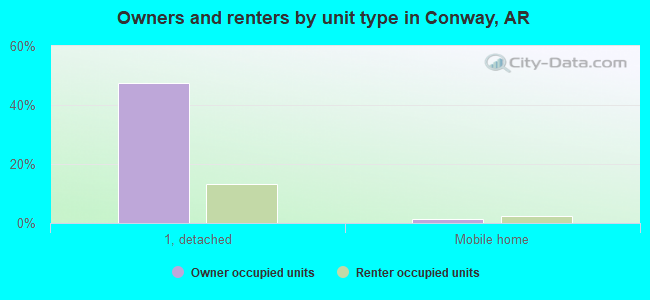
One, detached: 17,008
One, attached: 334
Two: 2,102
3 or 4: 1,057
5 to 9: 1,242
10 to 19: 4,522
20 to 49: 1,096
50 or more: 945
Mobile homes: 1,679
Median worth of mobile homes: $18,500
Housing units lacking complete plumbing facilities in 2022: 2.0%
Housing units lacking complete kitchen facilities in 2022: 2.0%
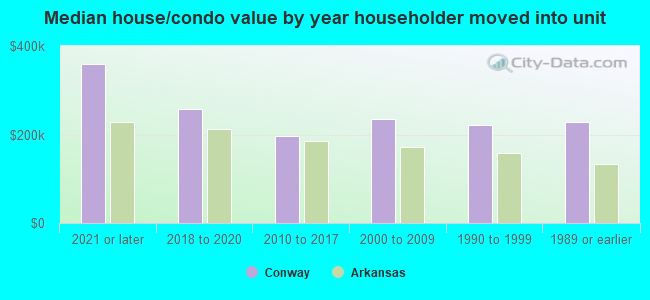
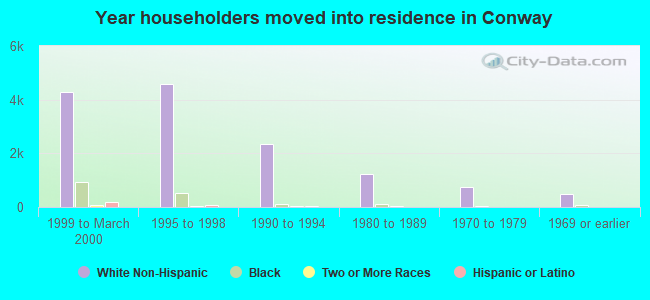
House/condo owner moved in on average 10 years ago