Conway, MA (Massachusetts) Houses and Residents
| Conway: | $426,207 |
| Massachusetts: | $534,700 |
Total population: 1,897 (Urban population: 0, Rural population: 1,809 (65 farm, 1,744 nonfarm))
Houses: 749 (692 occupied: 588 owner occupied, 104 renter occupied)
| % of renters here: | 15% |
| State: | 38% |
Housing density: 20 houses/condos per square mile
Median price asked for vacant for-sale houses and condos in 2022 in this county: $191,319.
Median contract rent in 2022: $1,051 (lower quartile is $637, upper quartile is $1,413)
Median rent asked for vacant for-rent units in 2022: $1,560
Median gross rent in Conway, MA in 2022: $1,239
Housing units in Conway with a mortgage: 291 (26 second mortgage, 52 home equity loan, 0 both second mortgage and home equity loan)
Houses without a mortgage: 80
Compare current foreclosures near Conway, MA:
| Photo | Address | Area | Beds / Baths | Price | Details |
|---|---|---|---|---|---|

|
#1
Sabans Rd
Conway, MA 01341
|
1,246 sq. feet
|
2 baths 3 beds |
show details | |

|
#2
Lampblack Rd
Greenfield, MA 01301
|
2,078 sq. feet
|
1 baths 3 beds |
$369,900
|
show details |

|
#3
J St
Turners Falls, MA 01376
|
3,256 sq. feet
|
2 baths 7 beds |
show details | |

|
#4
West St
Greenfield, MA 01301
|
1,858 sq. feet
|
2 baths 3 beds |
show details | |

|
#5
Brierwood Dr
Florence, MA 01062
|
960 sq. feet
|
1 baths 3 beds |
show details | |

|
#6
North St
Hatfield, MA 01038
|
1,900 sq. feet
|
1 baths 3 beds |
show details | |

|
#7
N Main St
South Deerfield, MA 01373
|
2,143 sq. feet
|
1 baths 5 beds |
show details | |

|
#8
Bridge St # 1
Hatfield, MA 01038
|
3,300 sq. feet
|
3 baths 4 beds |
show details | |

|
#9
Pine St
Amherst, MA 01002
|
2,195 sq. feet
|
2 baths 4 beds |
show details | |

|
#10
Sand Hill Rd
Amherst, MA 01002
|
2,037 sq. feet
|
3 baths 5 beds |
show details |
| Photo | Address | Area | Beds / Baths | Price | Details |
|---|---|---|---|---|---|

|
#11
Log Plain Rd
Greenfield, MA 01301
|
960 sq. feet
|
1 baths 3 beds |
show details | |

|
#12
Pratt St
Erving, MA 01344
|
3,000 sq. feet
|
4 baths 7 beds |
show details | |

|
#13
Jacksonville Rd
Colrain, MA 01340
|
1,108 sq. feet
|
1 baths 2 beds |
show details | |

|
#14
Chesterfield Rd
Easthampton, MA 01027
|
3,977 sq. feet
|
2 baths 6 beds |
show details | |

|
#15
Tea St
Charlemont, MA 01339
|
2,829 sq. feet
|
2 baths 6 beds |
show details | |

|
#16
Hillcrest Dr
Bernardston, MA 01337
|
1,120 sq. feet
|
1 baths 3 beds |
show details | |

|
#17
Kosior Dr
Hadley, MA 01035
|
1,040 sq. feet
|
1 baths 2 beds |
show details | |

|
#18
Myrtle St # 1
Northampton, MA 01060
|
2,222 sq. feet
|
2 baths 4 beds |
show details | |

|
#19
Central St
Turners Falls, MA 01376
|
1,506 sq. feet
|
1 baths 3 beds |
show details | |

|
#20
Cahillane Ter
Florence, MA 01062
|
1,388 sq. feet
|
1 baths 3 beds |
show details |
| Photo | Address | Area | Beds / Baths | Price | Details |
|---|---|---|---|---|---|

|
#21
Cahillane Ter
Florence, MA 01062
|
1,388 sq. feet
|
1 baths 3 beds |
show details | |

|
#22
Legate Hill Rd
Charlemont, MA 01339
|
2,016 sq. feet
|
2 baths 3 beds |
show details | |

|
#23
Old North Rd
Worthington, MA 01098
|
2,369 sq. feet
|
3 baths 4 beds |
show details | |

|
#24
Bald Mountain Rd
Bernardston, MA 01337
|
918 sq. feet
|
1 baths 2 beds |
show details | |

|
#25
Boyle Rd
Northfield, MA 01354
|
1,500 sq. feet
|
2 baths 3 beds |
show details | |

|
#26
Shays St # 1
Amherst, MA 01002
|
925 sq. feet
|
2 baths 3 beds |
show details | |

|
#27
Loop Rd
Savoy, MA 01256
|
1,040 sq. feet
|
1 baths 3 beds |
show details | |

|
#28
Briggs Rd
Shutesbury, MA 01072
|
1,434 sq. feet
|
1 baths 3 beds |
show details | |

|
#29
Wildflower Dr
Amherst, MA 01002
|
2,330 sq. feet
|
2 baths 4 beds |
show details | |

|
#30
S East St
Amherst, MA 01002
|
1,644 sq. feet
|
2 baths 3 beds |
show details |
| Photo | Address | Area | Beds / Baths | Price | Details |
|---|---|---|---|---|---|

|
#31
Glendale Rd
Southampton, MA 01073
|
1,303 sq. feet
|
1 baths 4 beds |
show details | |

|
#32
David Dr
Hinsdale, MA 01235
|
1,664 sq. feet
|
2 baths 3 beds |
show details | |

|
#33
Grove St
Turners Falls, MA 01376
|
2,273 sq. feet
|
1 baths 4 beds |
show details | |

|
#34
Rte 9
Windsor, MA 01270
|
1,223 sq. feet
|
1 baths 2 beds |
show details | |

|
#35
Maple St
Greenfield, MA 01301
|
1,216 sq. feet
|
1 baths 3 beds |
show details | |

|
#36
Dell St
Turners Falls, MA 01376
|
720 sq. feet
|
1 baths 1 beds |
show details | |

|
#37
Hope St
Greenfield, MA 01301
|
1,619 sq. feet
|
1 baths 3 beds |
show details | |

|
#38
Deerfield St
Greenfield, MA 01301
|
1,496 sq. feet
|
2 baths 3 beds |
show details | |

|
#39
Chapman St
Greenfield, MA 01301
|
1,472 sq. feet
|
1 baths 2 beds |
show details | |

|
#40
Shelburne Rd
Greenfield, MA 01301
|
1,382 sq. feet
|
1 baths 2 beds |
show details |
| Photo | Address | Area | Beds / Baths | Price | Details |
|---|---|---|---|---|---|

|
#41
Meridian St
Greenfield, MA 01301
|
768 sq. feet
|
1 baths 2 beds |
show details | |

|
#42
James St
Greenfield, MA 01301
|
2,176 sq. feet
|
2 baths 4 beds |
show details | |

|
#43
5th St
Turners Falls, MA 01376
|
1,683 sq. feet
|
2 baths 4 beds |
show details | |

|
#44
Garfield St
Greenfield, MA 01301
|
2,260 sq. feet
|
2 baths 4 beds |
show details | |

|
#45
Hawley Rd
Ashfield, MA 01330
|
1,008 sq. feet
|
1 baths 3 beds |
show details | |

|
#46
Sunderland Rd
South Deerfield, MA 01373
|
1,385 sq. feet
|
1 baths 3 beds |
show details | |

|
#47
Plumtree Rd
Sunderland, MA 01375
|
1,536 sq. feet
|
2 baths 2 beds |
show details | |

|
#48
Chestnut St
West Hatfield, MA 01088
|
1,248 sq. feet
|
1 baths 3 beds |
show details | |

|
#49
French King Hwy
Greenfield, MA 01301
|
1,040 sq. feet
|
1 baths 5 beds |
show details | |

|
Check over 1 million property listings on Foreclosure.com!
|
browse all offers | |||
Latest news about housing in Conway, MA collected exclusively by city-data.com from local newspapers, TV, and radio stations

 | How Much Massachusetts Households Make Per Year: Census Data (37 replies) |
| 2023 Real Estate Observations (5278 replies) |
| 2021 Real Estate Observations (1729 replies) |
| Is it possible to escape hunters, ATVs and noise in a rural area? (278 replies) |
| Moving to Massachusetts (75 replies) |
| Coronavirus in Massachusetts (18048 replies) |

Household type by relationship:
Households: 69,891- In family households: 54,236 (12,210 male householders, 6,107 female householders)
13,655 spouses, 17,750 children (16,448 natural, 543 adopted, 759 stepchildren), 917 grandchildren, 418 brothers or sisters, 464 parents, foster children, 409 other relatives, 1,987 non-relatives
- In nonfamily households: 15,655 (5,446 male householders (3,978 living alone)), 6,699 female householders (5,318 living alone)), 3,510 nonrelatives
- In group quarters: 1,481 (665 institutionalized population)
11,122 married couples with children.
4,422 single-parent households (1,025 men, 3,397 women).
98.1% of residents of Conway speak English at home.
0.5% of residents speak Spanish at home (100% speak English very well).
1.0% of residents speak other Indo-European language at home (89% speak English very well, 11% speak English well).
0.3% of residents speak Asian or Pacific Island language at home (100% speak English very well).
Foreign born population: 62 (3.5%)
(48.4% of them are naturalized citizens)
| Here: | 6.4 |
| State: | 6.5 |
| Here: | 4.0 |
| State: | 4.0 |

- Bedrooms in owner-occupied houses and condos in Conway, Massachusetts
- 2no bedroom
- 141 bedroom
- 1012 bedrooms
- 2793 bedrooms
- 1364 bedrooms
- 565+ bedrooms

- Bedrooms in renter-occupied apartments in Conway, Massachusetts
- 13no bedroom
- 221 bedroom
- 322 bedrooms
- 203 bedrooms
- 74 bedrooms
- 105+ bedrooms

- Cars and other vehicles available in Conway in owner-occupied houses/condos
- 1no vehicle
- 1101 vehicle
- 3422 vehicles
- 1003 vehicles
- 264 vehicles
- 95+ vehicles

- Cars and other vehicles available in Conway in renter-occupied apartments
- 6no vehicle
- 721 vehicle
- 232 vehicles
- 33 vehicles
- 04 vehicles
- 05+ vehicles

- Rooms in owner-occupied houses in Conway, Massachusetts
- 21 room
- 62 rooms
- 83 rooms
- 314 rooms
- 875 rooms
- 1126 rooms
- 1247 rooms
- 1098 rooms
- 1099+ rooms

- Rooms in renter-occupied apartments in Conway, Massachusetts
- 131 room
- 22 rooms
- 173 rooms
- 154 rooms
- 195 rooms
- 186 rooms
- 27 rooms
- 88 rooms
- 109+ rooms


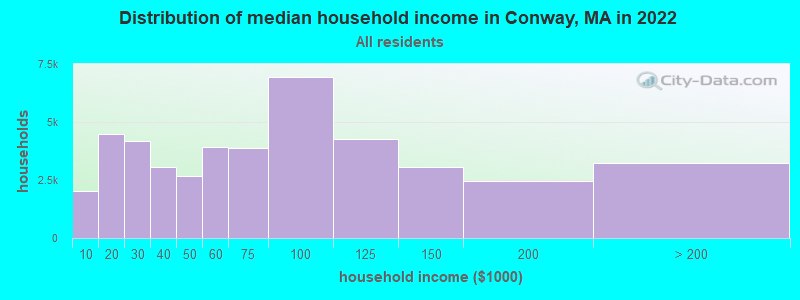
Conway, MA household income distribution

- 2,045Less than $10,000
- 4,483$10,000 to $19,999
- 4,197$20,000 to $29,999
- 3,063$30,000 to $39,999
- 2,682$40,000 to $49,999
- 3,919$50,000 to $59,999
- 3,886$60,000 to $74,999
- 6,920$75,000 to $99,999
- 4,264$100,000 to $124,999
- 3,077$125,000 to $149,999
- 2,473$150,000 to $199,999
- 3,220$200,000 or more
Percentage of workers working in this county: 63.0%
Number of people working at home: 219 (18.3% of all workers)
Travel time to work (commute)
- Less than 5 minutes: 28
- 5 to 9 minutes: 22
- 10 to 14 minutes: 90
- 15 to 19 minutes: 116
- 20 to 24 minutes: 162
- 25 to 29 minutes: 103
- 30 to 34 minutes: 199
- 35 to 39 minutes: 51
- 40 to 44 minutes: 38
- 45 to 59 minutes: 68
- 60 to 89 minutes: 57
- 90 or more minutes: 8
Means of transportation to work:
- Drove a car alone: 825 (78.1%)
- Carpooled: 82 (7.8%)
- Bus or trolley bus: 7 (0.7%)
- Subway or elevated: 4 (0.4%)
- Railroad: 2 (0.2%)
- Motorcycle: 2 (0.2%)
- Bicycle: 2 (0.2%)
- Walked: 14 (1.3%)
- Other means: 4 (0.4%)
- Worked at home: 115 (10.9%)


- Year of entry for the foreign-born population in Conway, Massachusetts
- 51995 to March 2000
- 101990 to 1994
- 111985 to 1989
- 31980 to 1984
- 31975 to 1979
- 21970 to 1974
- 21965 to 1969
- 4Before 1965

First ancestries reported:
- English: 434 (18.8%)
- Irish: 357 (15.4%)
- German: 225 (9.7%)
- Polish: 215 (9.3%)
- Other: 169 (7.3%)
- French: 159 (6.9%)
- French Canadian: 149 (6.4%)
- Italian: 134 (5.8%)
- Scottish: 113 (4.9%)
- United States: 75 (3.2%)
- Russian: 51 (2.2%)
- Scotch-Irish: 47 (2.0%)
- Swedish: 39 (1.7%)
- Welsh: 20 (0.9%)
- Dutch: 18 (0.8%)
- Danish: 17 (0.7%)
- Norwegian: 13 (0.6%)
- Portuguese: 13 (0.6%)
- Ukrainian: 13 (0.6%)
- Slovak: 10 (0.4%)
- Czech: 9 (0.4%)
- Hungarian: 9 (0.4%)
- Lithuanian: 9 (0.4%)
- Arab: 6 (0.3%)
- Greek: 4 (0.2%)
- Subsaharan African: 2 (0.09%)
- Swiss: 2 (0.09%)
- West Indian: 2 (0.09%)
Most common places of birth for foreign-born residents (%):
| Conway: | 27.5% (11) |
| Massachusetts: | 3.3% (25,403) |
| Conway: | 15.0% (6) |
| Massachusetts: | 1.9% (14,883) |
| Conway: | 10.0% (4) |
| Massachusetts: | 0.2% (1,855) |
| Conway: | 10.0% (4) |
| Massachusetts: | 5.2% (40,247) |
| Conway: | 7.5% (3) |
| Massachusetts: | 1.0% (7,414) |
| Conway: | 5.0% (2) |
| Massachusetts: | 0.8% (5,895) |
| Conway: | 5.0% (2) |
| Massachusetts: | 1.1% (8,682) |
| Conway: | 5.0% (2) |
| Massachusetts: | 3.6% (28,086) |
| Conway: | 5.0% (2) |
| Massachusetts: | 2.0% (15,286) |
| Conway: | 5.0% (2) |
| Massachusetts: | 0.2% (1,729) |
Place of birth for U.S.-born residents:
- This state: 1,105
- Other state: 651
- Northeast: 477
- Midwest: 74
- South: 61
- West: 39
72% of Conway residents lived in the same house 5 years ago.
Out of people who lived in different houses, 47% lived in this county.
Out of people who lived in different counties, 54% lived in Massachusetts.
Education attainment for males 25 years and older:
- No schooling: 0
- Nursery to 4th grade: 0
- 5th and 6th grade: 2
- 7th and 8th grade: 10
- 9th grade: 7
- 10th grade: 7
- 11th grade: 6
- 12th grade, no diploma: 12
- High school graduate (or equivalency): 147
- Less than 1 year of college: 28
- Some college more than 1 year, no degree: 86
- Associate degree: 37
- Bachelor's degree: 140
- Master's degree: 78
- Professional school degree: 26
- Doctorate degree: 28

Education attainment for females 25 years and older:
- No schooling: 2
- Nursery to 4th grade: 0
- 5th and 6th grade: 0
- 7th and 8th grade: 4
- 9th grade: 3
- 10th grade: 10
- 11th grade: 4
- 12th grade, no diploma: 6
- High school graduate (or equivalency): 112
- Less than 1 year of college: 31
- Some college more than 1 year, no degree: 85
- Associate degree: 71
- Bachelor's degree: 162
- Master's degree: 121
- Professional school degree: 24
- Doctorate degree: 12


Housing units in structures:
- One, detached: 644
- One, attached: 7
- Two: 73
- 3 or 4: 7
- Mobile homes: 18
Median worth of mobile homes: $186,310
Housing units lacking complete kitchen facilities: 1.9%

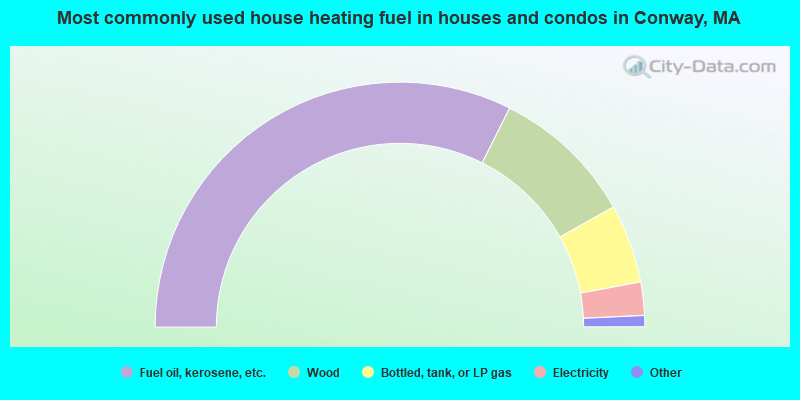
- 64.8%Fuel oil, kerosene, etc.
- 18.9%Wood
- 10.4%Bottled, tank, or LP gas
- 4.4%Electricity
- 1.0%Utility gas
- 0.5%Other fuel
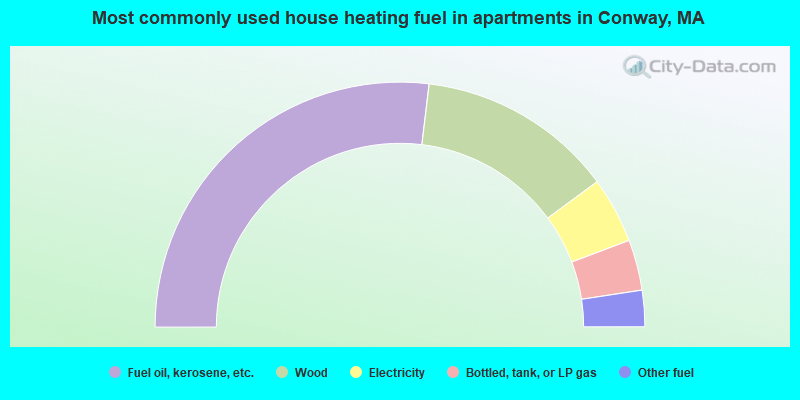
- 53.8%Fuel oil, kerosene, etc.
- 26.0%Wood
- 8.7%Electricity
- 6.7%Bottled, tank, or LP gas
- 4.8%Other fuel
Private vs. public school enrollment:
| Here: | 12.6% |
| Massachusetts: | 10.8% |
| Here: | 11.1% |
| Massachusetts: | 12.2% |
| Here: | 4.0% |
| Massachusetts: | 48.2% |


