Conway, PA (Pennsylvania) Houses and Residents
| Conway: | $182,989 |
| Pennsylvania: | $245,500 |
Mean price in 2022:
Detached houses: $186,078
Here: $186,078 State: $317,202
Total population: 2,155 (All urban)
Houses: 1,124 (1,058 occupied: 707 owner occupied, 350 renter occupied)
| % of renters here: | 33% |
| State: | 31% |
Housing density: 896 houses/condos per square mile
Median price asked for vacant for-sale houses and condos in 2022 in this county: $96,965.
Median contract rent in 2022: $559 (lower quartile is $399, upper quartile is $758)
Median rent asked for vacant for-rent units in 2022: $429
Median gross rent in Conway, PA in 2022: $745
Housing units in Conway with a mortgage: 389 (29 second mortgage, 0 home equity loan, 30 both second mortgage and home equity loan)
Houses without a mortgage: 8
Median household income for houses/condos with a mortgage: $89,580
Median household income for apartments without a mortgage: $64,479
Median monthly housing costs: $732
Compare current foreclosures near Conway, PA:
| Photo | Address | Area | Beds / Baths | Price | Details |
|---|---|---|---|---|---|

|
#1
4th Ave
Conway, PA 15027
|
748 sq. feet
|
1 baths 3 beds |
show details | |

|
#2
Foote St
Conway, PA 15027
|
972 sq. feet
|
1 baths 3 beds |
show details | |

|
#3
11th St
Conway, PA 15027
|
4,560 sq. feet
|
- baths - beds |
show details | |

|
#4
Perrysville Ave
Pittsburgh, PA 15202
|
2,306 sq. feet
|
1 baths 4 beds |
$457,000
|
show details |

|
#5
Darlington Rd
Wampum, PA 16157
|
1,212 sq. feet
|
2 baths 3 beds |
$194,500
|
show details |

|
#6
Munson Ave
Mc Kees Rocks, PA 15136
|
1,600 sq. feet
|
1 baths 3 beds |
$159,500
|
show details |

|
#7
Shady Ln
Aliquippa, PA 15001
|
1,440 sq. feet
|
2 baths 3 beds |
$159,900
|
show details |

|
#8
Fairmont Drive
Wexford, PA 15090
|
3,076 sq. feet
|
4 baths 3 beds |
show details | |

|
#9
California Ave
Pittsburgh, PA 15202
|
1,976 sq. feet
|
4 baths 4 beds |
show details | |

|
#10
Haugh Dr
Pittsburgh, PA 15237
|
2,165 sq. feet
|
3 baths 4 beds |
show details |
| Photo | Address | Area | Beds / Baths | Price | Details |
|---|---|---|---|---|---|

|
#11
Mcgovern Blvd
Crescent, PA 15046
|
1,632 sq. feet
|
1 baths 3 beds |
show details | |

|
#12
Washington St
Leetsdale, PA 15056
|
1,164 sq. feet
|
1 baths 3 beds |
show details | |

|
#13
Church Ave
Mc Kees Rocks, PA 15136
|
1,576 sq. feet
|
2 baths 3 beds |
show details | |

|
#14
Christy Dr
Aliquippa, PA 15001
|
7,524 sq. feet
|
3 baths 7 beds |
show details | |

|
#15
Main Ave
New Brighton, PA 15066
|
1,796 sq. feet
|
1 baths 2 beds |
show details | |

|
#16
Broad St
Leetsdale, PA 15056
|
1,158 sq. feet
|
1 baths 3 beds |
show details | |

|
#17
Main Ave
New Brighton, PA 15066
|
854 sq. feet
|
1 baths 2 beds |
show details | |

|
#18
Sangree Rd
Pittsburgh, PA 15237
|
1,520 sq. feet
|
2 baths 3 beds |
show details | |

|
#19
Hetherton Dr
Pittsburgh, PA 15237
|
1,494 sq. feet
|
3 baths 3 beds |
show details | |

|
#20
Old State Rd
Gibsonia, PA 15044
|
1,120 sq. feet
|
1 baths 3 beds |
show details |
| Photo | Address | Area | Beds / Baths | Price | Details |
|---|---|---|---|---|---|

|
#21
Harmony Rd
New Brighton, PA 15066
|
1,178 sq. feet
|
2 baths 2 beds |
show details | |

|
#22
1st St
Mc Kees Rocks, PA 15136
|
875 sq. feet
|
2 baths 3 beds |
show details | |

|
#23
Macfadden Dr
Gibsonia, PA 15044
|
5,055 sq. feet
|
6 baths 4 beds |
show details | |

|
#24
Victory Ln
Leetsdale, PA 15056
|
900 sq. feet
|
1 baths 2 beds |
show details | |

|
#25
Wittmer Rd
Pittsburgh, PA 15237
|
792 sq. feet
|
2 baths 3 beds |
show details | |

|
#26
Starr Rd
Crescent, PA 15046
|
1,503 sq. feet
|
3 baths 4 beds |
show details | |

|
#27
Woodward Ave
Mc Kees Rocks, PA 15136
|
867 sq. feet
|
1 baths 3 beds |
show details | |

|
#28
Camberly Dr
Gibsonia, PA 15044
|
1,200 sq. feet
|
2 baths 2 beds |
show details | |

|
#29
Church Ave
Mc Kees Rocks, PA 15136
|
1,070 sq. feet
|
1 baths 2 beds |
show details | |

|
#30
Amelia St
Mc Kees Rocks, PA 15136
|
1,828 sq. feet
|
2 baths 3 beds |
show details |
| Photo | Address | Area | Beds / Baths | Price | Details |
|---|---|---|---|---|---|

|
#31
Thompson Run Rd
Pittsburgh, PA 15237
|
1,134 sq. feet
|
1 baths 3 beds |
show details | |

|
#32
Lori Rd
Gibsonia, PA 15044
|
2,808 sq. feet
|
3 baths 4 beds |
show details | |

|
#33
Coraopolis Rd
Coraopolis, PA 15108
|
1,149 sq. feet
|
2 baths 3 beds |
show details | |

|
#34
32nd Ave
New Brighton, PA 15066
|
1,608 sq. feet
|
1 baths 3 beds |
show details | |

|
#35
Bell Ave
Mc Kees Rocks, PA 15136
|
1,296 sq. feet
|
1 baths 2 beds |
show details | |

|
#36
Antrim St
Pittsburgh, PA 15212
|
1,580 sq. feet
|
1 baths 2 beds |
show details | |

|
#37
Peony Ave
Pittsburgh, PA 15229
|
1,392 sq. feet
|
2 baths 3 beds |
show details | |

|
#38
13th St
Mc Kees Rocks, PA 15136
|
1,404 sq. feet
|
1 baths 3 beds |
show details | |

|
#39
Chartiers Ave
Pittsburgh, PA 15204
|
1,531 sq. feet
|
1 baths 4 beds |
show details | |

|
#40
E Elfinwild Rd
Allison Park, PA 15101
|
2,024 sq. feet
|
3 baths 3 beds |
show details |
| Photo | Address | Area | Beds / Baths | Price | Details |
|---|---|---|---|---|---|

|
#41
Longmount Dr
Pittsburgh, PA 15214
|
1,794 sq. feet
|
2 baths 3 beds |
show details | |

|
#42
Leona Ln
Coraopolis, PA 15108
|
896 sq. feet
|
2 baths 2 beds |
show details | |

|
#43
Spring Ln
Beaver, PA 15009
|
984 sq. feet
|
1 baths 3 beds |
show details | |

|
#44
Ambridge Ave
Ambridge, PA 15003
|
1,320 sq. feet
|
1 baths 3 beds |
show details | |

|
#45
Beaver Grade Rd
Coraopolis, PA 15108
|
2,160 sq. feet
|
2 baths 2 beds |
show details | |

|
#46
Anderson Rd
Pittsburgh, PA 15209
|
1,102 sq. feet
|
2 baths 3 beds |
show details | |

|
#47
Cameron Square Dr
Evans City, PA 16033
|
- sq. feet
|
2 baths 4 beds |
show details | |

|
#48
Gibson St
Pittsburgh, PA 15202
|
2,176 sq. feet
|
1 baths 3 beds |
show details | |

|
#49
Woodward Ave
Mc Kees Rocks, PA 15136
|
1,958 sq. feet
|
2 baths 4 beds |
show details | |

|
Check over 1 million property listings on Foreclosure.com!
|
browse all offers | |||

Latest news about housing in Conway, PA collected exclusively by city-data.com from local newspapers, TV, and radio stations

 | Exurb of the Week: Conway (0 replies) |
| Public service announcement: Protest downtown tomorrow at 2:30pm (Sat 30th) (303 replies) |
| Exurb of the Week: Baden (31 replies) |
| How much are South Jersey suburbs part of Philly culture? (80 replies) |
| Exurb of the Week: New Sewickley Township (0 replies) |
| Exurb of the Week: Freedom (0 replies) |

Median year apartment built: 1965
Household type by relationship:
Households: 2,080- Male householders: 494 (182 living alone), Female householders: 549 (326 living alone)
393 spouses (390 opposite-sex spouses), 33 unmarried partners, (29 opposite-sex unmarried partners), 552 children (498 natural, 5 adopted, 48 stepchildren), 7 grandchildren, 7 brothers or sisters, 4 parents, 0 foster children, 5 other relatives, 24 non-relatives
- In group quarters: 5
Size of family households: 261 2-persons, 120 3-persons, 76 4-persons, 37 5-persons, 12 6-persons, 12 7-or-more-persons.
Size of nonfamily households: 504 1-person, 4 2-persons, 21 3-persons.
273 married couples with children.
94 single-parent households (21 men, 73 women).
99.0% of residents of Conway speak English at home.
0.3% of residents speak Spanish at home (100% speak English well).
0.4% of residents speak other Indo-European language at home (44% speak English very well, 56% speak English well).
Foreign born population: 31 (1.5%)
(32.3% of them are naturalized citizens)
| Here: | 6.5 |
| State: | 6.8 |
| Here: | 3.9 |
| State: | 4.3 |

- Bedrooms in owner-occupied houses and condos in Conway, Pennsylvania
- 0no bedroom
- 191 bedroom
- 1542 bedrooms
- 4403 bedrooms
- 894 bedrooms
- 55+ bedrooms

- Bedrooms in renter-occupied apartments in Conway, Pennsylvania
- 4no bedroom
- 1931 bedroom
- 812 bedrooms
- 453 bedrooms
- 124 bedrooms
- 155+ bedrooms

- Cars and other vehicles available in Conway in owner-occupied houses/condos
- 11no vehicle
- 2271 vehicle
- 3382 vehicles
- 693 vehicles
- 414 vehicles
- 215+ vehicles

- Cars and other vehicles available in Conway in renter-occupied apartments
- 71no vehicle
- 2281 vehicle
- 302 vehicles
- 213 vehicles
- 04 vehicles
- 05+ vehicles

- Rooms in owner-occupied houses in Conway, Pennsylvania
- 01 room
- 02 rooms
- 03 rooms
- 494 rooms
- 1355 rooms
- 1496 rooms
- 2407 rooms
- 488 rooms
- 859+ rooms

- Rooms in renter-occupied apartments in Conway, Pennsylvania
- 41 room
- 172 rooms
- 1373 rooms
- 854 rooms
- 365 rooms
- 406 rooms
- 07 rooms
- 48 rooms
- 279+ rooms


Conway, PA household income distribution

- 71Less than $10,000
- 88$10,000 to $19,999
- 94$20,000 to $29,999
- 60$30,000 to $39,999
- 86$40,000 to $49,999
- 81$50,000 to $59,999
- 100$60,000 to $74,999
- 223$75,000 to $99,999
- 85$100,000 to $124,999
- 71$125,000 to $149,999
- 64$150,000 to $199,999
- 30$200,000 or more
Home value of owner - occupied houses in 2022 in Conway, PA
-
- 9$10,000 to $14,999
- 6$15,000 to $19,999
- 3$20,000 to $24,999
- 2$30,000 to $34,999
- 4$40,000 to $49,999
- 17$60,000 to $69,999
- 10$70,000 to $79,999
- 25$80,000 to $89,999
- 23$90,000 to $99,999
- 89$100,000 to $124,999
- 64$125,000 to $149,999
- 65$150,000 to $174,999
- 186$175,000 to $199,999
- 135$200,000 to $249,999
- 7$250,000 to $299,999
- 7$300,000 to $399,999
- 15$400,000 to $499,999
- 13$500,000 to $749,999
Rent paid by renters in 2022 in Conway, PA
-
- 19$150 to $199
- 4$200 to $249
- 25$300 to $349
- 9$350 to $399
- 50$400 to $449
- 22$450 to $499
- 29$500 to $549
- 10$550 to $599
- 57$600 to $649
- 13$650 to $699
- 16$700 to $749
- 7$750 to $799
- 24$800 to $899
- 4$900 to $999
- 12$1,000 to $1,249
- 6$3,500 or more
- 21No cash rent


Percentage of workers working in this county: 54.1%
Number of people working at home: 96 (9.9% of all workers)
Travel time to work (commute)
- Less than 5 minutes: 14
- 5 to 9 minutes: 39
- 10 to 14 minutes: 114
- 15 to 19 minutes: 234
- 20 to 24 minutes: 121
- 25 to 29 minutes: 79
- 30 to 34 minutes: 63
- 35 to 39 minutes: 62
- 40 to 44 minutes: 27
- 45 to 59 minutes: 70
- 60 to 89 minutes: 38
- 90 or more minutes: 9
Means of transportation to work:
- Drove a car alone: 745 (83.9%)
- Carpooled: 8 (0.9%)
- Taxi: 11 (1.2%)
- Walked: 24 (2.7%)
- Worked at home: 93 (10.5%)

- Unemployment by race in 2022
- Unemployment rate for White non-Hispanic residents
- 10.0%Females

- Year of entry for the foreign-born population in Conway, Pennsylvania
- 172010 or later
- 02000 to 2009
- 01990 to 1999
- 01980 to 1989
- 01970 to 1979
- 45Before 1970

First ancestries reported:
- Italian: 163 (21.2%)
- German: 113 (14.7%)
- American: 95 (12.4%)
- Irish: 82 (10.7%)
- Polish: 55 (7.2%)
- Croatian: 51 (6.6%)
- Greek: 50 (6.5%)
- English: 47 (6.1%)
- Slovak: 12 (1.6%)
- Scottish: 5 (0.7%)
- Swiss: 5 (0.7%)
- Austrian: 4 (0.5%)
- European: 4 (0.5%)
- Ukrainian: 4 (0.5%)
- Hungarian: 3 (0.4%)
- Scotch-Irish: 3 (0.4%)
- Welsh: 3 (0.4%)
Most common places of birth for foreign-born residents (%):
| Conway: | 33.3% (12) |
| Pennsylvania: | 1.1% (10,331) |
| Conway: | 22.2% (8) |
| Pennsylvania: | 1.9% (18,065) |
| Conway: | 16.7% (6) |
| Pennsylvania: | 5.8% (54,190) |
| Conway: | 11.1% (4) |
| Pennsylvania: | 0.2% (1,916) |
Place of birth for U.S.-born residents:
- This state: 1,792
- Other state: 243
- Northeast: 50
- Midwest: 30
- South: 88
- West: 83
93.0% of Conway residents lived in the same house 1 years ago.
Out of people who lived in different houses, 34.2% lived in this county.
Out of people who lived in different counties, 94.9% lived in Pennsylvania.
| Conway: | 93.0% |
| State average: | 89.3% |
Education attainment for males 25 years and older:
- No schooling: 0
- Nursery to 4th grade: 0
- 5th and 6th grade: 0
- 7th and 8th grade: 23
- 9th grade: 2
- 10th grade: 3
- 11th grade: 0
- 12th grade, no diploma: 6
- High school graduate (or equivalency): 319
- Less than 1 year of college: 39
- Some college more than 1 year, no degree: 67
- Associate degree: 59
- Bachelor's degree: 146
- Master's degree: 39
- Professional school degree: 0
- Doctorate degree: 1

Education attainment for females 25 years and older:
- No schooling: 1
- Nursery to 4th grade: 0
- 5th and 6th grade: 0
- 7th and 8th grade: 18
- 9th grade: 5
- 10th grade: 0
- 11th grade: 15
- 12th grade, no diploma: 14
- High school graduate (or equivalency): 351
- Less than 1 year of college: 39
- Some college more than 1 year, no degree: 60
- Associate degree: 165
- Bachelor's degree: 130
- Master's degree: 66
- Professional school degree: 9
- Doctorate degree: 3


Housing units in structures:
- One, detached: 835
- One, attached: 9
- Two: 68
- 3 or 4: 42
- 5 to 9: 4
- 10 to 19: 65
- 50 or more: 90
- Mobile homes: 10
House/condo owner moved in on average 22 years ago
Renter moved in on average 7 years ago

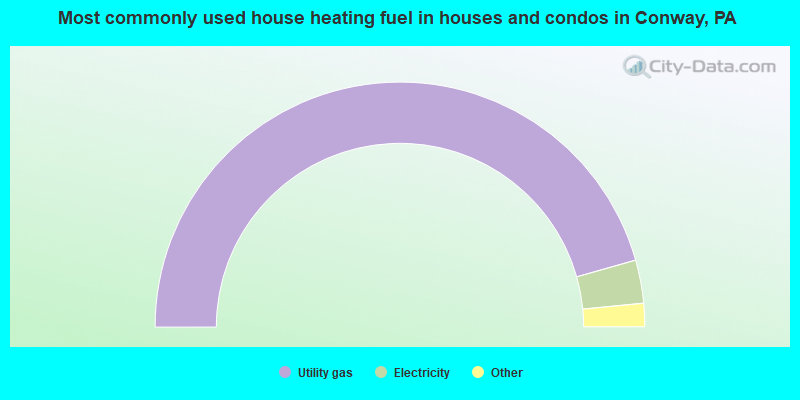
- 91.4%Utility gas
- 5.7%Electricity
- 1.7%Fuel oil, kerosene, etc.
- 1.3%Bottled, tank, or LP gas
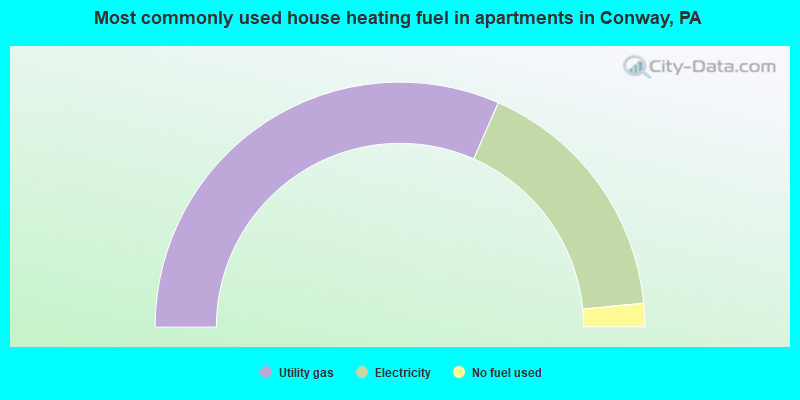
- 63.1%Utility gas
- 33.7%Electricity
- 3.1%No fuel used
Private vs. public school enrollment:
| Here: | 10.4% |
| Pennsylvania: | 15.7% |
| Here: | 11.6% |
| Pennsylvania: | 13.4% |
| Here: | 13.1% |
| Pennsylvania: | 39.8% |


