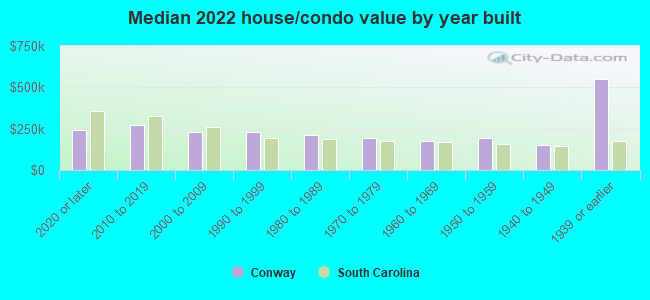
Conway, SC (South Carolina) Houses and Residents
| Conway: | $245,151 |
| South Carolina: | $254,600 |
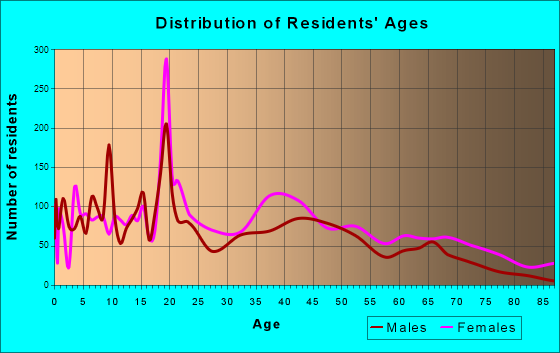
Total population: 20,175 (Urban population: 11,503, Rural population: 292 (all nonfarm))
Houses: 9,741 (8,476 occupied: 5,595 owner occupied, 3,588 renter occupied)
| % of renters here: | 39% |
| State: | 28% |
Housing density: 767 houses/condos per square mile
Median price asked for vacant for-sale houses and condos in 2022: $186,427.
Median contract rent in 2022: $716 (lower quartile is $418, upper quartile is $1,128)
Median rent asked for vacant for-rent units in 2022: $1,012
Median gross rent in Conway, SC in 2022: $924
Housing units in Conway with a mortgage: 3,642 (294 second mortgage, 0 home equity loan, 286 both second mortgage and home equity loan)
Houses without a mortgage: 106
Median household income for houses/condos with a mortgage: $73,520
Median household income for apartments without a mortgage: $48,320
Median monthly housing costs: $879
Compare current foreclosures in Conway, SC:
| Photo | Address | Area | Beds / Baths | Price | Details |
|---|---|---|---|---|---|

|
#1
Gray Oaks Dr
Conway, SC 29526
|
2,350 sq. feet
|
2 baths 3 beds |
show details | |

|
#2
Tidway Cir
Conway, SC 29527
|
1,191 sq. feet
|
2 baths 3 beds |
show details | |

|
#3
Waccamaw Dr
Conway, SC 29526
|
1,296 sq. feet
|
1 baths 3 beds |
show details | |

|
#4
Wayside Rd
Conway, SC 29527
|
1,456 sq. feet
|
2 baths 3 beds |
show details | |

|
#5
Anderson St
Conway, SC 29526
|
1,494 sq. feet
|
2 baths 3 beds |
show details | |

|
#6
Elkford Dr
Conway, SC 29526
|
1,276 sq. feet
|
2 baths 3 beds |
show details | |

|
#7
Waccamaw Dr
Conway, SC 29526
|
1,296 sq. feet
|
1 baths 3 beds |
show details | |

|
#8
Lundy Short Cut Rd
Conway, SC 29527
|
2,432 sq. feet
|
2 baths 3 beds |
show details | |

|
#9
Old Highway 90
Conway, SC 29526
|
1,020 sq. feet
|
1 baths 3 beds |
show details | |

|
#10
Crusade Cir
Conway, SC 29526
|
1,247 sq. feet
|
2 baths 3 beds |
show details |
| Photo | Address | Area | Beds / Baths | Price | Details |
|---|---|---|---|---|---|

|
#11
Oak St
Conway, SC 29526
|
1,386 sq. feet
|
2 baths 3 beds |
show details | |

|
#12
Cheticamp Ct
Conway, SC 29527
|
1,322 sq. feet
|
2 baths 3 beds |
show details | |

|
#13
Weldon Ln
Conway, SC 29526
|
1,421 sq. feet
|
2 baths 3 beds |
show details | |

|
#14
Maple Ave
Conway, SC 29527
|
1,075 sq. feet
|
1 baths 3 beds |
show details | |

|
#15
Busbee St
Conway, SC 29526
|
1,695 sq. feet
|
1 baths 3 beds |
show details | |

|
#16
Wildhorse Dr
Conway, SC 29526
|
2,676 sq. feet
|
4 baths 4 beds |
show details | |

|
#17
Abberbury Dr
Conway, SC 29527
|
- sq. feet
|
- baths - beds |
show details | |

|
#18
Windsor Springs Rd
Conway, SC 29527
|
- sq. feet
|
- baths - beds |
show details | |

|
#19
Blackthorn Dr
Conway, SC 29526
|
- sq. feet
|
- baths - beds |
show details | |

|
#20
Merganser Dr
Conway, SC 29527
|
- sq. feet
|
- baths - beds |
show details |
| Photo | Address | Area | Beds / Baths | Price | Details |
|---|---|---|---|---|---|

|
#21
Harvest Ridge Way
Conway, SC 29527
|
- sq. feet
|
- baths - beds |
show details | |

|
#22
Waccamaw Pines Dr
Conway, SC 29526
|
- sq. feet
|
- baths - beds |
show details | |

|
#23
Green Fir Loop
Conway, SC 29527
|
- sq. feet
|
- baths - beds |
show details | |

|
#24
Helms Way
Conway, SC 29526
|
- sq. feet
|
- baths - beds |
show details | |

|
#25
Stilley Cir
Conway, SC 29526
|
- sq. feet
|
- baths - beds |
show details | |

|
#26
Ward Cir
Conway, SC 29527
|
- sq. feet
|
- baths - beds |
show details | |

|
#27
Fairway Ln
Conway, SC 29526
|
- sq. feet
|
- baths - beds |
show details | |

|
#28
Borrowdale Dr
Conway, SC 29526
|
- sq. feet
|
- baths - beds |
show details | |

|
#29
Ridgedale Dr
Conway, SC 29526
|
- sq. feet
|
- baths - beds |
show details | |

|
#30
Maidens Choice Rd
Conway, SC 29527
|
- sq. feet
|
- baths - beds |
show details |
| Photo | Address | Area | Beds / Baths | Price | Details |
|---|---|---|---|---|---|

|
#31
Birch Ln
Conway, SC 29526
|
- sq. feet
|
- baths - beds |
show details | |

|
#32
9th Ave Apt D6
Conway, SC 29527
|
- sq. feet
|
- baths - beds |
show details | |

|
#33
Holly Loop
Conway, SC 29527
|
- sq. feet
|
- baths - beds |
show details | |

|
#34
Mallard Ct
Conway, SC 29526
|
- sq. feet
|
- baths - beds |
show details | |

|
#35
Upper Saddle Cir
Conway, SC 29526
|
- sq. feet
|
- baths - beds |
show details | |

|
#36
Wise Rd
Conway, SC 29526
|
- sq. feet
|
- baths - beds |
show details | |

|
#37
Cottage Creek Cir
Conway, SC 29527
|
- sq. feet
|
- baths - beds |
show details | |

|
#38
Pine St
Conway, SC 29526
|
- sq. feet
|
- baths - beds |
show details | |

|
#39
Hallie Martin Rd
Conway, SC 29527
|
- sq. feet
|
- baths - beds |
show details | |

|
#40
Claremont Ct
Conway, SC 29526
|
- sq. feet
|
- baths - beds |
show details |
| Photo | Address | Area | Beds / Baths | Price | Details |
|---|---|---|---|---|---|

|
#41
Upper Saddle Cir
Conway, SC 29526
|
- sq. feet
|
- baths - beds |
show details | |

|
#42
Highway 65
Conway, SC 29526
|
- sq. feet
|
- baths - beds |
show details | |

|
#43
Merganser Dr
Conway, SC 29527
|
- sq. feet
|
- baths - beds |
show details | |

|
#44
Tilly Ct
Conway, SC 29526
|
- sq. feet
|
- baths - beds |
show details | |

|
#45
Rutland Ct
Conway, SC 29526
|
- sq. feet
|
- baths - beds |
show details | |

|
#46
Channel View Dr
Conway, SC 29527
|
- sq. feet
|
- baths - beds |
show details | |

|
#47
Tranquil Rd
Conway, SC 29527
|
- sq. feet
|
- baths - beds |
show details | |

|
#48
Myrtle Greens Dr Apt F
Conway, SC 29526
|
- sq. feet
|
- baths - beds |
show details | |

|
#49
Macarthur Dr
Conway, SC 29527
|
- sq. feet
|
- baths - beds |
show details | |

|
Check over 1 million property listings on Foreclosure.com!
|
browse all offers | |||

Latest news about housing in Conway, SC collected exclusively by city-data.com from local newspapers, TV, and radio stations

 | Apartments VS. mobile homes (0 replies) |
| Rental houses in Conway SC? (1 reply) |
| Conway/MB Condo/One story home (12 replies) |
| Glenmoor, Conway off 90, new homes and development (14 replies) |
| Mobile Homes Near The Coast (4 replies) |
| We Like Conway........I think. (102 replies) |
Median year apartment built: 1987
Household type by relationship:
Households: 26,989- Male householders: 3,504 (956 living alone), Female householders: 5,160 (1,901 living alone)
3,650 spouses (3,610 opposite-sex spouses), 439 unmarried partners, (439 opposite-sex unmarried partners), 6,652 children (5,826 natural, 512 adopted, 313 stepchildren), 460 grandchildren, 490 brothers or sisters, 323 parents, 0 foster children, 411 other relatives, 1,363 non-relatives
- In group quarters: 4,531
Size of family households: 3,217 2-persons, 1,186 3-persons, 564 4-persons, 454 5-persons, 191 6-persons, 20 7-or-more-persons.
Size of nonfamily households: 2,877 1-person, 349 2-persons, 75 3-persons, 166 4-persons, 35 5-persons.
2,077 married couples with children.
1,900 single-parent households (106 men, 1,794 women).
95.3% of residents of Conway speak English at home.
2.2% of residents speak Spanish at home (36% speak English very well, 53% speak English well, 11% speak English not well).
1.4% of residents speak other Indo-European language at home (57% speak English very well, 43% speak English well).
0.2% of residents speak Asian or Pacific Island language at home (5% speak English very well, 68% speak English well, 27% speak English not well).
1.0% of residents speak other language at home (33% speak English very well, 47% speak English well, 20% speak English not well).
Foreign born population: 835 (3.1%)
(62.8% of them are naturalized citizens)
| Here: | 5.9 |
| State: | 6.4 |
| Here: | 4.3 |
| State: | 4.5 |
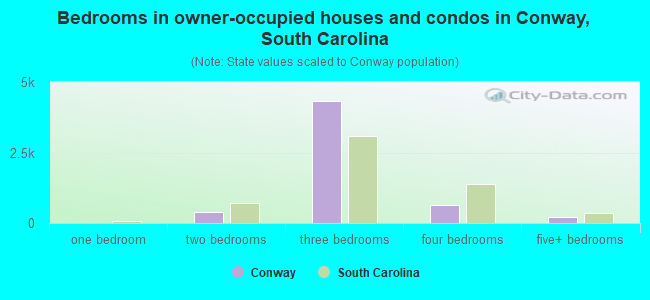
- Bedrooms in owner-occupied houses and condos in Conway, South Carolina
- 28no bedroom
- 01 bedroom
- 3752 bedrooms
- 4,3353 bedrooms
- 6474 bedrooms
- 2115+ bedrooms
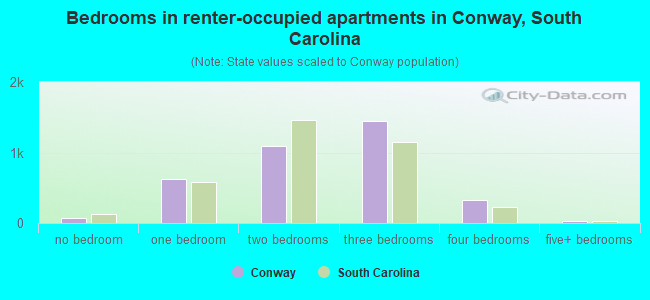
- Bedrooms in renter-occupied apartments in Conway, South Carolina
- 66no bedroom
- 6251 bedroom
- 1,0912 bedrooms
- 1,4513 bedrooms
- 3284 bedrooms
- 275+ bedrooms
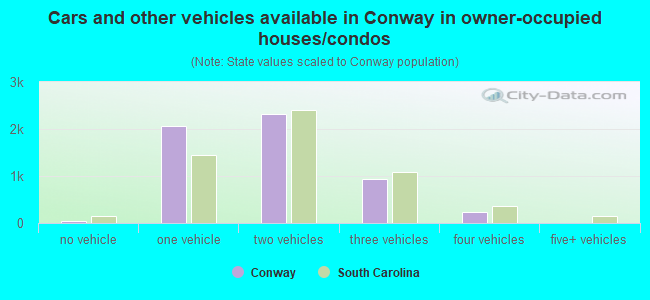
- Cars and other vehicles available in Conway in owner-occupied houses/condos
- 41no vehicle
- 2,0591 vehicle
- 2,3162 vehicles
- 9263 vehicles
- 2444 vehicles
- 105+ vehicles
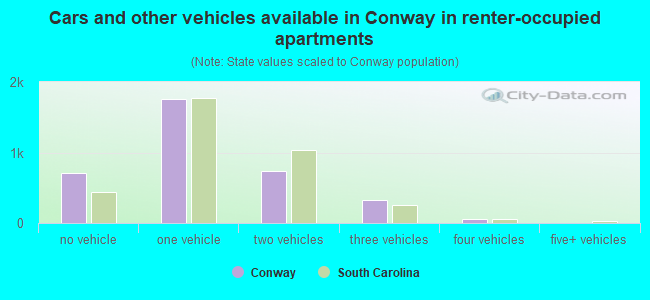
- Cars and other vehicles available in Conway in renter-occupied apartments
- 708no vehicle
- 1,7551 vehicle
- 7362 vehicles
- 3303 vehicles
- 544 vehicles
- 65+ vehicles
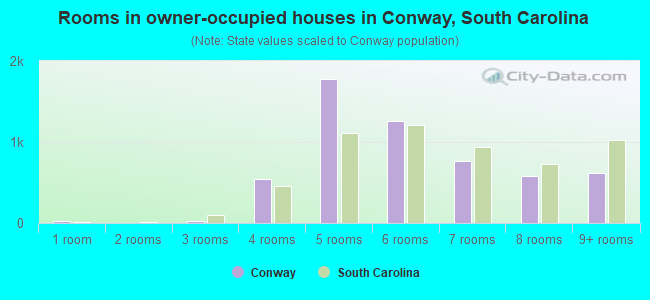
- Rooms in owner-occupied houses in Conway, South Carolina
- 281 room
- 02 rooms
- 193 rooms
- 5414 rooms
- 1,7785 rooms
- 1,2576 rooms
- 7707 rooms
- 5868 rooms
- 6169+ rooms
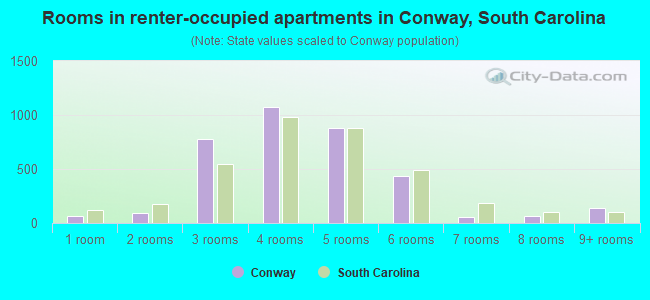
- Rooms in renter-occupied apartments in Conway, South Carolina
- 661 room
- 932 rooms
- 7773 rooms
- 1,0744 rooms
- 8835 rooms
- 4326 rooms
- 587 rooms
- 678 rooms
- 1399+ rooms
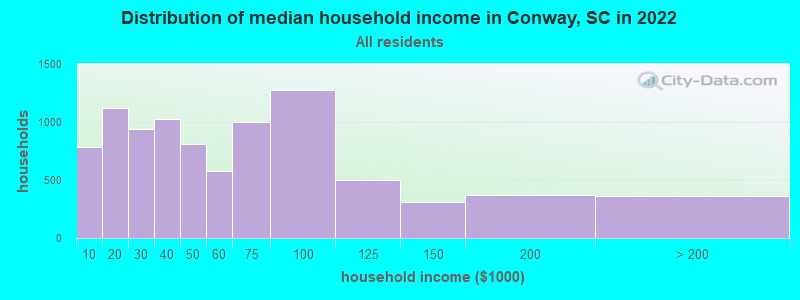
Conway, SC household income distribution

- 781Less than $10,000
- 1,119$10,000 to $19,999
- 943$20,000 to $29,999
- 1,026$30,000 to $39,999
- 810$40,000 to $49,999
- 577$50,000 to $59,999
- 996$60,000 to $74,999
- 1,275$75,000 to $99,999
- 498$100,000 to $124,999
- 314$125,000 to $149,999
- 372$150,000 to $199,999
- 360$200,000 or more
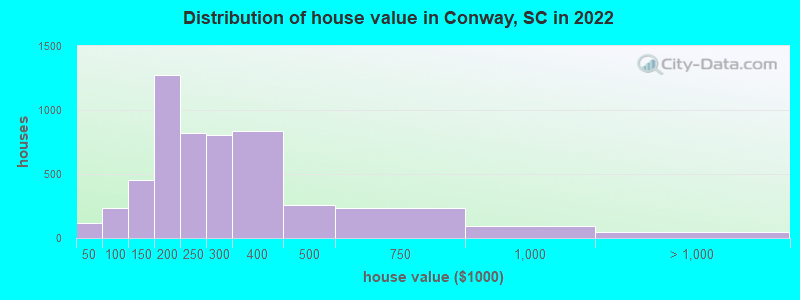
Home value of owner - occupied houses in 2022 in Conway, SC
-
- 20Less than $10,000
- 12$10,000 to $14,999
- 10$15,000 to $19,999
- 10$20,000 to $24,999
- 39$25,000 to $29,999
- 5$35,000 to $39,999
- 18$40,000 to $49,999
- 9$50,000 to $59,999
- 35$60,000 to $69,999
- 46$70,000 to $79,999
- 87$80,000 to $89,999
- 39$90,000 to $99,999
- 212$100,000 to $124,999
- 241$125,000 to $149,999
- 643$150,000 to $174,999
- 627$175,000 to $199,999
- 816$200,000 to $249,999
- 808$250,000 to $299,999
- 837$300,000 to $399,999
- 260$400,000 to $499,999
- 233$500,000 to $749,999
- 92$750,000 to $999,999
- 18$1,000,000 to $1,499,999
- 30$2,000,000 or more
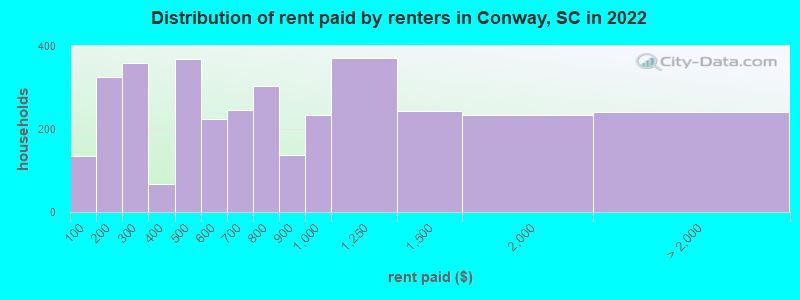
Rent paid by renters in 2022 in Conway, SC
-
- 134Less than $100
- 269$100 to $149
- 55$150 to $199
- 204$200 to $249
- 154$250 to $299
- 36$300 to $349
- 32$350 to $399
- 293$400 to $449
- 75$450 to $499
- 114$500 to $549
- 109$550 to $599
- 180$600 to $649
- 64$650 to $699
- 245$700 to $749
- 57$750 to $799
- 138$800 to $899
- 232$900 to $999
- 371$1,000 to $1,249
- 243$1,250 to $1,499
- 233$1,500 to $1,999
- 110$2,000 to $2,499
- 24$2,500 to $2,999
- 105No cash rent
Percentage of workers working in this county: 92.2%
Number of people working at home: 694 (6.6% of all workers)
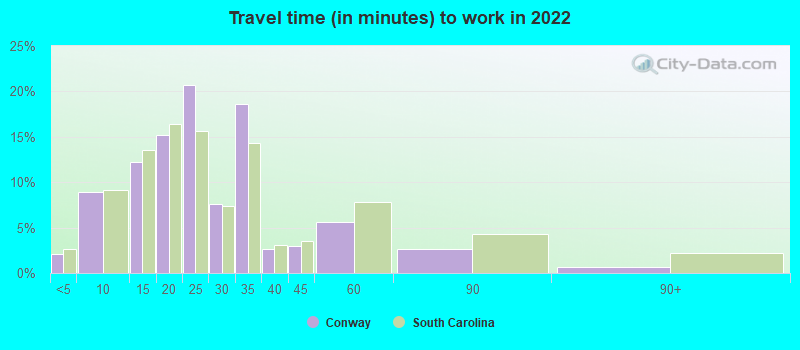
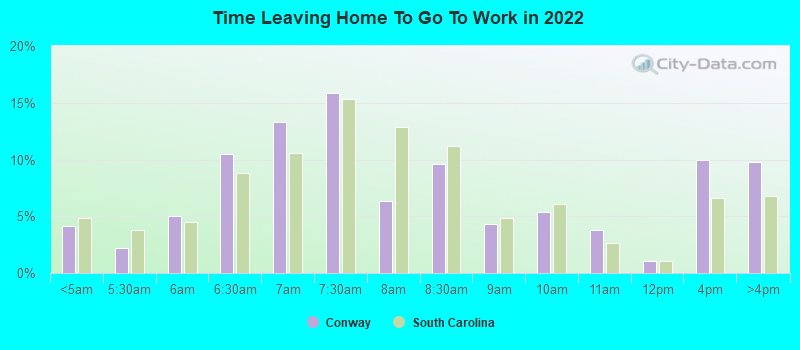
Travel time to work (commute)
- Less than 5 minutes: 391
- 5 to 9 minutes: 1,104
- 10 to 14 minutes: 1,402
- 15 to 19 minutes: 1,061
- 20 to 24 minutes: 1,379
- 25 to 29 minutes: 809
- 30 to 34 minutes: 1,507
- 35 to 39 minutes: 290
- 40 to 44 minutes: 486
- 45 to 59 minutes: 945
- 60 to 89 minutes: 274
- 90 or more minutes: 98
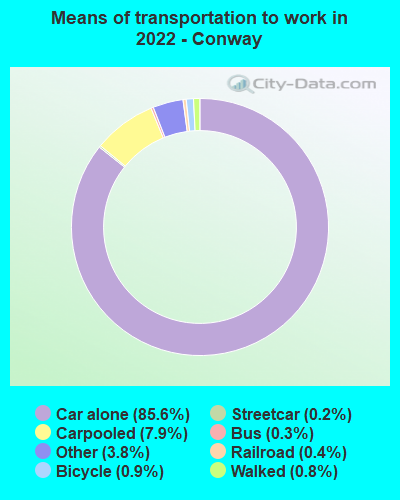
Means of transportation to work:
- Drove a car alone: 16,220 (77.6%)
- Carpooled: 1,841 (8.8%)
- Bus: 40 (0.2%)
- Subway or elevated rail: 33 (0.2%)
- Light rail, streetcar or trolley: 72 (0.3%)
- Ferryboat: 6 (0.0%)
- Taxi: 1,215 (5.8%)
- Bicycle: 206 (1.0%)
- Walked: 154 (0.7%)
- Worked at home: 694 (3.3%)
- Unemployment by race in 2022
- Unemployment rate for White non-Hispanic residents
- 5.7%Males
- 5.8%Females
- Unemployment rate for Black residents
- 3.9%Males
- 5.2%Females
- Unemployment rate for American Indian and Alaska Native residents
- 23.8%Females
- Unemployment rate for two or more race residents
- 11.7%Females
- Unemployment rate for Hispanic or Latino residents
- 12.7%Males
- 18.0%Females
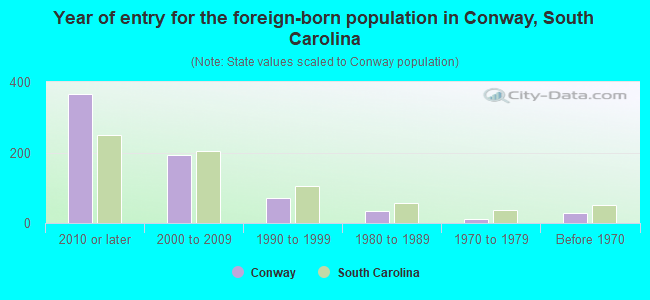
- Year of entry for the foreign-born population in Conway, South Carolina
- 3662010 or later
- 1942000 to 2009
- 721990 to 1999
- 331980 to 1989
- 101970 to 1979
- 27Before 1970
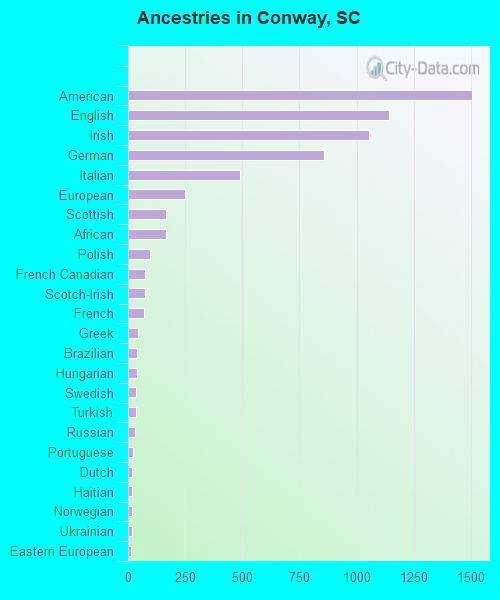
First ancestries reported:
- American: 1,504 (10.1%)
- English: 1,141 (7.7%)
- Irish: 1,056 (7.1%)
- German: 856 (5.8%)
- Italian: 490 (3.3%)
- European: 251 (1.7%)
- Scottish: 165 (1.1%)
- African: 165 (1.1%)
- Polish: 97 (0.7%)
- French Canadian: 73 (0.5%)
- Scotch-Irish: 73 (0.5%)
- French: 68 (0.5%)
- Greek: 45 (0.3%)
- Brazilian: 41 (0.3%)
- Hungarian: 39 (0.3%)
- Swedish: 33 (0.2%)
- Turkish: 33 (0.2%)
- Russian: 30 (0.2%)
- Portuguese: 20 (0.1%)
- Dutch: 19 (0.1%)
- Haitian: 17 (0.1%)
- Norwegian: 17 (0.1%)
- Ukrainian: 16 (0.1%)
- Eastern European: 15 (0.1%)
- Czech: 13 (0.09%)
- Croatian: 10 (0.07%)
- Welsh: 10 (0.07%)
- British West Indian: 10 (0.07%)
- New Zealander: 8 (0.05%)
- Albanian: 7 (0.05%)
- Canadian: 6 (0.04%)
- Nigerian: 6 (0.04%)
- Lithuanian: 6 (0.04%)
- Swiss: 5 (0.03%)
- Pennsylvania German: 5 (0.03%)
- Czechoslovakian: 5 (0.03%)
- Northern European: 5 (0.03%)
Most common places of birth for foreign-born residents (%):
| Conway: | 17.7% (131) |
| South Carolina: | 6.8% (18,307) |
| Conway: | 12.2% (90) |
| South Carolina: | 0.2% (581) |
| Conway: | 10.6% (78) |
| South Carolina: | 2.0% (5,344) |
| Conway: | 7.3% (54) |
| South Carolina: | 1.2% (3,296) |
| Conway: | 5.7% (42) |
| South Carolina: | 0.3% (701) |
| Conway: | 5.4% (40) |
| South Carolina: | 0.2% (540) |
| Conway: | 4.3% (32) |
| South Carolina: | 0.2% (457) |
| Conway: | 3.5% (26) |
| South Carolina: | 3.7% (9,982) |
| Conway: | 3.5% (26) |
| South Carolina: | 0.1% (159) |
| Conway: | 3.0% (22) |
| South Carolina: | 0.8% (2,055) |
| Conway: | 2.6% (19) |
| South Carolina: | 0.4% (1,192) |
| Conway: | 2.4% (18) |
| South Carolina: | 0.6% (1,691) |
| Conway: | 2.3% (17) |
| South Carolina: | 1.3% (3,522) |
| Conway: | 2.2% (16) |
| South Carolina: | 0.7% (1,840) |
| Conway: | 2.2% (16) |
| South Carolina: | 0.2% (622) |
| Conway: | 2.2% (16) |
| South Carolina: | 4.3% (11,533) |
| Conway: | 2.0% (15) |
| South Carolina: | 0.1% (177) |
| Conway: | 2.0% (15) |
| South Carolina: | 22.5% (60,774) |
| Conway: | 1.9% (14) |
| South Carolina: | 4.1% (11,031) |
| Conway: | 1.9% (14) |
| South Carolina: | 3.2% (8,721) |
| Conway: | 1.9% (14) |
| South Carolina: | 0.1% (203) |
| Conway: | 1.8% (13) |
| South Carolina: | 1.7% (4,513) |
Place of birth for U.S.-born residents:
- This state: 12,810
- Other state: 12,944
- Northeast: 5,622
- Midwest: 1,593
- South: 4,927
- West: 769
79.7% of Conway residents lived in the same house 1 years ago.
Out of people who lived in different houses, 22.8% lived in this county.
Out of people who lived in different counties, 23.4% lived in South Carolina.
| Conway: | 79.7% |
| State average: | 86.5% |
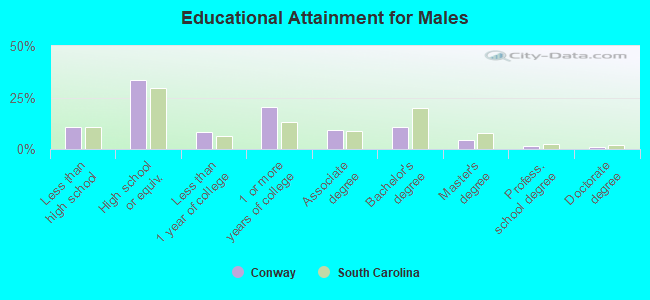
Education attainment for males 25 years and older:
- No schooling: 174
- Nursery to 4th grade: 16
- 5th and 6th grade: 8
- 7th and 8th grade: 11
- 9th grade: 57
- 10th grade: 129
- 11th grade: 143
- 12th grade, no diploma: 235
- High school graduate (or equivalency): 2,378
- Less than 1 year of college: 595
- Some college more than 1 year, no degree: 1,459
- Associate degree: 666
- Bachelor's degree: 766
- Master's degree: 327
- Professional school degree: 114
- Doctorate degree: 54
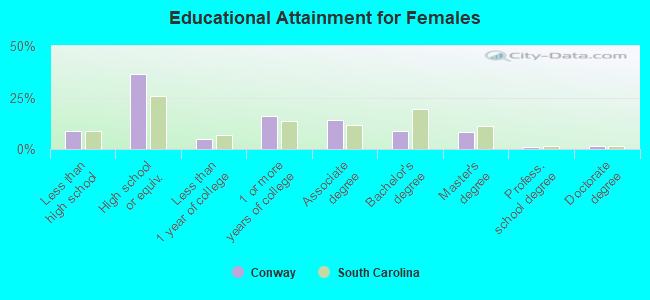
Education attainment for females 25 years and older:
- No schooling: 25
- Nursery to 4th grade: 6
- 5th and 6th grade: 9
- 7th and 8th grade: 24
- 9th grade: 90
- 10th grade: 95
- 11th grade: 427
- 12th grade, no diploma: 124
- High school graduate (or equivalency): 3,310
- Less than 1 year of college: 460
- Some college more than 1 year, no degree: 1,472
- Associate degree: 1,304
- Bachelor's degree: 792
- Master's degree: 761
- Professional school degree: 76
- Doctorate degree: 149
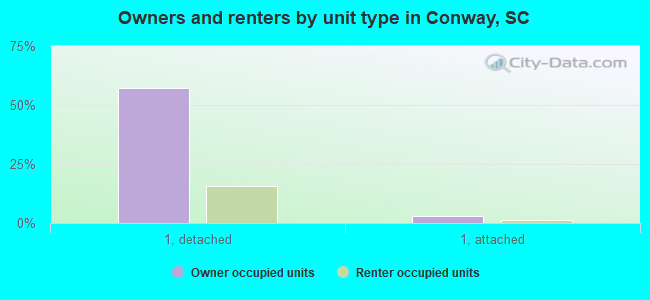
Housing units in structures:
- One, detached: 6,972
- One, attached: 383
- Two: 354
- 3 or 4: 571
- 5 to 9: 887
- 10 to 19: 172
- 20 to 49: 261
- 50 or more: 43
- Mobile homes: 95
Median worth of mobile homes: $211,336
Housing units lacking complete kitchen facilities in 2022: 1.4%
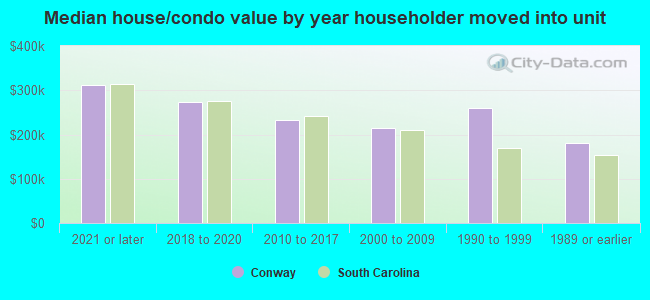
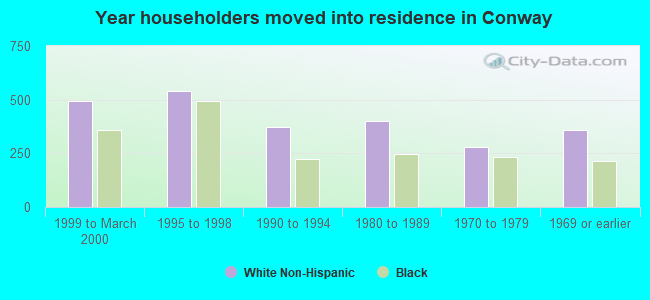
House/condo owner moved in on average 7 years ago
Renter moved in on average 4 years ago
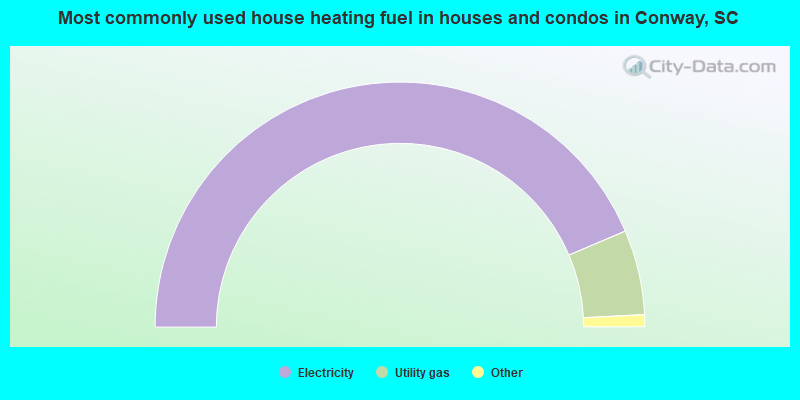
- 87.3%Electricity
- 11.2%Utility gas
- 0.8%Bottled, tank, or LP gas
- 0.3%Solar energy
- 0.2%No fuel used
- 0.1%Fuel oil, kerosene, etc.
- 0.1%Other fuel
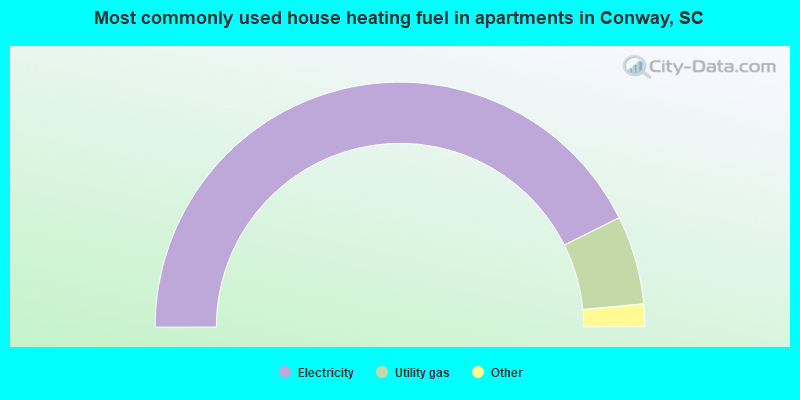
- 85.3%Electricity
- 11.7%Utility gas
- 1.6%No fuel used
- 1.4%Bottled, tank, or LP gas
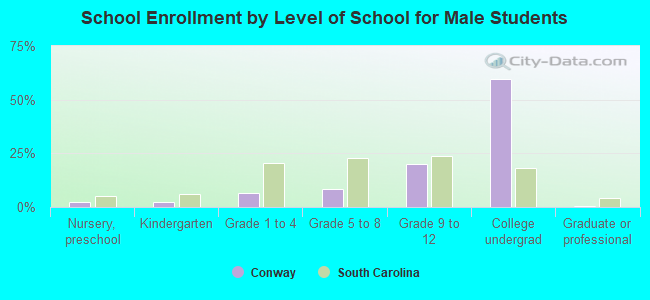
Private vs. public school enrollment:
| Here: | 0.9% |
| South Carolina: | 14.4% |
| Here: | 6.1% |
| South Carolina: | 11.1% |
| Here: | 5.2% |
| South Carolina: | 21.9% |