Conway Springs, KS (Kansas) Houses and Residents
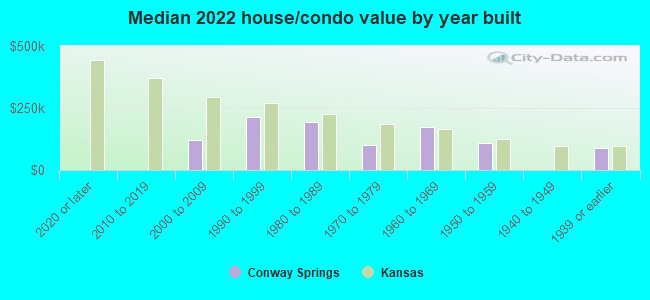
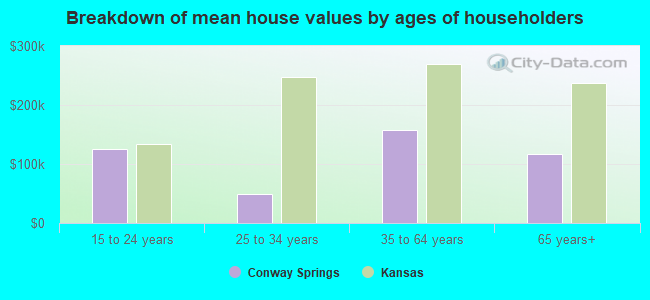
| Conway Springs: | $124,964 |
| Kansas: | $206,600 |
Total population: 1,239 (Urban population: 0, Rural population: 1,355 (21 farm, 1,334 nonfarm))
Houses: 563 (538 occupied: 385 owner occupied, 159 renter occupied)
| % of renters here: | 29% |
| State: | 32% |
Housing density: 717 houses/condos per square mile
Median price asked for vacant for-sale houses and condos in 2022: $17,375.
Median contract rent in 2022: $657 (lower quartile is $524, upper quartile is $751)
Median rent asked for vacant for-rent units in 2022: $829
Median gross rent in Conway Springs, KS in 2022: $899
Housing units in Conway Springs with a mortgage: 229 (6 second mortgage, 0 home equity loan, 4 both second mortgage and home equity loan)
Houses without a mortgage: 3
Median household income for houses/condos with a mortgage: $59,921
Median household income for apartments without a mortgage: $63,788
Median monthly housing costs: $895
Compare current foreclosures near Conway Springs, KS:
| Photo | Address | Area | Beds / Baths | Price | Details |
|---|---|---|---|---|---|

|
#1
N 5th St
Conway Springs, KS 67031
|
1,088 sq. feet
|
2 baths 3 beds |
$39,900
|
show details |

|
#2
W Kansas St
Conway Springs, KS 67031
|
1,760 sq. feet
|
2 baths 3 beds |
show details | |

|
#3
N Blackstone Rd
Argonia, KS 67004
|
2,524 sq. feet
|
2 baths 4 beds |
show details | |

|
#4
N Poplar St
Wellington, KS 67152
|
1,220 sq. feet
|
2 baths 2 beds |
show details | |

|
#5
W 39th St S
Goddard, KS 67052
|
4,221 sq. feet
|
3 baths 3 beds |
show details | |

|
#6
E 12th St
Wellington, KS 67152
|
1,108 sq. feet
|
1 baths 2 beds |
show details | |

|
#7
N A St
Wellington, KS 67152
|
2,008 sq. feet
|
2 baths 4 beds |
show details | |

|
#8
W 10th St
Wellington, KS 67152
|
964 sq. feet
|
1 baths 2 beds |
show details | |

|
#9
N C St
Wellington, KS 67152
|
988 sq. feet
|
1 baths 2 beds |
show details | |

|
#10
N Olive St
Wellington, KS 67152
|
759 sq. feet
|
2 baths 2 beds |
show details |
| Photo | Address | Area | Beds / Baths | Price | Details |
|---|---|---|---|---|---|

|
#11
N B St
Wellington, KS 67152
|
1,184 sq. feet
|
1 baths 3 beds |
show details | |

|
#12
N Olive St
Wellington, KS 67152
|
1,338 sq. feet
|
1 baths 2 beds |
show details | |

|
#13
N Olive St
Wellington, KS 67152
|
1,216 sq. feet
|
1 baths 3 beds |
show details | |

|
#14
N Vandenburgh Ave
Wellington, KS 67152
|
1,084 sq. feet
|
1 baths 3 beds |
show details | |

|
#15
W College St
Wellington, KS 67152
|
1,742 sq. feet
|
2 baths 4 beds |
show details | |

|
#16
Fairfield St
Norwich, KS 67118
|
995 sq. feet
|
1 baths 2 beds |
show details | |

|
#17
Janet St
Clearwater, KS 67026
|
1,428 sq. feet
|
2 baths 4 beds |
show details | |

|
#18
N High St
Argonia, KS 67004
|
1,115 sq. feet
|
1 baths 4 beds |
show details | |

|
#19
E South St
Wellington, KS 67152
|
1,456 sq. feet
|
2 baths 3 beds |
show details | |

|
#20
E 19th St
Wellington, KS 67152
|
- sq. feet
|
- baths - beds |
show details |
| Photo | Address | Area | Beds / Baths | Price | Details |
|---|---|---|---|---|---|

|
#21
SE 110 St
Norwich, KS 67118
|
- sq. feet
|
- baths - beds |
show details | |

|
#22
W 55th St S
Clearwater, KS 67026
|
- sq. feet
|
- baths - beds |
show details | |

|
#23
N C St
Wellington, KS 67152
|
- sq. feet
|
- baths - beds |
show details | |

|
#24
S Osborn St
Mayfield, KS 67103
|
- sq. feet
|
- baths - beds |
show details | |

|
Check over 1 million property listings on Foreclosure.com!
|
browse all offers | |||


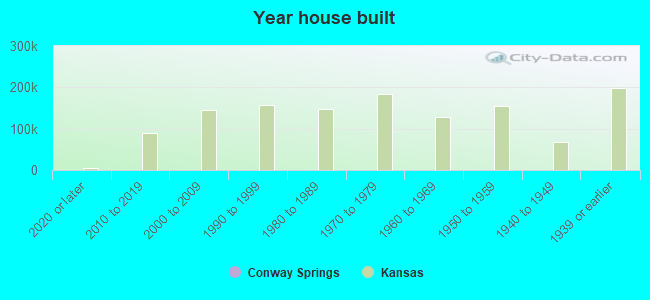
Median year apartment built: 1967
Household type by relationship:
Households: 1,560- Male householders: 270 (104 living alone), Female householders: 263 (85 living alone)
241 spouses (241 opposite-sex spouses), 28 unmarried partners, (28 opposite-sex unmarried partners), 585 children (550 natural, 21 adopted, 14 stepchildren), 17 grandchildren, 46 brothers or sisters, 0 parents, 0 foster children, 0 other relatives, 68 non-relatives
- In group quarters: 42
Size of family households: 142 2-persons, 74 3-persons, 40 4-persons, 48 5-persons, 9 6-persons, 13 7-or-more-persons.
Size of nonfamily households: 197 1-person, 3 2-persons, 3 3-persons, 9 4-persons.
371 married couples with children.
64 single-parent households (14 men, 50 women).
99.9% of residents of Conway Springs speak English at home.
| Here: | 7.0 |
| State: | 6.9 |
| Here: | 5.6 |
| State: | 4.4 |
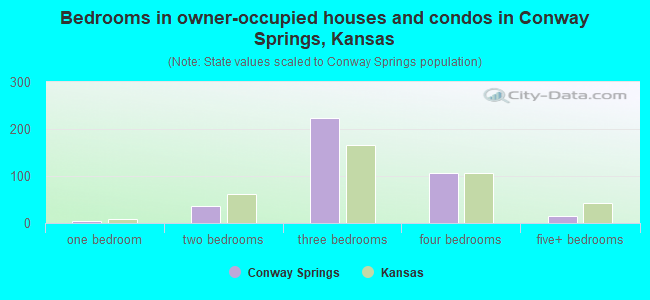
- Bedrooms in owner-occupied houses and condos in Conway Springs, Kansas
- 0no bedroom
- 41 bedroom
- 362 bedrooms
- 2243 bedrooms
- 1074 bedrooms
- 145+ bedrooms
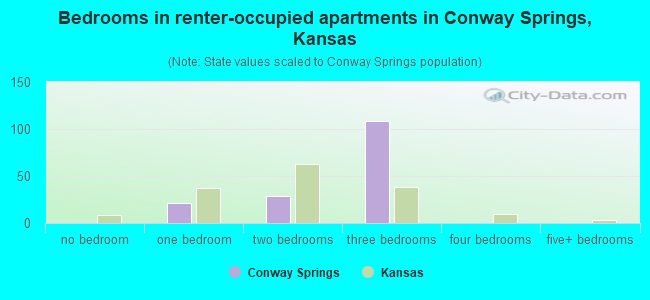
- Bedrooms in renter-occupied apartments in Conway Springs, Kansas
- 0no bedroom
- 211 bedroom
- 292 bedrooms
- 1093 bedrooms
- 04 bedrooms
- 05+ bedrooms
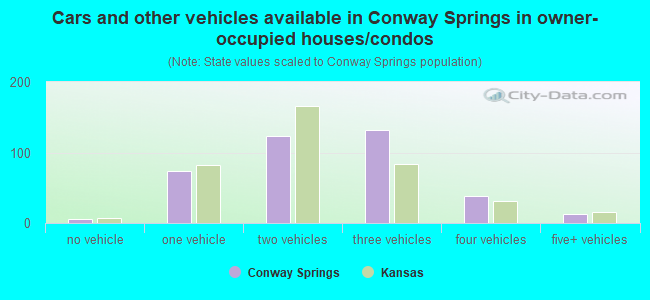
- Cars and other vehicles available in Conway Springs in owner-occupied houses/condos
- 5no vehicle
- 741 vehicle
- 1242 vehicles
- 1323 vehicles
- 384 vehicles
- 135+ vehicles
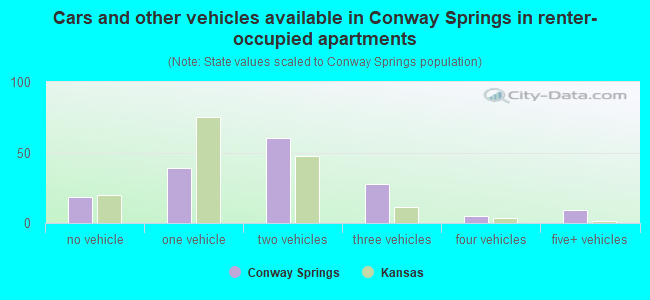
- Cars and other vehicles available in Conway Springs in renter-occupied apartments
- 18no vehicle
- 391 vehicle
- 602 vehicles
- 283 vehicles
- 54 vehicles
- 95+ vehicles
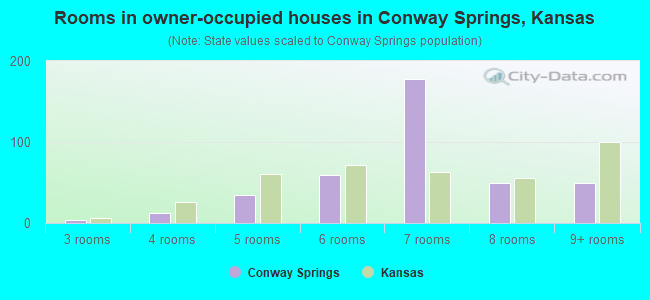
- Rooms in owner-occupied houses in Conway Springs, Kansas
- 01 room
- 02 rooms
- 43 rooms
- 124 rooms
- 345 rooms
- 596 rooms
- 1787 rooms
- 498 rooms
- 499+ rooms
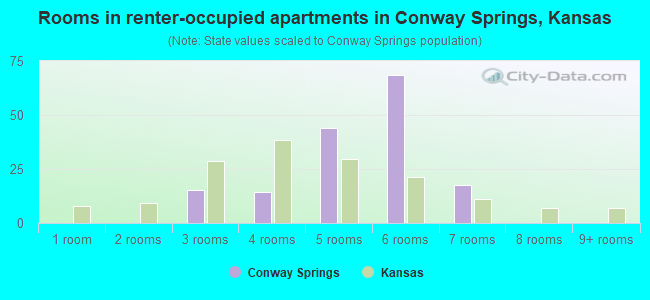
- Rooms in renter-occupied apartments in Conway Springs, Kansas
- 01 room
- 02 rooms
- 153 rooms
- 144 rooms
- 445 rooms
- 696 rooms
- 177 rooms
- 08 rooms
- 09+ rooms
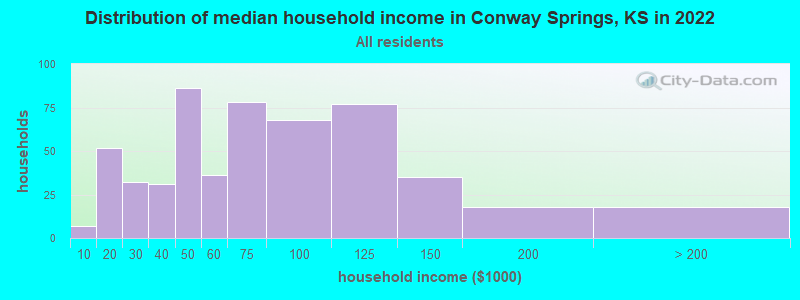
Conway Springs, KS household income distribution

- 7Less than $10,000
- 52$10,000 to $19,999
- 32$20,000 to $29,999
- 31$30,000 to $39,999
- 86$40,000 to $49,999
- 36$50,000 to $59,999
- 78$60,000 to $74,999
- 68$75,000 to $99,999
- 77$100,000 to $124,999
- 35$125,000 to $149,999
- 18$150,000 to $199,999
- 18$200,000 or more
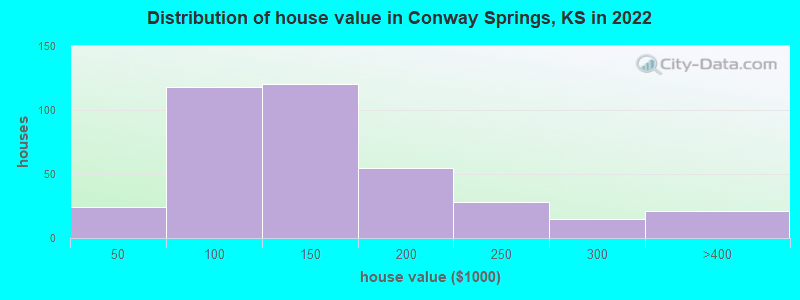
Home value of owner - occupied houses in 2022 in Conway Springs, KS
-
- 5Less than $10,000
- 4$30,000 to $34,999
- 3$35,000 to $39,999
- 10$40,000 to $49,999
- 14$50,000 to $59,999
- 19$60,000 to $69,999
- 23$70,000 to $79,999
- 40$80,000 to $89,999
- 8$90,000 to $99,999
- 92$100,000 to $124,999
- 27$125,000 to $149,999
- 40$150,000 to $174,999
- 14$175,000 to $199,999
- 27$200,000 to $249,999
- 15$250,000 to $299,999
- 21$300,000 to $399,999
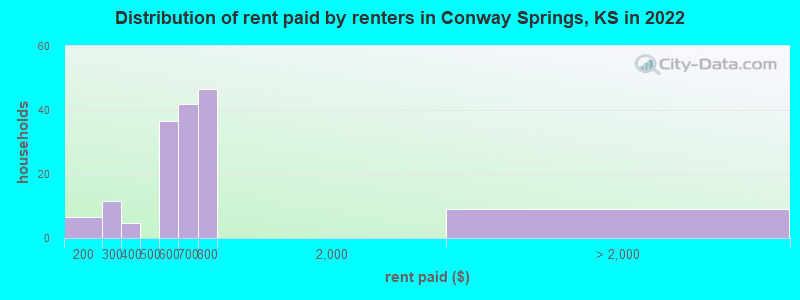
Rent paid by renters in 2022 in Conway Springs, KS
-
- 6$150 to $199
- 5$200 to $249
- 5$250 to $299
- 4$300 to $349
- 26$500 to $549
- 9$550 to $599
- 9$600 to $649
- 32$650 to $699
- 10$700 to $749
- 36$750 to $799
- 8No cash rent
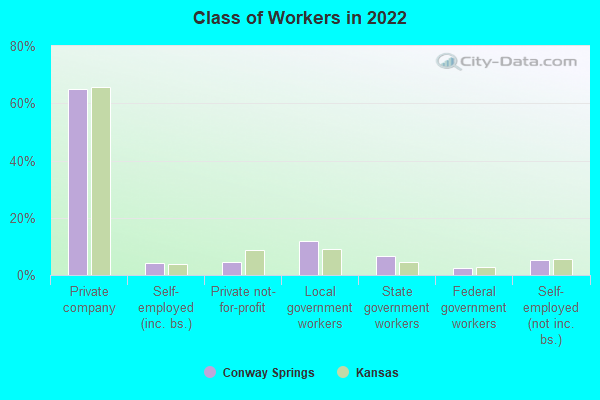
Percentage of workers working in this county: 55.1%
Number of people working at home: 44 (6.0% of all workers)
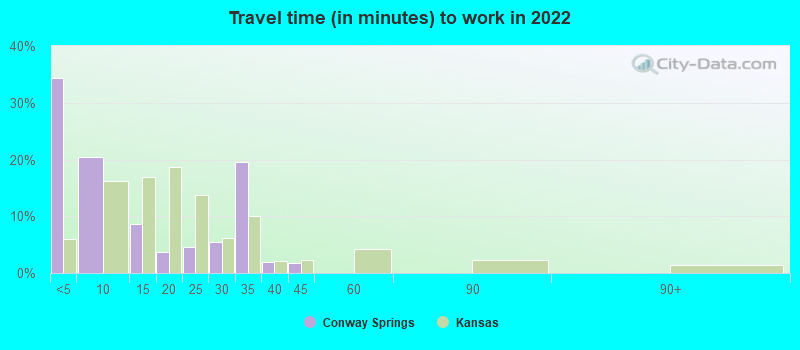
Travel time to work (commute)
- Less than 5 minutes: 148
- 5 to 9 minutes: 30
- 10 to 14 minutes: 20
- 15 to 19 minutes: 25
- 20 to 24 minutes: 68
- 25 to 29 minutes: 121
- 30 to 34 minutes: 74
- 35 to 39 minutes: 59
- 40 to 44 minutes: 26
- 45 to 59 minutes: 71
- 60 to 89 minutes: 16
- 90 or more minutes: 5
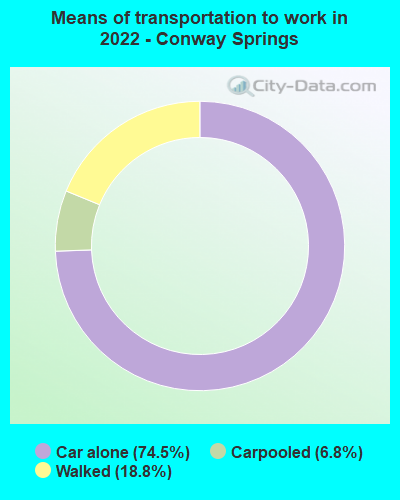
Means of transportation to work:
- Drove a car alone: 290 (66.2%)
- Carpooled: 26 (5.9%)
- Walked: 75 (17.1%)
- Worked at home: 44 (10.0%)
- Unemployment by race in 2022
- Unemployment rate for White non-Hispanic residents
- 3.1%Males
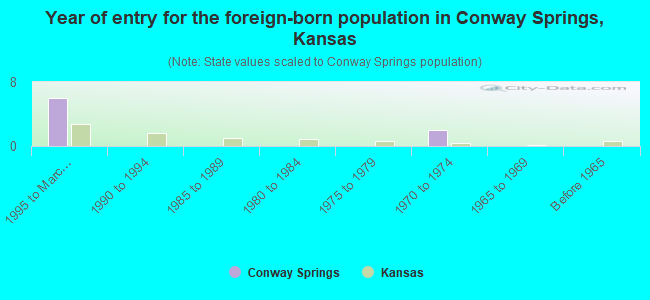
- Year of entry for the foreign-born population in Conway Springs, Kansas
- 61995 to March 2000
- 01990 to 1994
- 01985 to 1989
- 01980 to 1984
- 01975 to 1979
- 21970 to 1974
- 01965 to 1969
- 0Before 1965
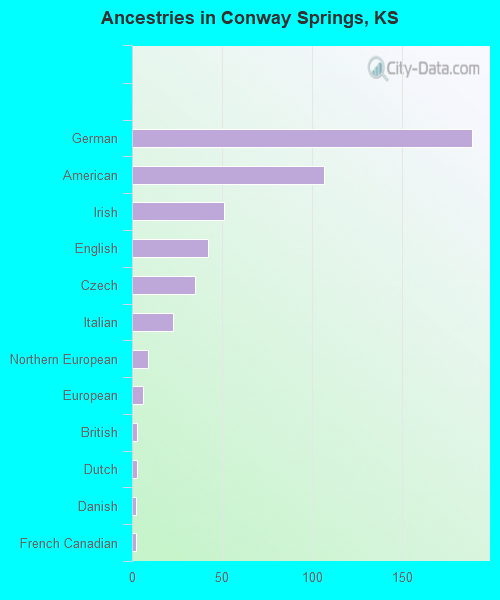
First ancestries reported:
- German: 189 (35.5%)
- American: 107 (20.1%)
- Irish: 51 (9.6%)
- English: 42 (7.9%)
- Czech: 35 (6.6%)
- Italian: 23 (4.3%)
- Northern European: 9 (1.7%)
- European: 6 (1.1%)
- British: 3 (0.6%)
- Dutch: 3 (0.6%)
- Danish: 2 (0.4%)
- French Canadian: 2 (0.4%)
- French: 1 (0.2%)
- Welsh: 1 (0.2%)
Most common places of birth for foreign-born residents (%):
| Conway Springs: | 50.0% (4) |
| Kansas: | 3.7% (4,953) |
| Conway Springs: | 25.0% (2) |
| Kansas: | 2.6% (3,486) |
| Conway Springs: | 25.0% (2) |
| Kansas: | 0.2% (207) |
Place of birth for U.S.-born residents:
- This state: 1,357
- Other state: 203
- Northeast: 11
- Midwest: 24
- South: 107
- West: 62
90.9% of Conway Springs residents lived in the same house 1 years ago.
Out of people who lived in different houses, 26.5% lived in this county.
Out of people who lived in different counties, 54.6% lived in Kansas.
| Conway Springs: | 90.9% |
| State average: | 85.3% |
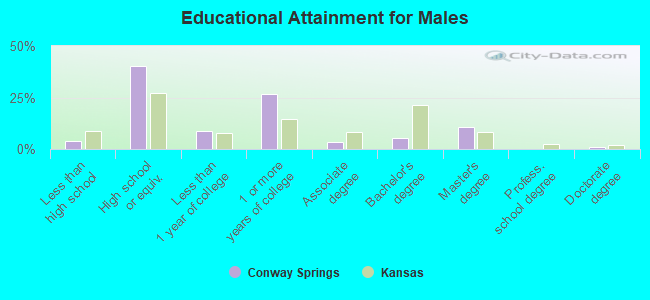
Education attainment for males 25 years and older:
- No schooling: 0
- Nursery to 4th grade: 0
- 5th and 6th grade: 0
- 7th and 8th grade: 0
- 9th grade: 0
- 10th grade: 6
- 11th grade: 2
- 12th grade, no diploma: 8
- High school graduate (or equivalency): 160
- Less than 1 year of college: 35
- Some college more than 1 year, no degree: 107
- Associate degree: 14
- Bachelor's degree: 21
- Master's degree: 42
- Professional school degree: 0
- Doctorate degree: 4
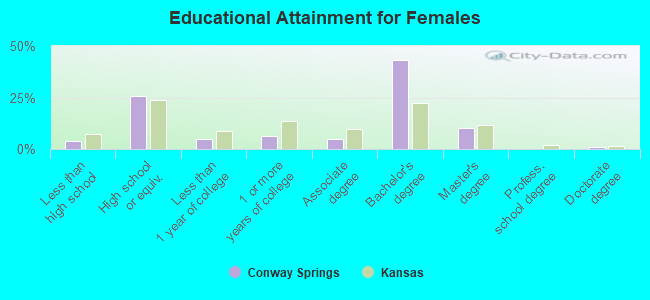
Education attainment for females 25 years and older:
- No schooling: 2
- Nursery to 4th grade: 0
- 5th and 6th grade: 0
- 7th and 8th grade: 0
- 9th grade: 2
- 10th grade: 0
- 11th grade: 9
- 12th grade, no diploma: 6
- High school graduate (or equivalency): 126
- Less than 1 year of college: 23
- Some college more than 1 year, no degree: 31
- Associate degree: 23
- Bachelor's degree: 211
- Master's degree: 49
- Professional school degree: 0
- Doctorate degree: 4


Housing units in structures:
- One, detached: 530
- 3 or 4: 6
- 5 to 9: 5
- 10 to 19: 7
- Mobile homes: 14
Housing units lacking complete kitchen facilities in 2022: 4.3%
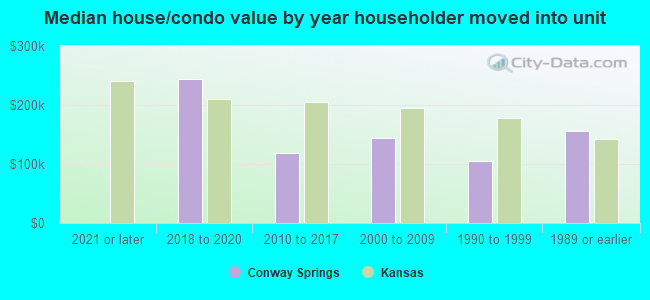
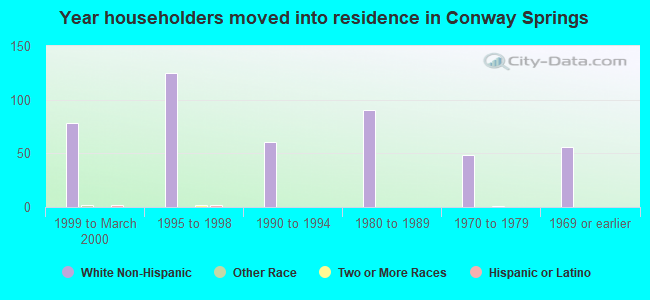
House/condo owner moved in on average 8 years ago
Renter moved in on average 5 years ago
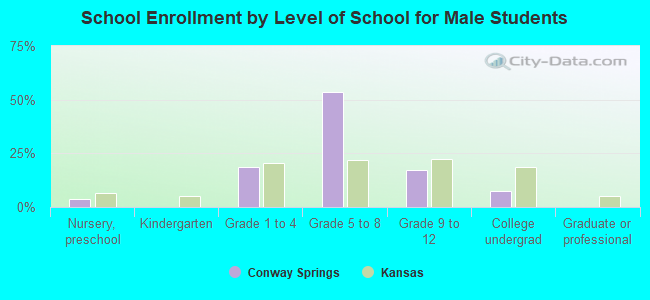
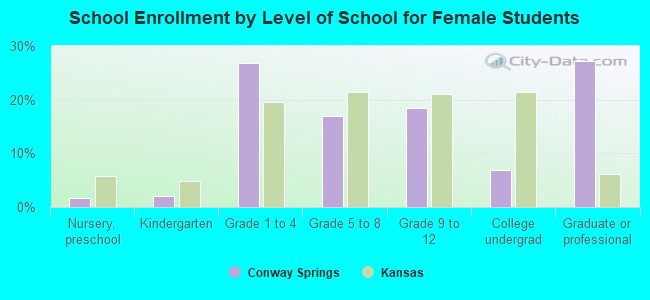
Private vs. public school enrollment:
| Here: | 56.6% |
| Kansas: | 14.1% |
| Here: | 4.5% |
| Kansas: | 10.8% |
| Here: | 22.9% |
| Kansas: | 15.4% |