Copiague, NY (New York) Houses and Residents
Estimated median house or condo value in 2022: $478,766 (it was $154,600 in 2000 )
Copiague:
$478,766New York:
$400,400
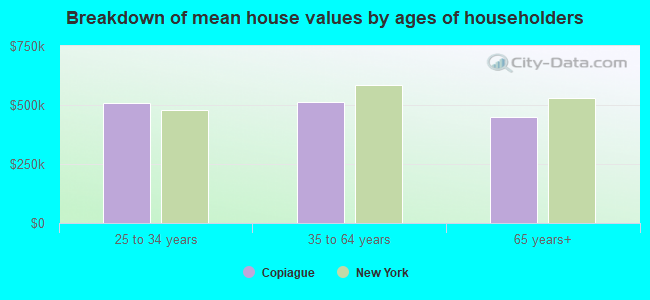
Lower value quartile - upper value quartile: $365,691 - $533,189Mean price in 2022: Detached houses: $508,559 Here:
$508,559State:
$476,719
Townhouses or other attached units: $381,970 Here:
$381,970State:
$699,270
In 2-unit structures: $273,819 Here:
$273,819State:
$713,077
In 3-to-4-unit structures: $272,341 Here:
$272,341State:
$764,568
In 5-or-more-unit structures: $313,271 Here:
$313,271State:
$912,009
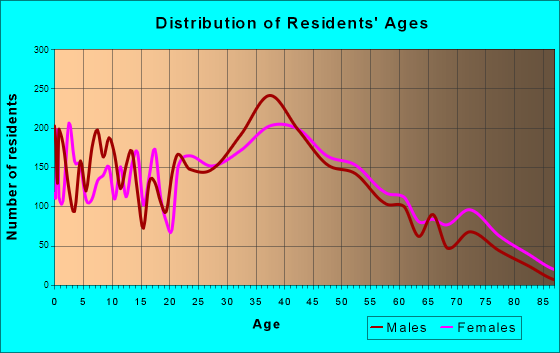
Total population: 22,993 (Urban population: 21,922, Rural population: 0)
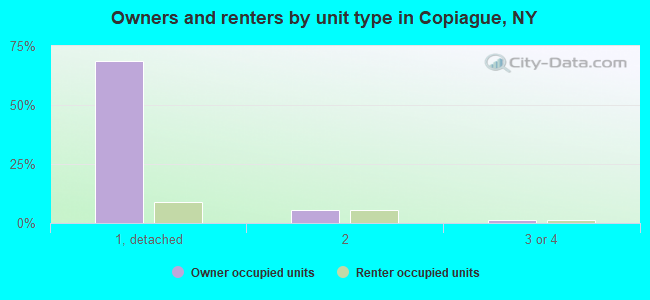
Houses: 7,526 (7,104 occupied: 5,611 owner occupied, 1,490 renter occupied )
% of renters here:
21%State:
46%
Housing density: 2,359 houses/condos per square mile
Median price asked for vacant for-sale houses and condos in 2022: $620,062.
Median contract rent in 2022: $1,900 (lower quartile is $1,305, upper quartile is over $2,000)
Median rent asked for vacant for-rent units in 2022: $5,464
Median gross rent in Copiague, NY in 2022: $1,998
Housing units in Copiague with a mortgage: 3,766 (430 second mortgage, 20 home equity loan, 251 both second mortgage and home equity loan )Houses without a mortgage: 128
Median household income for houses/condos with a mortgage: $124,757
Median household income for apartments without a mortgage: $113,532
Median monthly housing costs: $2,190
Data:
Median house or condo value ($)
Median house or condo value ($ change since 2000)
Median house or condo value ($) - White
Median house or condo value ($) - Black or African American
Median house or condo value ($) - Asian
Median house or condo value ($) - Hispanic or Latino
Median house or condo value ($) - American Indian and Alaska Native
Median house or condo value ($) - Multirace
Median house or condo value ($) - Other Race
Median price asked for mobile homes ($)
Household density (households per square mile)
Mean house or condo value by units in structure - 1, detached ($)
Mean house or condo value by units in structure - 1, attached ($)
Mean house or condo value by units in structure - 2 ($)
Mean house or condo value by units in structure by units in structure - 3 or 4 ($)
Mean house or condo value by units in structure - 5 or more ($)
Mean house or condo value by units in structure - Boat, RV, van, etc. ($)
Mean house or condo value by units in structure - Mobile home ($)
Median contract rent ($)
Median contract rent - Lower quartile ($)
Median contract rent - Upper quartile ($)
Median gross rent ($)
Urban houses (%)
Rural houses (%)
Houses occupied (%)
Houses occupied (% change since 2000)
Houses owner occupied (%)
Houses owner occupied (% change since 2000)
Houses renter occupied (%)
Houses renter occupied (% change since 2000)
Vacant housing units - For rent (%)
Vacant housing units - For rent (% change since 2000)
Vacant housing units - For sale only (%)
Vacant housing units - For sale only (% change since 2000)
Vacant housing units - Rented or sold, not occupied (%)
Vacant housing units - Rented or sold, not occupied (% change since 2000)
Vacant housing units - For seasonal, recreational, or occasional use (%)
Vacant housing units - For seasonal, recreational, or occasional use (% change since 2000)
Vacant housing units - For migrant workers (%)
Vacant housing units - For migrant workers (% change since 2000)
Vacant housing units - Other vacant (%)
Vacant housing units - Other vacant (% change since 2000)
Median monthly housing costs ($)
Median household income for houses/condos with a mortgage ($)
Median household income for houses/condos without a mortgage ($)
Median household income ($)
Median household income ($) - White
Median household income ($) - Black or African American
Median household income ($) - Asian
Median household income ($) - Hispanic or Latino
Median household income ($) - American Indian and Alaska Native
Median household income ($) - Multirace
Median household income ($) - Other Race
Mortgage status - with mortgage (%)
Mortgage status - with second mortgage (%)
Mortgage status - with home equity loan (%)
Mortgage status - with both second mortgage and home equity loan (%)
Mortgage status - without a mortgage (%)
Median year house/condo built
Median year apartment built
Household type by relationship - Male householder living alone (%)
Household type by relationship - Male householder not living alone (%)
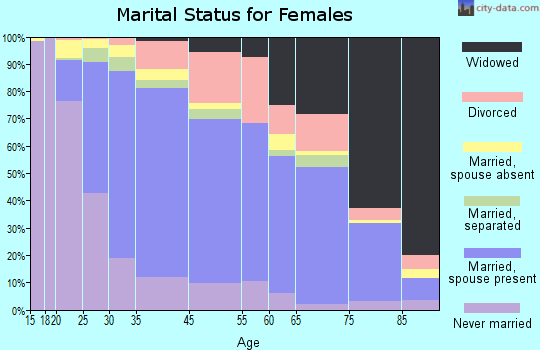
Household type by relationship - Female householder living alone (%)
Household type by relationship - Female householder not living alone (%)
Household type by relationship - Opposite-Sex spouse (%)
Household type by relationship - Same-Sex spouse (%)
Household type by relationship - Opposite-Sex unmarried partner (%)
Household type by relationship - Same-Sex unmarried partner (%)
Household type by relationship - In group quarters (%)
Size of family households - 2-person household (%)
Size of family households - 3-person household (%)
Size of family households - 4-person household (%)
Size of family households - 5-person household (%)
Size of family households - 6-person household (%)
Size of family households - 7-or-more-person household (%)
Size of nonfamily households - 1-person household (%)
Size of nonfamily households - 2-person household (%)
Size of nonfamily households - 3-person household (%)
Size of nonfamily households - 4-person household (%)
Size of nonfamily households - 5-person household (%)
Size of nonfamily households - 6-person household (%)
Size of nonfamily households - 7-or-moreperson household (%)
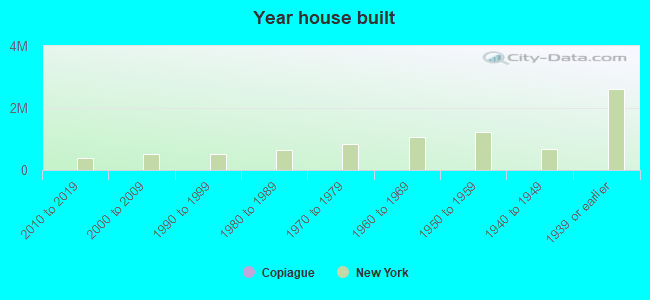
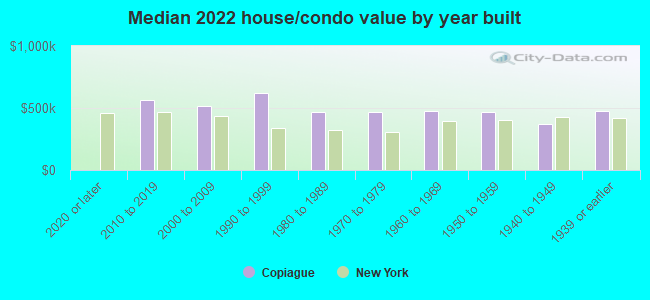
Year house built - Built 2010 or later (%)
Year house built - Built 2000 to 2009 (%)
Year house built - Built 1990 to 1999 (%)
Year house built - Built 1980 to 1989 (%)
Year house built - Built 1970 to 1979 (%)
Year house built - Built 1960 to 1969 (%)
Year house built - Built 1950 to 1959 (%)
Year house built - Built 1940 to 1949 (%)
Year house built - Built 1939 or earlier (%)
Median number of rooms in houses and condos
Median number of rooms in apartments
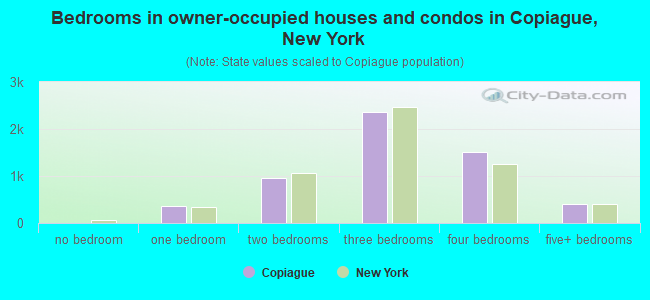
Median number of bedrooms in owner occupied houses
Mean number of bedrooms in owner occupied houses
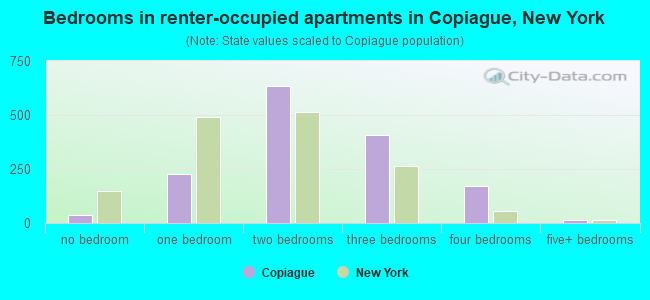
Median number of bedrooms in renter occupied houses
Mean number of bedrooms in renter occupied houses
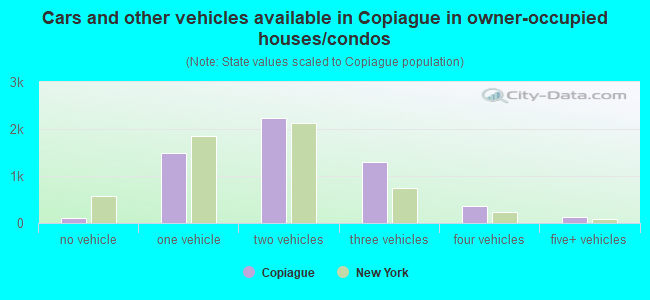
Median number of vehichles in owner occupied houses
Mean number of vehichles in owner occupied houses
Median number of vehichles in renter occupied houses
Mean number of vehichles in renter occupied houses
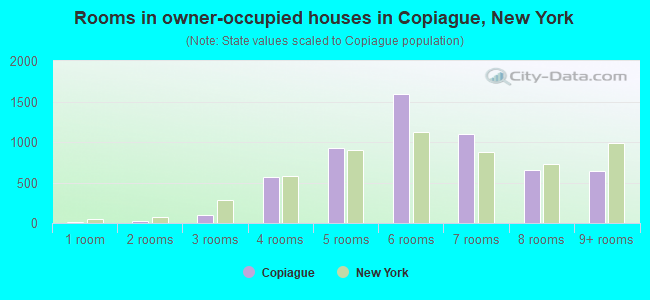
Rooms in owner-occupied houses - 1 room (%)
Rooms in owner-occupied houses - 2 rooms (%)
Rooms in owner-occupied houses - 3 rooms (%)
Rooms in owner-occupied houses - 4 rooms (%)
Rooms in owner-occupied houses - 5 rooms (%)
Rooms in owner-occupied houses - 6 rooms (%)
Rooms in owner-occupied houses - 7 rooms (%)
Rooms in owner-occupied houses - 8 rooms (%)
Rooms in owner-occupied houses - 9+ rooms (%)
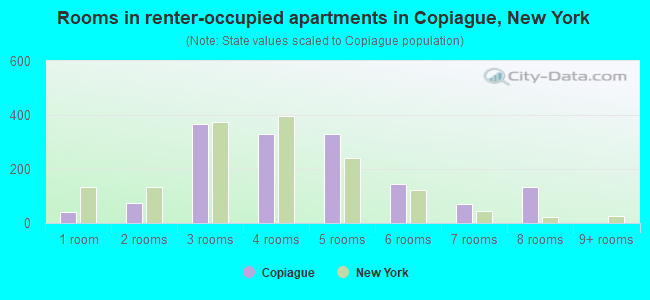
Rooms in renter-occupied houses - 1 room (%)
Rooms in renter-occupied houses - 2 rooms (%)
Rooms in renter-occupied houses - 3 rooms (%)
Rooms in renter-occupied houses - 4 rooms (%)
Rooms in renter-occupied houses - 5 rooms (%)
Rooms in renter-occupied houses - 6 rooms (%)
Rooms in renter-occupied houses - 7 rooms (%)
Rooms in renter-occupied houses - 8 rooms (%)
Rooms in renter-occupied houses - 9+ rooms (%)
Bedrooms in owner-occupied houses - no bedrooms (%)
Bedrooms in owner-occupied houses - 1 bedroom (%)
Bedrooms in owner-occupied houses - 2 bedrooms (%)
Bedrooms in owner-occupied houses - 3 bedrooms (%)
Bedrooms in owner-occupied houses - 4 bedrooms (%)
Bedrooms in owner-occupied houses - 5+ bedrooms (%)
Bedrooms in renter-occupied houses - no bedrooms (%)
Bedrooms in renter-occupied houses - 1 bedroom (%)
Bedrooms in renter-occupied houses - 2 bedrooms (%)
Bedrooms in renter-occupied houses - 3 bedrooms (%)
Bedrooms in renter-occupied houses - 4 bedrooms (%)
Bedrooms in renter-occupied houses - 5+ bedrooms (%)
Vehicles available in owner-occupied houses - no vehicle available (%)
Vehicles available in owner-occupied houses - 1 vehicle available(%)
Vehicles available in owner-occupied houses - 2 Vehicles available (%)
Vehicles available in owner-occupied houses - 3 Vehicles available (%)
Vehicles available in owner-occupied houses - 4 Vehicles available (%)
Vehicles available in owner-occupied houses - 5+ Vehicles available (%)
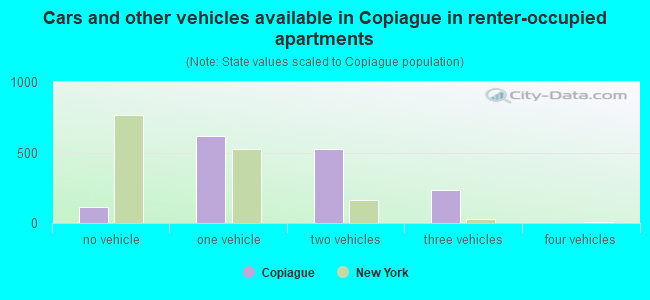
Vehicles available in renter-occupied houses - no vehicle available (%)
Vehicles available in renter-occupied houses - 1 vehicle available (%)
Vehicles available in renter-occupied houses - 2 Vehicles available (%)
Vehicles available in renter-occupied houses - 3 Vehicles available (%)
Vehicles available in renter-occupied houses - 4 Vehicles available (%)
Vehicles available in renter-occupied houses - 5+ Vehicles available (%)
Housing units in structures - 1, detached (%)
Housing units in structures - 1, attached (%)
Housing units in structures - 2 (%)
Housing units in structures - 3 or 4 (%)
Housing units in structures - 5 to 9 (%)
Housing units in structures - 10 to 19 (%)
Housing units in structures - 20 to 49 (%)
Housing units in structures - 50 or more (%)
Housing units in structures - Mobile home (%)
Housing units in structures - Boat, RV, van, etc. (%)
Housing units in structures - Owners - 1, detached (%)
Housing units in structures - Owners - 1, attached (%)
Housing units in structures - Owners - 2 (%)
Housing units in structures - Owners - 3 or 4 (%)
Housing units in structures - Owners - 5 to 9 (%)
Housing units in structures - Owners - 10 to 19 (%)
Housing units in structures - Owners - 20 to 49 (%)
Housing units in structures - Owners - 50 or more (%)
Housing units in structures - Owners - Mobile home (%)
Housing units in structures - Owners - Boat, RV, van, etc. (%)
Housing units in structures - Renters - 1, detached (%)
Housing units in structures - Renters - 1, attached (%)
Housing units in structures - Renters - 2 (%)
Housing units in structures - Renters - 3 or 4 (%)
Housing units in structures - Renters - 5 to 9 (%)
Housing units in structures - Renters - 10 to 19 (%)
Housing units in structures - Renters - 20 to 49 (%)
Housing units in structures - Renters - 50 or more (%)
Housing units in structures - Renters - Mobile home (%)
Housing units in structures - Renters - Boat, RV, van, etc. (%)
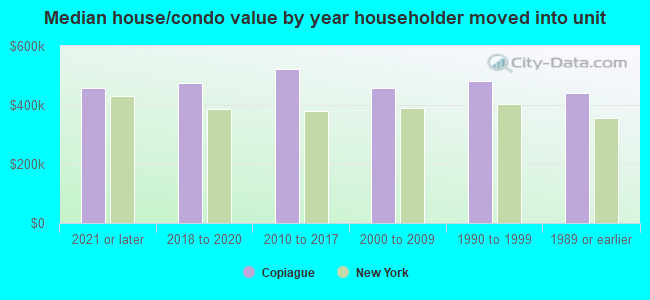
House/condo owner moved in on average (years ago)
Renter moved in on average (years ago)
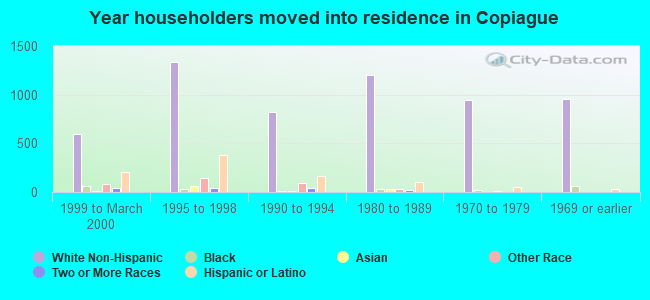
Year householder moved into unit - Moved in 1999 to March 2000 (%)
Year householder moved into unit - Moved in 1999 to March 2000 (%) - White
Year householder moved into unit - Moved in 1999 to March 2000 (%) - Black or African American
Year householder moved into unit - Moved in 1999 to March 2000 (%) - Asian
Year householder moved into unit - Moved in 1999 to March 2000 (%) - Hispanic or Latino
Year householder moved into unit - Moved in 1999 to March 2000 (%) - American Indian and Alaska Native
Year householder moved into unit - Moved in 1999 to March 2000 (%) - Multirace
Year householder moved into unit - Moved in 1999 to March 2000 (%) - Other Race
Year householder moved into unit - Moved in 1995 to 1998 (%)
Year householder moved into unit - Moved in 1995 to 1998 (%) - White
Year householder moved into unit - Moved in 1995 to 1998 (%) - Black or African American
Year householder moved into unit - Moved in 1995 to 1998 (%) - Asian
Year householder moved into unit - Moved in 1995 to 1998 (%) - Hispanic or Latino
Year householder moved into unit - Moved in 1995 to 1998 (%) - American Indian and Alaska Native
Year householder moved into unit - Moved in 1995 to 1998 (%) - Multirace
Year householder moved into unit - Moved in 1995 to 1998 (%) - Other Race
Year householder moved into unit - Moved in 1990 to 1994 (%)
Year householder moved into unit - Moved in 1990 to 1994 (%) - White
Year householder moved into unit - Moved in 1990 to 1994 (%) - Black or African American
Year householder moved into unit - Moved in 1990 to 1994 (%) - Asian
Year householder moved into unit - Moved in 1990 to 1994 (%) - Hispanic or Latino
Year householder moved into unit - Moved in 1990 to 1994 (%) - American Indian and Alaska Native
Year householder moved into unit - Moved in 1990 to 1994 (%) - Multirace
Year householder moved into unit - Moved in 1990 to 1994 (%) - Other Race
Year householder moved into unit - Moved in 1980 to 1989 (%)
Year householder moved into unit - Moved in 1980 to 1989 (%) - White
Year householder moved into unit - Moved in 1980 to 1989 (%) - Black or African American
Year householder moved into unit - Moved in 1980 to 1989 (%) - Asian
Year householder moved into unit - Moved in 1980 to 1989 (%) - Hispanic or Latino
Year householder moved into unit - Moved in 1980 to 1989 (%) - American Indian and Alaska Native
Year householder moved into unit - Moved in 1980 to 1989 (%) - Multirace
Year householder moved into unit - Moved in 1980 to 1989 (%) - Other Race
Year householder moved into unit - Moved in 1970 to 1979 (%)
Year householder moved into unit - Moved in 1970 to 1979 (%) - White
Year householder moved into unit - Moved in 1970 to 1979 (%) - Black or African American
Year householder moved into unit - Moved in 1970 to 1979 (%) - Asian
Year householder moved into unit - Moved in 1970 to 1979 (%) - Hispanic or Latino
Year householder moved into unit - Moved in 1970 to 1979 (%) - American Indian and Alaska Native
Year householder moved into unit - Moved in 1970 to 1979 (%) - Multirace
Year householder moved into unit - Moved in 1970 to 1979 (%) - Other Race
Year householder moved into unit - Moved in 1969 or earlier (%)
Year householder moved into unit - Moved in 1969 or earlier (%) - White
Year householder moved into unit - Moved in 1969 or earlier (%) - Black or African American
Year householder moved into unit - Moved in 1969 or earlier (%) - Asian
Year householder moved into unit - Moved in 1969 or earlier (%) - Hispanic or Latino
Year householder moved into unit - Moved in 1969 or earlier (%) - American Indian and Alaska Native
Year householder moved into unit - Moved in 1969 or earlier (%) - Multirace
Year householder moved into unit - Moved in 1969 or earlier (%) - Other Race
Housing units lacking complete plumbing facilities (%)
Housing units lacking complete kitchen facilities (%)
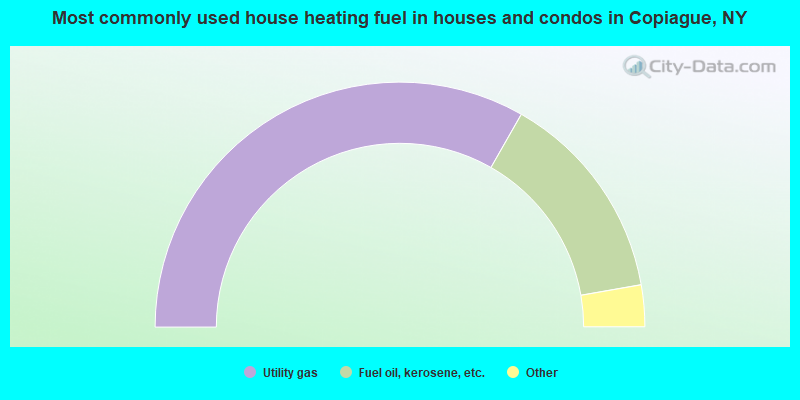
House heating fuel used in houses and condos - Utility gas (%)
House heating fuel used in houses and condos - Bottled, tank, or LP gas (%)
House heating fuel used in houses and condos - Electricity (%)
House heating fuel used in houses and condos - Fuel oil, kerosene, etc. (%)
House heating fuel used in houses and condos - Coal or coke (%)
House heating fuel used in houses and condos - Wood (%)
House heating fuel used in houses and condos - Solar energy (%)
House heating fuel used in houses and condos - Other fuel (%)
House heating fuel used in houses and condos - No fuel used (%)
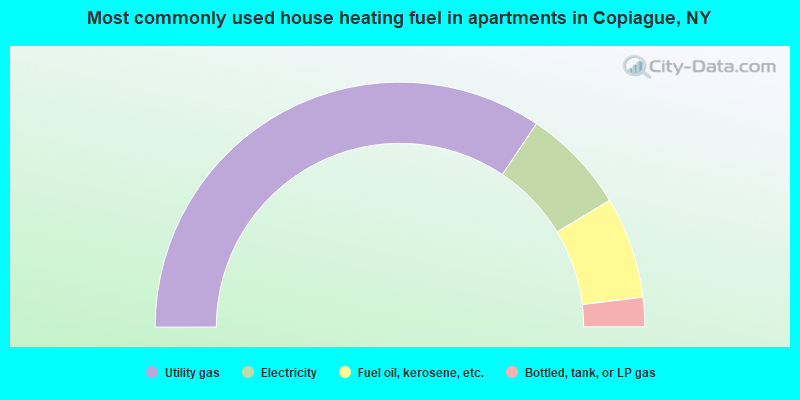
House heating fuel used in apartments - Utility gas (%)
House heating fuel used in apartments - Bottled, tank, or LP gas (%)
House heating fuel used in apartments - Electricity (%)
House heating fuel used in apartments - Fuel oil, kerosene, etc. (%)
House heating fuel used in apartments - Coal or coke (%)
House heating fuel used in apartments - Wood (%)
House heating fuel used in apartments - Solar energy (%)
House heating fuel used in apartments - Other fuel (%)
House heating fuel used in apartments - No fuel used (%)
Latest news about housing in Copiague, NY collected exclusively by city-data.com from local newspapers, TV, and radio stations
Median year house/condo built: 1961Median year apartment built: 1972Household type by relationship:
Households: 23,457
Male householders: 3,660 (564 living alone ), Female householders: 3,428 (675 living alone )3,552 spouses (3,541 opposite-sex spouses ), 575 unmarried partners , (549 opposite-sex unmarried partners ), 7,025 children (6,806 natural , 23 adopted , 196 stepchildren ), 726 grandchildren , 327 brothers or sisters , 624 parents , 0 foster children , 908 other relatives , 2,562 non-relatives In group quarters: 66
Size of family households: 1,713 2-persons , 1,286 3-persons , 1,226 4-persons , 308 5-persons , 507 6-persons , 232 7-or-more-persons .
Size of nonfamily households: 1,249 1-person , 426 2-persons , 42 3-persons , 28 4-persons , 89 6-persons .
2,251 married couples with children. single-parent households (715 men , 707 women ).
54.7% of residents of Copiague speak English at home. of residents speak Spanish at home (48% speak English very well , 28% speak English well , 18% speak English not well , 6% don't speak English at all ).of residents speak other Indo-European language at home (56% speak English very well , 23% speak English well , 10% speak English not well , 10% don't speak English at all ).of residents speak Asian or Pacific Island language at home (44% speak English very well , 46% speak English well , 8% speak English not well , 2% don't speak English at all ).
Foreign born population: 7,316 (31.2%)of them are naturalized citizens )
Median number of rooms in houses and condos:
Median number of rooms in apartments
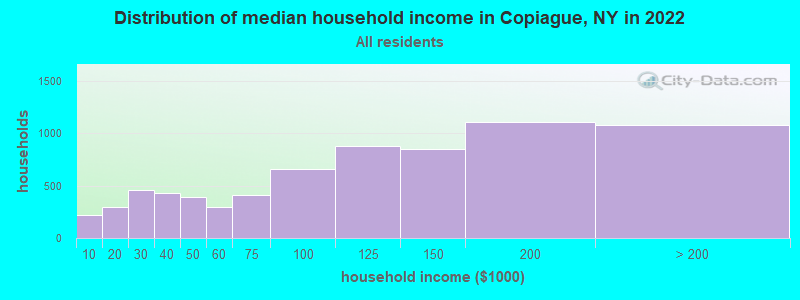
Copiague, NY household income distribution 222 Less than $10,000297 $10,000 to $19,999456 $20,000 to $29,999434 $30,000 to $39,999389 $40,000 to $49,999299 $50,000 to $59,999406 $60,000 to $74,999661 $75,000 to $99,999876 $100,000 to $124,999848 $125,000 to $149,9991,107 $150,000 to $199,9991,074 $200,000 or more
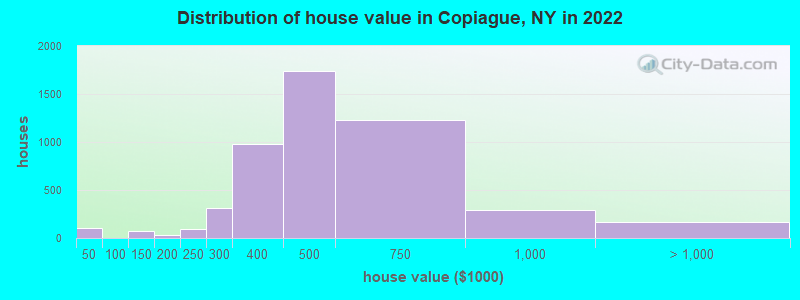
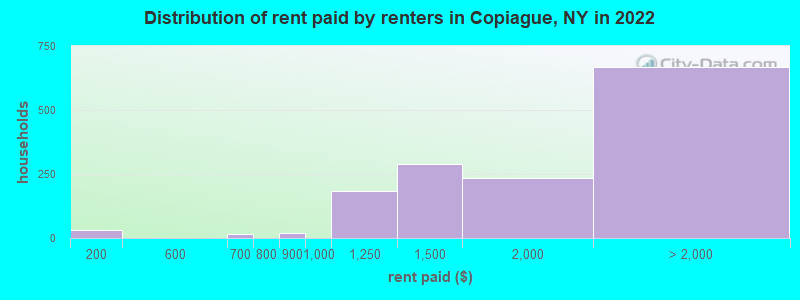
Home value of owner - occupied houses in 2022 in Copiague, NY 16 Less than $10,00011 $30,000 to $34,99975 $35,000 to $39,99927 $100,000 to $124,99951 $125,000 to $149,99918 $150,000 to $174,99911 $175,000 to $199,99992 $200,000 to $249,999310 $250,000 to $299,999974 $300,000 to $399,9991,741 $400,000 to $499,9991,231 $500,000 to $749,999292 $750,000 to $999,99973 $1,000,000 to $1,499,99955 $1,500,000 to $1,999,99939 $2,000,000 or moreRent paid by renters in 2022 in Copiague, NY 31 $100 to $14914 $650 to $69919 $800 to $899184 $1,000 to $1,249290 $1,250 to $1,499232 $1,500 to $1,999443 $2,000 to $2,49927 $2,500 to $2,999120 $3,000 to $3,49976 No cash rent
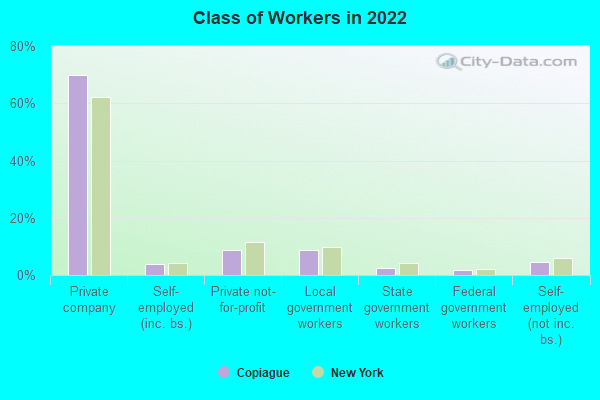
Percentage of workers working in this county: 63.4%Number of people working at home: 1,006 (8.5% of all workers )
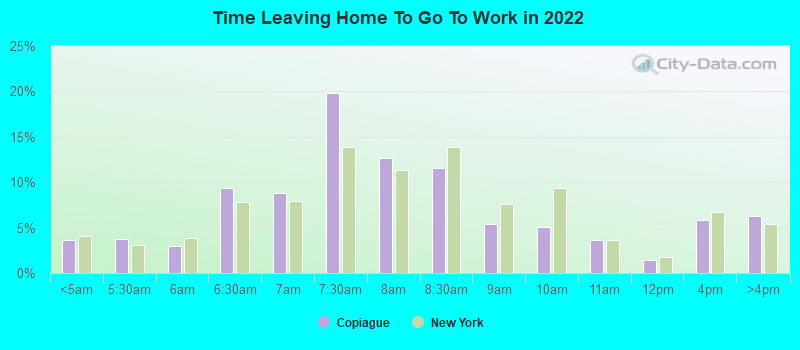
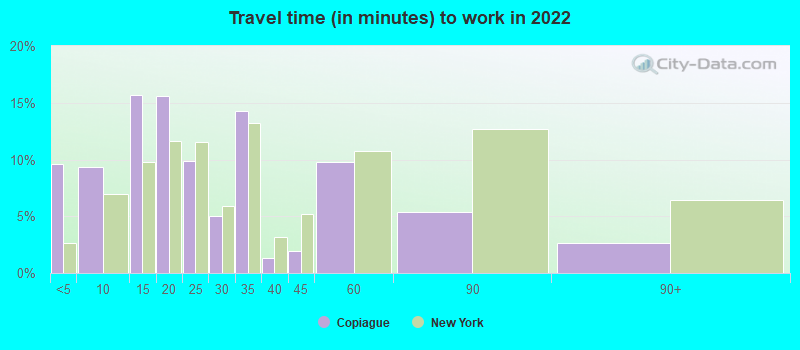
Travel time to work (commute)
Less than 5 minutes: 6215 to 9 minutes: 91310 to 14 minutes: 1,10915 to 19 minutes: 1,22920 to 24 minutes: 1,78325 to 29 minutes: 42430 to 34 minutes: 1,33535 to 39 minutes: 29540 to 44 minutes: 63845 to 59 minutes: 73460 to 89 minutes: 1,03190 or more minutes: 710
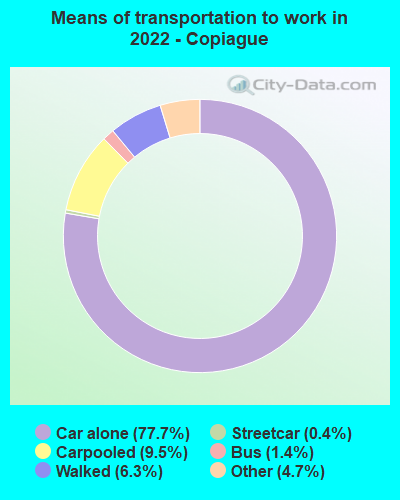
Means of transportation to work:
Drove a car alone: 2,874 (61.5%)Carpooled: 403 (8.6%)Bus : 46 (1.0%)Subway or elevated rail : 16 (0.3%)Taxi: 215 (4.6%)Walked: 247 (5.3%)Worked at home: 1,006 (21.5%)
Unemployment by race in 2022
Unemployment rate for White non-Hispanic residents 3.8% Males3.6% FemalesUnemployment rate for Black residents 2.3% MalesUnemployment rate for American Indian and Alaska Native residents 2.6% MalesUnemployment rate for other race residents 0.9% Males10.9% FemalesUnemployment rate for two or more race residents 3.2% Males16.4% FemalesUnemployment rate for Hispanic or Latino residents 0.9% Males12.8% Females
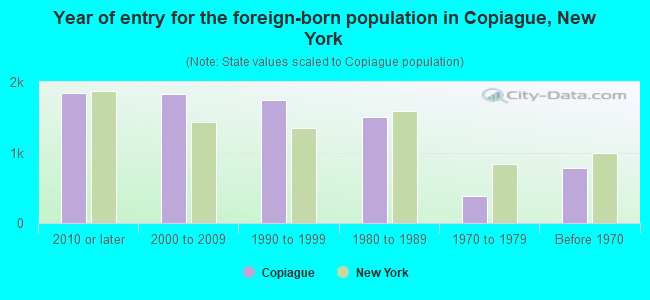
Year of entry for the foreign-born population in Copiague, New York
1,845 2010 or later 1,829 2000 to 2009 1,741 1990 to 1999 1,503 1980 to 1989 376 1970 to 1979 784 Before 1970
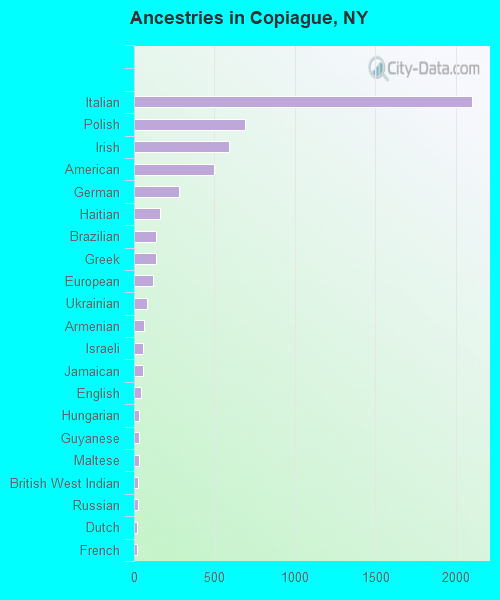
First ancestries reported:
Italian: 2,101 (17.5%)
Polish: 690 (5.8%)
Irish: 592 (4.9%)
American: 498 (4.2%)
German: 282 (2.4%)
Haitian: 162 (1.4%)
Brazilian: 136 (1.1%)
Greek: 136 (1.1%)
European: 115 (1.0%)
Ukrainian: 81 (0.7%)
Armenian: 60 (0.5%)
Israeli: 54 (0.5%)
Jamaican: 54 (0.5%)
English: 45 (0.4%)
Hungarian: 34 (0.3%)
Guyanese: 31 (0.3%)
Maltese: 28 (0.2%)
British West Indian: 27 (0.2%)
Russian: 24 (0.2%)
Dutch: 20 (0.2%)
French: 20 (0.2%)
Scotch-Irish: 18 (0.2%)
West Indian: 17 (0.1%)
Trinidadian and Tobagonian: 16 (0.1%)
Welsh: 15 (0.1%)
Lithuanian: 11 (0.09%)
Finnish: 9 (0.08%)
Norwegian: 8 (0.07%)
Northern European: 6 (0.05%)
Czech: 5 (0.04%)
Scottish: 5 (0.04%) Most common places of birth for foreign-born residents (%): Dominican Republic Copiague:
31.5% (2,124)New York:
11.1% (501,040)
El Salvador Copiague:
18.9% (1,276)New York:
2.4% (108,067)
Poland Copiague:
7.9% (536)New York:
1.4% (65,102)
Mexico Copiague:
5.4% (367)New York:
4.8% (214,559)
Colombia Copiague:
4.6% (310)New York:
2.5% (111,920)
Ecuador Copiague:
3.5% (235)New York:
3.9% (177,448)
Honduras Copiague:
2.9% (197)New York:
1.2% (55,571)
Ukraine Copiague:
2.8% (189)New York:
1.7% (78,421)
Brazil Copiague:
2.1% (141)New York:
0.7% (30,658)
Haiti Copiague:
1.8% (124)New York:
2.8% (126,936)
Guyana Copiague:
1.8% (122)New York:
3.8% (172,129)
Italy Copiague:
1.6% (105)New York:
1.8% (81,374)
Place of birth for U.S.-born residents:
This state: 15,069Other state: 899Northeast: 411Midwest: 204South: 159West: 137 92.3% of Copiague residents lived in the same house 1 years ago.
Out of people who lived in different houses, 37.0% lived in this county.
Out of people who lived in different counties, 95.2% lived in New York.
Copiague:
92.3%State average:
89.6%
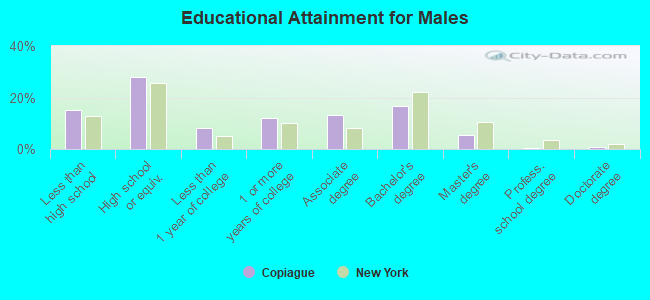
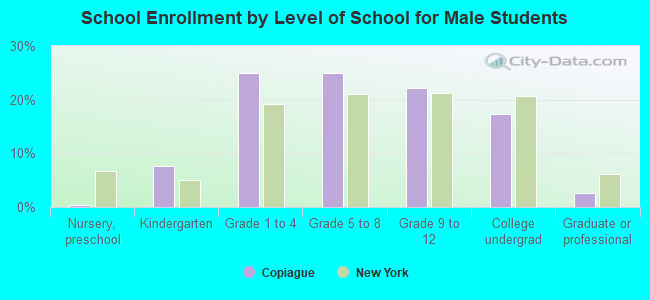
Education attainment for males 25 years and older:
No schooling: 193Nursery to 4th grade: 465th and 6th grade: 1487th and 8th grade: 139th grade: 6010th grade: 15311th grade: 17612th grade, no diploma: 400High school graduate (or equivalency): 2,207Less than 1 year of college: 632Some college more than 1 year, no degree: 936Associate degree: 1,029Bachelor's degree: 1,316Master's degree: 431Professional school degree: 44Doctorate degree: 70
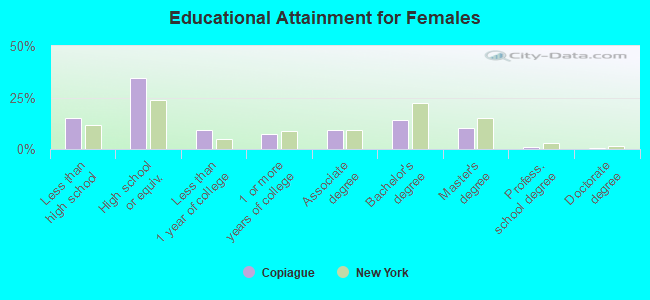
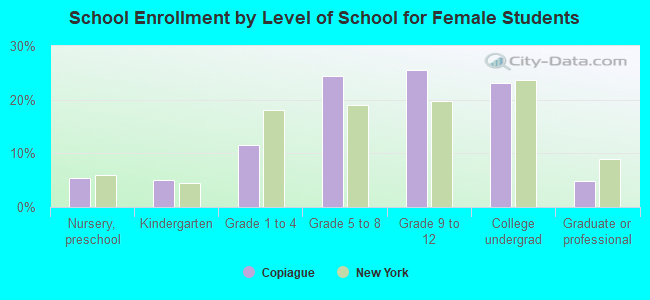
Education attainment for females 25 years and older:
No schooling: 180Nursery to 4th grade: 555th and 6th grade: 927th and 8th grade: 679th grade: 10310th grade: 16211th grade: 19612th grade, no diploma: 378High school graduate (or equivalency): 2,824Less than 1 year of college: 745Some college more than 1 year, no degree: 585Associate degree: 741Bachelor's degree: 1,158Master's degree: 819Professional school degree: 60Doctorate degree: 50
Housing units in structures:
One, detached: 5,842One, attached: 251Two: 8143 or 4: 1435 to 9: 14910 to 19: 10320 to 49: 6250 or more: 159Housing units lacking complete plumbing facilities in 2022: 0.1%Housing units lacking complete kitchen facilities in 2022: 0.1%House/condo owner moved in on average 14 years ago
Renter moved in on average 4 years ago
Private vs. public school enrollment:
Students in private schools in grades 1 to 8 (elementary and middle school): 300 Students in private schools in grades 9 to 12 (high school): 328 Students in private undergraduate colleges: 289