Copper Canyon, TX (Texas) Houses and Residents
| Copper Canyon: | $788,279 |
| Texas: | $275,400 |
Mean price in 2022:
Detached houses: $1,098,603
Here: $1,098,603 State: $369,058 Townhouses or other attached units: $1,575,071
Here: $1,575,071 State: $327,631
Total population: 1,418 (Urban population: 503, Rural population: 703 (22 farm, 681 nonfarm))
Houses: 896 (862 occupied: 836 owner occupied, 34 renter occupied)
| % of renters here: | 4% |
| State: | 38% |
Housing density: 201 houses/condos per square mile
Median price asked for vacant for-sale houses and condos in 2022: $652,046.
Median contract rent in 2022: $1,556 (lower quartile is $1,347, upper quartile is over $2,000)
Median gross rent in Copper Canyon, TX in 2022: over $2,000
Housing units in Copper Canyon with a mortgage: 467 (40 second mortgage, 0 home equity loan, 27 both second mortgage and home equity loan)
Houses without a mortgage: 4
Median household income for houses/condos with a mortgage: $178,886
Median household income for apartments without a mortgage: $123,491
Median monthly housing costs: $2,416
Compare current foreclosures near Copper Canyon, TX:
| Photo | Address | Area | Beds / Baths | Price | Details |
|---|---|---|---|---|---|

|
#1
Demarsh Lane
Denton, TX 76210
|
3,576 sq. feet
|
3 baths 4 beds |
$589,900
|
show details |

|
#2
N Horseshoe Trl
The Colony, TX 75056
|
700 sq. feet
|
1 baths 1 beds |
show details | |

|
#3
King George Ln
Aubrey, TX 76227
|
2,095 sq. feet
|
3 baths 3 beds |
show details | |

|
#4
Ringtail Dr
Little Elm, TX 75068
|
2,841 sq. feet
|
3 baths 4 beds |
show details | |

|
#5
Sundrop Drive
Little Elm, TX 75068
|
- sq. feet
|
3 baths 4 beds |
show details | |

|
#6
College St S
Keller, TX 76248
|
1,919 sq. feet
|
2 baths 4 beds |
show details | |

|
#7
Bissonet Dr
Denton, TX 76210
|
2,518 sq. feet
|
2 baths 3 beds |
show details | |

|
#8
Collins St
Argyle, TX 76226
|
- sq. feet
|
2 baths 3 beds |
show details | |

|
#9
Lamp Post Dr
Little Elm, TX 75068
|
1,480 sq. feet
|
2 baths 3 beds |
show details | |

|
#10
Wooddale
Euless, TX 76039
|
1,899 sq. feet
|
2 baths 3 beds |
show details |
| Photo | Address | Area | Beds / Baths | Price | Details |
|---|---|---|---|---|---|

|
#11
Sir Lancelot Cir
The Colony, TX 75056
|
3,326 sq. feet
|
3 baths 4 beds |
show details | |

|
#12
Degnen Ln
Aubrey, TX 76227
|
1,971 sq. feet
|
2 baths 3 beds |
show details | |

|
#13
Balcones Drive
Carrollton, TX 75010
|
2,980 sq. feet
|
2 baths 3 beds |
show details | |

|
#14
E Hickory Hill Rd
Argyle, TX 76226
|
4,753 sq. feet
|
6 baths 7 beds |
show details | |

|
#15
Hilcroft Ave
Denton, TX 76210
|
2,196 sq. feet
|
2 baths 3 beds |
show details | |

|
#16
Highland Dr
Colleyville, TX 76034
|
3,298 sq. feet
|
3 baths 4 beds |
show details | |

|
#17
Normandy Dr
Frisco, TX 75034
|
4,644 sq. feet
|
5 baths 4 beds |
show details | |

|
#18
Ashley Dr
Coppell, TX 75019
|
1,854 sq. feet
|
2 baths 3 beds |
show details | |

|
#19
Harbinger Ln
Dallas, TX 75287
|
1,148 sq. feet
|
1 baths 2 beds |
show details | |

|
#20
Bursey Rd
North Richland Hills, TX 76182
|
2,696 sq. feet
|
3 baths 4 beds |
show details |
| Photo | Address | Area | Beds / Baths | Price | Details |
|---|---|---|---|---|---|

|
#21
Evergreen Dr
Keller, TX 76244
|
2,144 sq. feet
|
2 baths 3 beds |
show details | |

|
#22
Cherry Ridge Dr
Frisco, TX 75033
|
2,811 sq. feet
|
2 baths 3 beds |
show details | |

|
#23
Robin Way
Justin, TX 76247
|
2,671 sq. feet
|
3 baths 4 beds |
show details | |

|
#24
Catoosa Ln
Denton, TX 76210
|
3,404 sq. feet
|
3 baths 5 beds |
show details | |

|
#25
Bursey Rd
North Richland Hills, TX 76182
|
3,700 sq. feet
|
2 baths 3 beds |
show details | |

|
#26
Ramada Trl
Justin, TX 76247
|
2,609 sq. feet
|
2 baths 4 beds |
show details | |

|
#27
Noble Way
Flower Mound, TX 75022
|
4,744 sq. feet
|
4 baths 4 beds |
show details | |

|
#28
Southwood Ct
Grapevine, TX 76051
|
3,206 sq. feet
|
3 baths 4 beds |
show details | |

|
#29
Marble Canyon Dr
Little Elm, TX 75068
|
2,013 sq. feet
|
2 baths 3 beds |
show details | |

|
#30
River Meadows Ln
Argyle, TX 76226
|
3,212 sq. feet
|
3 baths 3 beds |
show details |
| Photo | Address | Area | Beds / Baths | Price | Details |
|---|---|---|---|---|---|

|
#31
Harney Dr
Keller, TX 76244
|
2,027 sq. feet
|
2 baths 4 beds |
show details | |

|
#32
Peppercorn Dr
Euless, TX 76039
|
2,552 sq. feet
|
2 baths 3 beds |
show details | |

|
#33
Renmuir Drive
Prosper, TX 75078
|
- sq. feet
|
4 baths 5 beds |
show details | |

|
#34
Beaver Creek Ave
Denton, TX 76207
|
- sq. feet
|
2 baths 3 beds |
show details | |

|
#35
Windsor Rd
Coppell, TX 75019
|
3,739 sq. feet
|
3 baths 4 beds |
show details | |

|
#36
Sunswept Ter
Lewisville, TX 75077
|
3,018 sq. feet
|
3 baths 4 beds |
show details | |

|
#37
Sarah Brooks Dr
Keller, TX 76248
|
2,360 sq. feet
|
2 baths 4 beds |
show details | |

|
#38
Brazos Dr
Carrollton, TX 75007
|
- sq. feet
|
2 baths 3 beds |
show details | |

|
#39
Beaver Creek Avenue
Denton, TX 76207
|
1,738 sq. feet
|
2 baths 3 beds |
show details | |

|
#40
Sueca Dr
Little Elm, TX 75068
|
2,035 sq. feet
|
2 baths 4 beds |
show details |
| Photo | Address | Area | Beds / Baths | Price | Details |
|---|---|---|---|---|---|

|
#41
Meandering Creek Drive
Argyle, TX 76226
|
2,838 sq. feet
|
3 baths 4 beds |
show details | |

|
#42
Knox Rd
Roanoke, TX 76262
|
1,978 sq. feet
|
2 baths 3 beds |
show details | |

|
#43
Daybreak Dr
Dallas, TX 75287
|
1,470 sq. feet
|
2 baths 3 beds |
show details | |

|
#44
Preston On The Lake Blvd
Little Elm, TX 75068
|
1,840 sq. feet
|
2 baths 3 beds |
show details | |

|
#45
Wheatear Dr
Little Elm, TX 75068
|
2,980 sq. feet
|
2 baths 4 beds |
show details | |

|
#46
Silverwood Ln
Little Elm, TX 75068
|
3,440 sq. feet
|
3 baths 4 beds |
show details | |

|
#47
Ironwood Dr
Irving, TX 75063
|
1,634 sq. feet
|
2 baths 3 beds |
show details | |

|
#48
Woodcreek
Carrollton, TX 75006
|
2,086 sq. feet
|
2 baths 3 beds |
show details | |

|
#49
Newport Dr
The Colony, TX 75056
|
2,610 sq. feet
|
2 baths 3 beds |
show details | |

|
Check over 1 million property listings on Foreclosure.com!
|
browse all offers | |||


 | Best Dallas suburbs to raise an AA homeschooling family (24 replies) |
| Am i ever going to buy house in DFW? (189 replies) |
| Interested in Copper Canyon, TX (21 replies) |
| Toll Bros. in Flower Mound? (3 replies) |
| General Relocation Advice! (37 replies) |
| Most Affluent Zip Codes ranked by median household income projections for 2010 (22 replies) |

Median year apartment built: 1987
Household type by relationship:
Households: 2,269- Male householders: 510 (3 living alone), Female householders: 349 (63 living alone)
732 spouses (732 opposite-sex spouses), 0 unmarried partners, (0 opposite-sex unmarried partners), 604 children (576 natural, 3 adopted, 24 stepchildren), 0 grandchildren, 0 brothers or sisters, 55 parents, 0 foster children, 13 other relatives, 3 non-relatives
Size of family households: 437 2-persons, 165 3-persons, 162 4-persons, 17 5-persons, 13 6-persons.
Size of nonfamily households: 67 1-person.
370 married couples with children.
33 single-parent households (0 men, 33 women).
91.5% of residents of Copper Canyon speak English at home.
2.2% of residents speak Spanish at home (62% speak English very well, 38% speak English well).
7.1% of residents speak other Indo-European language at home (97% speak English very well, 3% speak English well).
Foreign born population: 216 (9.5%)
(56.0% of them are naturalized citizens)
| Here: | 8.2 |
| State: | 6.3 |
| Here: | 3.8 |
| State: | 4.0 |

- Bedrooms in owner-occupied houses and condos in Copper Canyon, Texas
- 6no bedroom
- 41 bedroom
- 302 bedrooms
- 1583 bedrooms
- 4854 bedrooms
- 1525+ bedrooms

- Bedrooms in renter-occupied apartments in Copper Canyon, Texas
- 0no bedroom
- 01 bedroom
- 112 bedrooms
- 223 bedrooms
- 24 bedrooms
- 05+ bedrooms

- Cars and other vehicles available in Copper Canyon in owner-occupied houses/condos
- 38no vehicle
- 701 vehicle
- 3982 vehicles
- 1943 vehicles
- 524 vehicles
- 845+ vehicles

- Cars and other vehicles available in Copper Canyon in renter-occupied apartments
- 0no vehicle
- 151 vehicle
- 162 vehicles
- 33 vehicles
- 04 vehicles
- 05+ vehicles

- Rooms in owner-occupied houses in Copper Canyon, Texas
- 61 room
- 02 rooms
- 03 rooms
- 124 rooms
- 135 rooms
- 876 rooms
- 2047 rooms
- 1328 rooms
- 3829+ rooms

- Rooms in renter-occupied apartments in Copper Canyon, Texas
- 01 room
- 02 rooms
- 113 rooms
- 184 rooms
- 35 rooms
- 06 rooms
- 07 rooms
- 28 rooms
- 09+ rooms


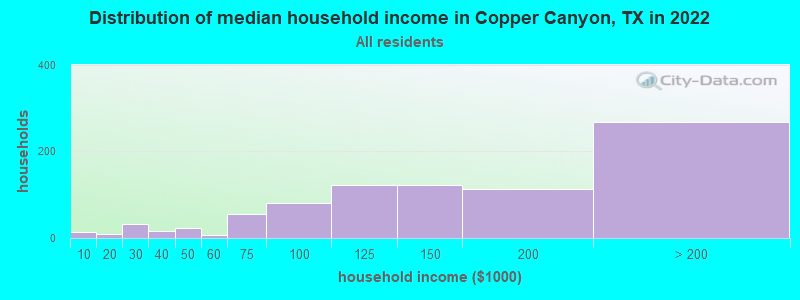
Copper Canyon, TX household income distribution

- 14Less than $10,000
- 10$10,000 to $19,999
- 32$20,000 to $29,999
- 16$30,000 to $39,999
- 24$40,000 to $49,999
- 8$50,000 to $59,999
- 56$60,000 to $74,999
- 80$75,000 to $99,999
- 122$100,000 to $124,999
- 122$125,000 to $149,999
- 113$150,000 to $199,999
- 268$200,000 or more
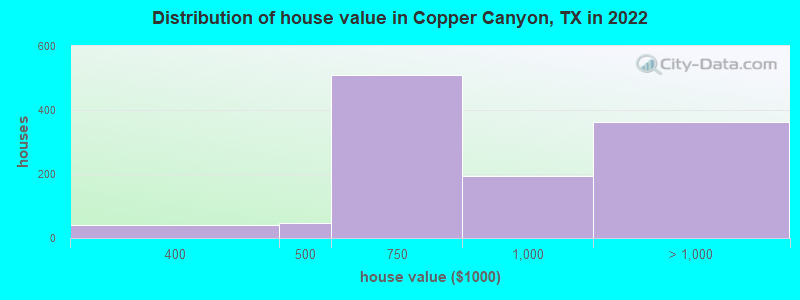
Home value of owner - occupied houses in 2022 in Copper Canyon, TX
-
- 2$125,000 to $149,999
- 2$200,000 to $249,999
- 4$250,000 to $299,999
- 39$300,000 to $399,999
- 46$400,000 to $499,999
- 509$500,000 to $749,999
- 195$750,000 to $999,999
- 214$1,000,000 to $1,499,999
- 31$1,500,000 to $1,999,999
- 117$2,000,000 or more
Rent paid by renters in 2022 in Copper Canyon, TX
-
- 5$1,000 to $1,249
- 11$1,250 to $1,499
- 19$2,000 to $2,499
- 3No cash rent

Percentage of workers working in this county: 89.9%
Number of people working at home: 450 (41.4% of all workers)
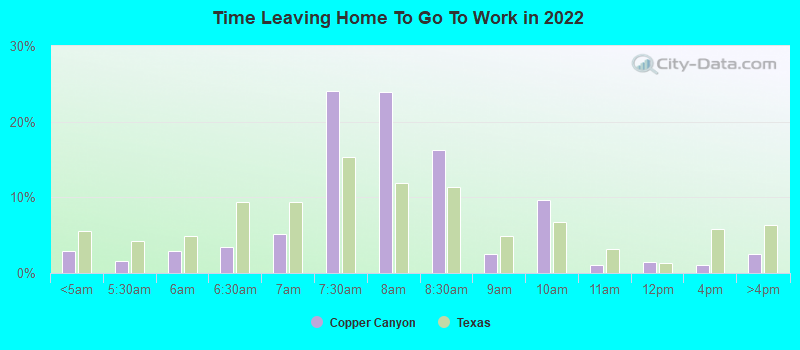
Travel time to work (commute)
- Less than 5 minutes: 8
- 5 to 9 minutes: 22
- 10 to 14 minutes: 54
- 15 to 19 minutes: 54
- 20 to 24 minutes: 211
- 25 to 29 minutes: 97
- 30 to 34 minutes: 40
- 35 to 39 minutes: 55
- 40 to 44 minutes: 45
- 45 to 59 minutes: 75
- 60 to 89 minutes: 10
- 90 or more minutes: 0
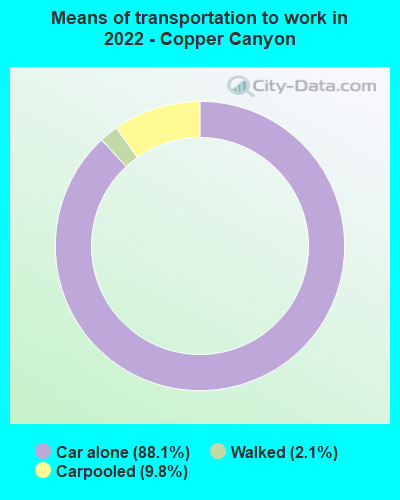
Means of transportation to work:
- Drove a car alone: 372 (45.3%)
- Carpooled: 35 (4.3%)
- Walked: 7 (0.9%)
- Worked at home: 450 (54.7%)
- Unemployment by race in 2022
- Unemployment rate for White non-Hispanic residents
- 1.7%Males
- 8.8%Females
- Unemployment rate for other race residents
- 40.5%Females
- Unemployment rate for two or more race residents
- 4.2%Males
- 62.8%Females
- Unemployment rate for Hispanic or Latino residents
- 71.1%Females

- Year of entry for the foreign-born population in Copper Canyon, Texas
- 952010 or later
- 922000 to 2009
- 61990 to 1999
- 01980 to 1989
- 51970 to 1979
- 7Before 1970

First ancestries reported:
- English: 198 (23.4%)
- German: 117 (13.8%)
- Italian: 93 (11.0%)
- European: 84 (9.9%)
- American: 80 (9.4%)
- Irish: 39 (4.6%)
- Dutch: 24 (2.8%)
- South African: 22 (2.6%)
- Scotch-Irish: 11 (1.3%)
- French: 9 (1.1%)
- Scottish: 9 (1.1%)
- Swedish: 8 (0.9%)
- British: 6 (0.7%)
- French Canadian: 4 (0.5%)
- Hungarian: 2 (0.2%)
- Lithuanian: 2 (0.2%)
- African: 2 (0.2%)
Most common places of birth for foreign-born residents (%):
| Copper Canyon: | 37.9% (77) |
| Texas: | 1.1% (55,371) |
| Copper Canyon: | 27.6% (56) |
| Texas: | 0.2% (11,402) |
| Copper Canyon: | 13.3% (27) |
| Texas: | 0.2% (7,705) |
| Copper Canyon: | 9.4% (19) |
| Texas: | 0.1% (2,961) |
| Copper Canyon: | 8.4% (17) |
| Texas: | 6.1% (306,347) |
| Copper Canyon: | 5.4% (11) |
| Texas: | 1.2% (61,555) |
| Copper Canyon: | 3.9% (8) |
| Texas: | 0.4% (20,885) |
Place of birth for U.S.-born residents:
- This state: 970
- Other state: 982
- Northeast: 110
- Midwest: 327
- South: 346
- West: 194
83.5% of Copper Canyon residents lived in the same house 1 years ago.
Out of people who lived in different houses, 28.8% lived in this county.
Out of people who lived in different counties, 47.2% lived in Texas.
| Copper Canyon: | 83.5% |
| State average: | 85.7% |
Education attainment for males 25 years and older:
- No schooling: 0
- Nursery to 4th grade: 0
- 5th and 6th grade: 2
- 7th and 8th grade: 0
- 9th grade: 0
- 10th grade: 0
- 11th grade: 0
- 12th grade, no diploma: 0
- High school graduate (or equivalency): 85
- Less than 1 year of college: 99
- Some college more than 1 year, no degree: 25
- Associate degree: 49
- Bachelor's degree: 415
- Master's degree: 162
- Professional school degree: 36
- Doctorate degree: 0

Education attainment for females 25 years and older:
- No schooling: 0
- Nursery to 4th grade: 0
- 5th and 6th grade: 0
- 7th and 8th grade: 4
- 9th grade: 0
- 10th grade: 2
- 11th grade: 0
- 12th grade, no diploma: 0
- High school graduate (or equivalency): 208
- Less than 1 year of college: 28
- Some college more than 1 year, no degree: 111
- Associate degree: 99
- Bachelor's degree: 285
- Master's degree: 125
- Professional school degree: 17
- Doctorate degree: 15


Housing units in structures:
- One, detached: 887
- One, attached: 8
House/condo owner moved in on average 10 years ago
Renter moved in on average 6 years ago

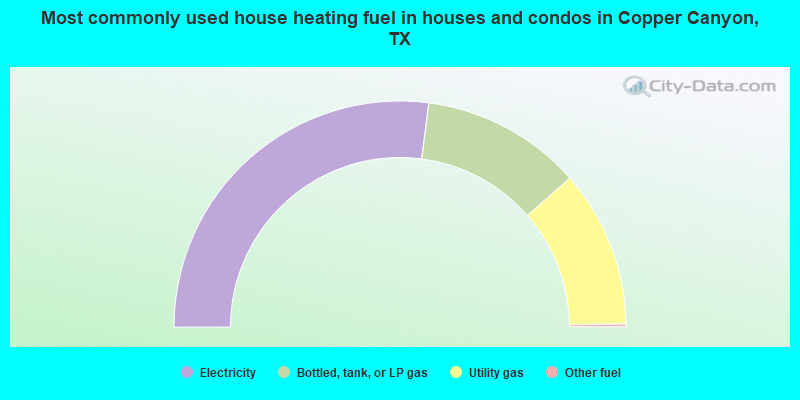
- 54.1%Electricity
- 23.0%Bottled, tank, or LP gas
- 22.5%Utility gas
- 0.4%Other fuel
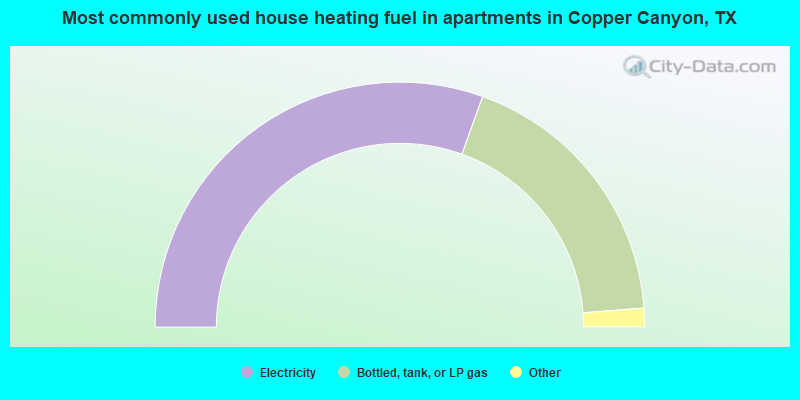
- 62.5%Electricity
- 37.5%Bottled, tank, or LP gas
Private vs. public school enrollment:
| Here: | 27.7% |
| Texas: | 8.8% |
| Here: | 43.5% |
| Texas: | 8.0% |
| Here: | 0.0% |
| Texas: | 16.2% |


