Cordova, IL (Illinois) Houses and Residents
| Cordova: | $179,088 |
| Illinois: | $251,600 |
Total population: 665 (Urban population: 0, Rural population: 626 (2 farm, 624 nonfarm))
Houses: 325 (293 occupied: 232 owner occupied, 67 renter occupied)
| % of renters here: | 22% |
| State: | 33% |
Housing density: 578 houses/condos per square mile
Median price asked for vacant for-sale houses and condos in 2022 in this county: $134,932.
Median contract rent in 2022: $686 (lower quartile is $568, upper quartile is $895)
Median rent asked for vacant for-rent units in 2022: $816
Median gross rent in Cordova, IL in 2022: $855
Housing units in Cordova with a mortgage: 160 (8 second mortgage, 0 home equity loan, 2 both second mortgage and home equity loan)
Houses without a mortgage: 0
Median household income for houses/condos with a mortgage: $89,176
Median household income for apartments without a mortgage: $68,242
Median monthly housing costs: $957
Compare current foreclosures near Cordova, IL:
| Photo | Address | Area | Beds / Baths | Price | Details |
|---|---|---|---|---|---|

|
#1
S Main St
Albany, IL 61230
|
1,564 sq. feet
|
1 baths 3 beds |
$133,000
|
show details |

|
#2
9th Ave S
Clinton, IA 52732
|
1,572 sq. feet
|
1 baths 4 beds |
$109,900
|
show details |

|
#3
9th Ave N
East Moline, IL 61244
|
1,492 sq. feet
|
1 baths 3 beds |
$235,000
|
show details |

|
#4
N 3rd St
Clinton, IA 52732
|
1,252 sq. feet
|
2 baths 2 beds |
$149,900
|
show details |

|
#5
163rd St N
East Moline, IL 61244
|
- sq. feet
|
1 baths 2 beds |
$46,800
|
show details |

|
#6
12th Ave
Moline, IL 61265
|
- sq. feet
|
2 baths 3 beds |
show details | |

|
#7
14th Ave
Silvis, IL 61282
|
858 sq. feet
|
1 baths 3 beds |
show details | |

|
#8
4th Street A
East Moline, IL 61244
|
1,640 sq. feet
|
2 baths 3 beds |
show details | |

|
#9
3rd Ave
De Witt, IA 52742
|
- sq. feet
|
2 baths 4 beds |
show details | |

|
#10
Park Ave S
Eldridge, IA 52748
|
2,400 sq. feet
|
2 baths 4 beds |
show details |
| Photo | Address | Area | Beds / Baths | Price | Details |
|---|---|---|---|---|---|

|
#11
E High St
Davenport, IA 52803
|
1,239 sq. feet
|
2 baths 3 beds |
show details | |

|
#12
N 6th St
Clinton, IA 52732
|
1,912 sq. feet
|
1 baths 3 beds |
show details | |

|
#13
43rd St
Rock Island, IL 61201
|
1,278 sq. feet
|
1 baths 3 beds |
show details | |

|
#14
Warren St
Davenport, IA 52806
|
1,152 sq. feet
|
2 baths 2 beds |
show details | |

|
#15
Tower Ct
Clinton, IA 52732
|
2,117 sq. feet
|
4 baths 4 beds |
show details | |

|
#16
50th Ave
Moline, IL 61265
|
- sq. feet
|
1 baths 3 beds |
show details | |

|
#17
44th St
Rock Island, IL 61201
|
1,721 sq. feet
|
2 baths 3 beds |
show details | |

|
#18
Kings Dr
Bettendorf, IA 52722
|
1,464 sq. feet
|
1 baths 3 beds |
show details | |

|
#19
21st Ave
Moline, IL 61265
|
1,458 sq. feet
|
2 baths 4 beds |
show details | |

|
#20
Park Ave S
Eldridge, IA 52748
|
1,200 sq. feet
|
3 baths 4 beds |
show details |
| Photo | Address | Area | Beds / Baths | Price | Details |
|---|---|---|---|---|---|

|
#21
18th Street B # B
Moline, IL 61265
|
- sq. feet
|
2 baths 3 beds |
show details | |

|
#22
Wakonda Dr
Bettendorf, IA 52722
|
1,020 sq. feet
|
1 baths 3 beds |
show details | |

|
#23
18th St
Bettendorf, IA 52722
|
925 sq. feet
|
1 baths 4 beds |
show details | |

|
#24
Cleveland Rd
Colona, IL 61241
|
912 sq. feet
|
1 baths 2 beds |
show details | |

|
#25
Queens Ct
Bettendorf, IA 52722
|
1,320 sq. feet
|
1 baths 3 beds |
show details | |

|
#26
Hilltop St
Colona, IL 61241
|
2,551 sq. feet
|
1 baths 4 beds |
show details | |

|
#27
Riverview Ln
Bettendorf, IA 52722
|
1,451 sq. feet
|
1 baths 4 beds |
show details | |

|
#28
Central Ave
Bettendorf, IA 52722
|
954 sq. feet
|
1 baths 3 beds |
show details | |

|
#29
17th Ave
Bettendorf, IA 52722
|
3,065 sq. feet
|
1 baths 4 beds |
show details | |

|
#30
2nd Ave N
Clinton, IA 52732
|
1 sq. feet
|
1 baths 3 beds |
show details |
| Photo | Address | Area | Beds / Baths | Price | Details |
|---|---|---|---|---|---|

|
#31
9th Ave S
Clinton, IA 52732
|
- sq. feet
|
- baths - beds |
$16,900
|
show details |

|
#32
S 18th St
Clinton, IA 52732
|
- sq. feet
|
1 baths 2 beds |
show details | |

|
#33
Avalon Dr
Bettendorf, IA 52722
|
1,160 sq. feet
|
1 baths 3 beds |
show details | |

|
#34
N 8th St
Eldridge, IA 52748
|
972 sq. feet
|
2 baths 4 beds |
show details | |

|
#35
Park Ave S
Eldridge, IA 52748
|
1,026 sq. feet
|
1 baths 3 beds |
show details | |

|
#36
Holland St
Le Claire, IA 52753
|
1,418 sq. feet
|
1 baths 3 beds |
show details | |

|
#37
W 9th St
Davenport, IA 52803
|
- sq. feet
|
2 baths 4 beds |
show details | |

|
#38
Jones St
Le Claire, IA 52753
|
1,164 sq. feet
|
1 baths 4 beds |
show details | |

|
#39
S 11th St
Le Claire, IA 52753
|
1,028 sq. feet
|
1 baths 4 beds |
show details | |

|
#40
Talbot Rd
Geneseo, IL 61254
|
1,520 sq. feet
|
1 baths 2 beds |
show details |
| Photo | Address | Area | Beds / Baths | Price | Details |
|---|---|---|---|---|---|

|
#41
4th St
Colona, IL 61241
|
768 sq. feet
|
- baths 2 beds |
show details | |

|
#42
Cypress Dr
Colona, IL 61241
|
1,396 sq. feet
|
1 baths 3 beds |
show details | |

|
#43
Meadow Ln
Colona, IL 61241
|
1,392 sq. feet
|
1 baths 3 beds |
show details | |

|
#44
Somerset Dr
Bettendorf, IA 52722
|
825 sq. feet
|
1 baths 3 beds |
show details | |

|
#45
Monterey Ct
Bettendorf, IA 52722
|
1,592 sq. feet
|
1 baths 4 beds |
show details | |

|
#46
Pigeon Creek Trl
Bettendorf, IA 52722
|
4,275 sq. feet
|
1 baths 5 beds |
show details | |

|
#47
56th Avenue Ct E
Bettendorf, IA 52722
|
3,026 sq. feet
|
1 baths 5 beds |
show details | |

|
#48
15th St
Bettendorf, IA 52722
|
1,694 sq. feet
|
1 baths 3 beds |
show details | |

|
#49
Rustic Lake Dr
Colona, IL 61241
|
2,860 sq. feet
|
1 baths 4 beds |
show details | |

|
Check over 1 million property listings on Foreclosure.com!
|
browse all offers | |||

Latest news about housing in Cordova, IL collected exclusively by city-data.com from local newspapers, TV, and radio stations


Median year apartment built: 1950
Household type by relationship:
Households: 640- Male householders: 143 (41 living alone), Female householders: 144 (29 living alone)
161 spouses (160 opposite-sex spouses), 13 unmarried partners, (13 opposite-sex unmarried partners), 136 children (117 natural, 1 adopted, 17 stepchildren), 19 grandchildren, 4 brothers or sisters, 0 parents, 5 foster children, 1 other relatives, 6 non-relatives
Size of family households: 135 2-persons, 62 3-persons, 17 4-persons, 10 5-persons, 1 6-persons.
Size of nonfamily households: 70 1-person, 6 2-persons, 2 4-persons.
74 married couples with children.
35 single-parent households (21 men, 14 women).
99.0% of residents of Cordova speak English at home.
0.5% of residents speak Spanish at home (100% speak English very well).
0.2% of residents speak other Indo-European language at home (100% speak English very well).
Foreign born population: 16 (2.5%)
(12.5% of them are naturalized citizens)
| Here: | 6.9 |
| State: | 6.4 |
| Here: | 4.6 |
| State: | 4.1 |

- Bedrooms in owner-occupied houses and condos in Cordova, Illinois
- 0no bedroom
- 11 bedroom
- 432 bedrooms
- 1173 bedrooms
- 554 bedrooms
- 165+ bedrooms

- Bedrooms in renter-occupied apartments in Cordova, Illinois
- 3no bedroom
- 101 bedroom
- 342 bedrooms
- 203 bedrooms
- 04 bedrooms
- 05+ bedrooms

- Cars and other vehicles available in Cordova in owner-occupied houses/condos
- 1no vehicle
- 171 vehicle
- 1382 vehicles
- 453 vehicles
- 224 vehicles
- 85+ vehicles

- Cars and other vehicles available in Cordova in renter-occupied apartments
- 20no vehicle
- 261 vehicle
- 182 vehicles
- 33 vehicles
- 04 vehicles
- 05+ vehicles

- Rooms in owner-occupied houses in Cordova, Illinois
- 01 room
- 02 rooms
- 63 rooms
- 34 rooms
- 445 rooms
- 546 rooms
- 497 rooms
- 298 rooms
- 479+ rooms

- Rooms in renter-occupied apartments in Cordova, Illinois
- 31 room
- 42 rooms
- 83 rooms
- 144 rooms
- 245 rooms
- 126 rooms
- 27 rooms
- 08 rooms
- 09+ rooms


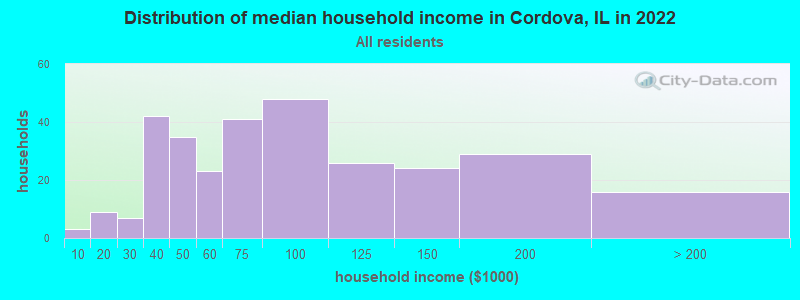
Cordova, IL household income distribution

- 3Less than $10,000
- 9$10,000 to $19,999
- 7$20,000 to $29,999
- 42$30,000 to $39,999
- 35$40,000 to $49,999
- 23$50,000 to $59,999
- 41$60,000 to $74,999
- 48$75,000 to $99,999
- 26$100,000 to $124,999
- 24$125,000 to $149,999
- 29$150,000 to $199,999
- 16$200,000 or more
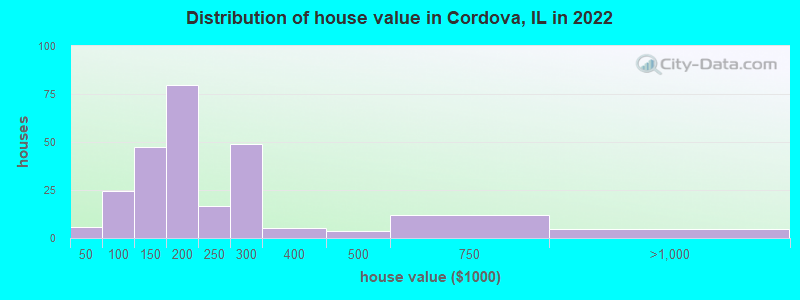
Home value of owner - occupied houses in 2022 in Cordova, IL
-
- 3Less than $10,000
- 1$25,000 to $29,999
- 1$40,000 to $49,999
- 2$50,000 to $59,999
- 14$60,000 to $69,999
- 6$70,000 to $79,999
- 23$100,000 to $124,999
- 24$125,000 to $149,999
- 45$150,000 to $174,999
- 33$175,000 to $199,999
- 16$200,000 to $249,999
- 48$250,000 to $299,999
- 5$300,000 to $399,999
- 3$400,000 to $499,999
- 11$500,000 to $749,999
- 4$750,000 to $999,999
Rent paid by renters in 2022 in Cordova, IL
-
- 7$400 to $449
- 25$600 to $649
- 1$650 to $699
- 14$700 to $749
- 2$800 to $899
- 9$900 to $999
- 4$1,000 to $1,249
- 8No cash rent


Percentage of workers working in this county: 56.9%
Number of people working at home: 36 (10.5% of all workers)
Travel time to work (commute)
- Less than 5 minutes: 4
- 5 to 9 minutes: 33
- 10 to 14 minutes: 13
- 15 to 19 minutes: 27
- 20 to 24 minutes: 20
- 25 to 29 minutes: 44
- 30 to 34 minutes: 61
- 35 to 39 minutes: 13
- 40 to 44 minutes: 25
- 45 to 59 minutes: 25
- 60 to 89 minutes: 0
- 90 or more minutes: 12
Means of transportation to work:
- Drove a car alone: 262 (82.6%)
- Carpooled: 38 (12.0%)
- Streetcar or trolley car: 2 (0.6%)
- Walked: 10 (3.2%)
- Worked at home: 5 (1.6%)

- Unemployment by race in 2022
- Unemployment rate for White non-Hispanic residents
- 3.7%Males
- 3.0%Females
- Unemployment rate for two or more race residents
- 5.3%Females

- Year of entry for the foreign-born population in Cordova, Illinois
- 232010 or later
- 22000 to 2009
- 01990 to 1999
- 41980 to 1989
- 21970 to 1979
- 0Before 1970

First ancestries reported:
- German: 86 (27.9%)
- English: 49 (15.9%)
- Irish: 35 (11.3%)
- American: 29 (9.4%)
- Norwegian: 10 (3.2%)
- Greek: 7 (2.3%)
- Swedish: 7 (2.3%)
- Turkish: 6 (1.9%)
- European: 5 (1.6%)
- Belgian: 4 (1.3%)
- Italian: 3 (1.0%)
- British: 1 (0.3%)
Most common places of birth for foreign-born residents (%):
| Cordova: | 54.5% (12) |
| Illinois: | 9.2% (166,409) |
| Cordova: | 31.8% (7) |
| Illinois: | 0.3% (4,823) |
| Cordova: | 4.5% (1) |
| Illinois: | 0.9% (15,679) |
| Cordova: | 4.5% (1) |
| Illinois: | 4.1% (74,364) |
Place of birth for U.S.-born residents:
- This state: 384
- Other state: 246
- Northeast: 9
- Midwest: 192
- South: 22
- West: 14
93.9% of Cordova residents lived in the same house 1 years ago.
Out of people who lived in different houses, 35.5% lived in this county.
Out of people who lived in different counties, 64.3% lived in Illinois.
| Cordova: | 93.9% |
| State average: | 88.3% |
Education attainment for males 25 years and older:
- No schooling: 2
- Nursery to 4th grade: 0
- 5th and 6th grade: 0
- 7th and 8th grade: 10
- 9th grade: 0
- 10th grade: 0
- 11th grade: 1
- 12th grade, no diploma: 2
- High school graduate (or equivalency): 107
- Less than 1 year of college: 22
- Some college more than 1 year, no degree: 46
- Associate degree: 21
- Bachelor's degree: 20
- Master's degree: 13
- Professional school degree: 22
- Doctorate degree: 0

Education attainment for females 25 years and older:
- No schooling: 1
- Nursery to 4th grade: 0
- 5th and 6th grade: 0
- 7th and 8th grade: 4
- 9th grade: 0
- 10th grade: 0
- 11th grade: 3
- 12th grade, no diploma: 2
- High school graduate (or equivalency): 96
- Less than 1 year of college: 21
- Some college more than 1 year, no degree: 28
- Associate degree: 12
- Bachelor's degree: 27
- Master's degree: 25
- Professional school degree: 15
- Doctorate degree: 5


Housing units in structures:
- One, detached: 275
- One, attached: 4
- Two: 37
- 3 or 4: 3
- 5 to 9: 6
House/condo owner moved in on average 10 years ago
Renter moved in on average 3 years ago

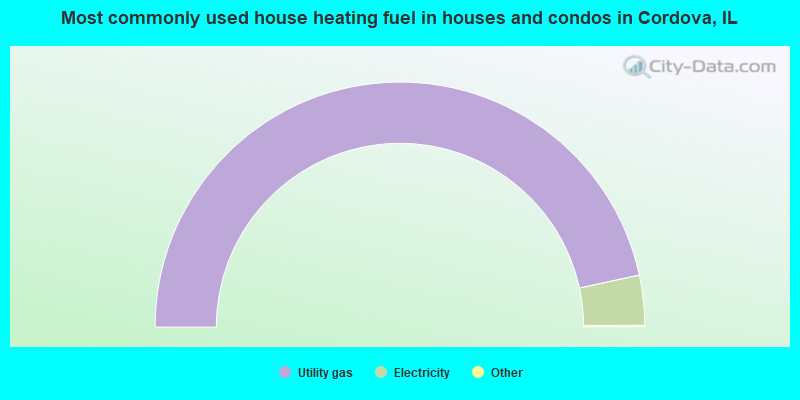
- 93.4%Utility gas
- 6.6%Electricity
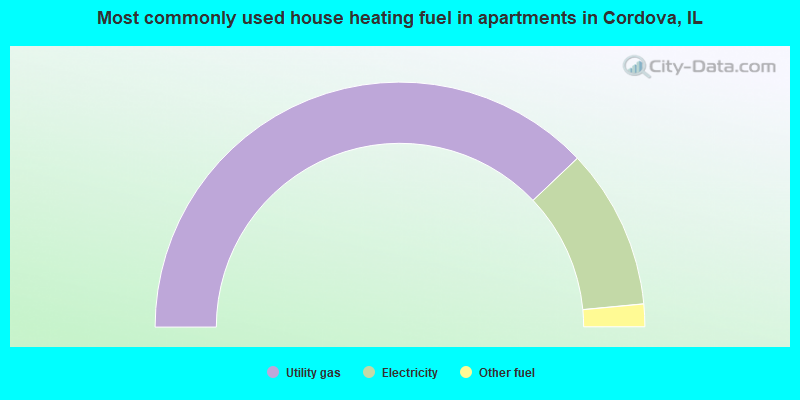
- 75.8%Utility gas
- 21.2%Electricity
- 3.0%Other fuel
Private vs. public school enrollment:
| Here: | 8.0% |
| Illinois: | 13.3% |
| Here: | 0.0% |
| Illinois: | 9.9% |
| Here: | 0.0% |
| Illinois: | 27.4% |


