Corning, CA (California) Houses and Residents
| Corning: | $292,505 |
| California: | $715,900 |
Mean price in 2022:
Detached houses: $290,437
Here: $290,437 State: $988,808 Mobile homes: $201,456
Here: $201,456 State: $184,506
Total population: 7,558 (Urban population: 6,753 (all inside urban clusters), Rural population: 25 (all farm))
Houses: 2,877 (2,661 occupied: 1,379 owner occupied, 1,261 renter occupied)
| % of renters here: | 48% |
| State: | 44% |
Housing density: 990 houses/condos per square mile
Median price asked for vacant for-sale houses and condos in 2022 in this county: $339,234.
Median contract rent in 2022: $856 (lower quartile is $607, upper quartile is $969)
Median rent asked for vacant for-rent units in 2022: $5,836
Median gross rent in Corning, CA in 2022: $1,028
Housing units in Corning with a mortgage: 826 (97 second mortgage, 0 home equity loan, 0 both second mortgage and home equity loan)
Houses without a mortgage: 0
Median household income for houses/condos with a mortgage: $59,168
Median household income for apartments without a mortgage: $77,876
Median monthly housing costs: $1,069
Compare current foreclosures near Corning, CA:
| Photo | Address | Area | Beds / Baths | Price | Details |
|---|---|---|---|---|---|

|
#1
Paskenta Rd
Corning, CA 96021
|
1,064 sq. feet
|
2 baths 2 beds |
$224,900
|
show details |

|
#2
Houghton Ave
Corning, CA 96021
|
- sq. feet
|
2 baths 2 beds |
show details | |

|
#3
Meadowbrook Ln
Corning, CA 96021
|
1,044 sq. feet
|
2 baths 3 beds |
show details | |

|
#4
E Fig Ln
Corning, CA 96021
|
1,974 sq. feet
|
2 baths 3 beds |
show details | |

|
#5
South St
Corning, CA 96021
|
1,956 sq. feet
|
2 baths 1 beds |
show details | |

|
#6
North St
Corning, CA 96021
|
960 sq. feet
|
1 baths 2 beds |
show details | |

|
#7
West St
Corning, CA 96021
|
1,975 sq. feet
|
2 baths 4 beds |
show details | |

|
#8
Michigan Ave
Corning, CA 96021
|
1,560 sq. feet
|
2 baths 3 beds |
show details | |

|
#9
Rowland Ln
Corning, CA 96021
|
2,298 sq. feet
|
2 baths 3 beds |
show details | |

|
#10
Colusa St
Corning, CA 96021
|
- sq. feet
|
- baths - beds |
show details |
| Photo | Address | Area | Beds / Baths | Price | Details |
|---|---|---|---|---|---|

|
#11
E Solano St
Corning, CA 96021
|
- sq. feet
|
- baths - beds |
show details | |

|
#12
Executive Dr
Corning, CA 96021
|
- sq. feet
|
- baths - beds |
show details | |

|
#13
Capay Rd
Corning, CA 96021
|
- sq. feet
|
- baths - beds |
show details | |

|
#14
Peach St
Corning, CA 96021
|
- sq. feet
|
- baths - beds |
show details | |

|
#15
Almond St
Corning, CA 96021
|
- sq. feet
|
- baths - beds |
show details | |

|
#16
County Road Dd
Orland, CA 95963
|
1,404 sq. feet
|
2 baths 3 beds |
show details | |

|
#17
S Center St
Los Molinos, CA 96055
|
1,720 sq. feet
|
2 baths 3 beds |
show details | |

|
#18
Franzel Rd
Red Bluff, CA 96080
|
1,456 sq. feet
|
2 baths 3 beds |
show details | |

|
#19
Wernmark Dr
Red Bluff, CA 96080
|
1,100 sq. feet
|
2 baths 3 beds |
show details | |

|
#20
Mariposa Ave
Gerber, CA 96035
|
- sq. feet
|
3 baths 4 beds |
show details |
| Photo | Address | Area | Beds / Baths | Price | Details |
|---|---|---|---|---|---|

|
#21
Vallecito Way
Red Bluff, CA 96080
|
1,657 sq. feet
|
2 baths 3 beds |
show details | |

|
#22
Crosby Ln
Red Bluff, CA 96080
|
942 sq. feet
|
1 baths 2 beds |
show details | |

|
#23
Muller Ave
Red Bluff, CA 96080
|
1,610 sq. feet
|
1 baths 3 beds |
show details | |

|
#24
State Highway 99e # 99e
Red Bluff, CA 96080
|
1,308 sq. feet
|
2 baths 3 beds |
show details | |

|
#25
Anita Rd
Chico, CA 95973
|
2,224 sq. feet
|
1 baths 3 beds |
show details | |

|
#26
Taft St
Los Molinos, CA 96055
|
1,512 sq. feet
|
2 baths 3 beds |
show details | |

|
#27
Skeet St
Los Molinos, CA 96055
|
1,510 sq. feet
|
2 baths 3 beds |
show details | |

|
#28
Sherwood Blvd
Los Molinos, CA 96055
|
- sq. feet
|
2 baths 2 beds |
show details | |

|
#29
E Swift St
Orland, CA 95963
|
- sq. feet
|
2 baths 3 beds |
show details | |

|
#30
Woodward Ave
Orland, CA 95963
|
- sq. feet
|
1 baths 2 beds |
show details |
| Photo | Address | Area | Beds / Baths | Price | Details |
|---|---|---|---|---|---|

|
#31
E Yolo St
Orland, CA 95963
|
- sq. feet
|
1 baths 2 beds |
show details | |

|
#32
S Jackson St Apt 207
Red Bluff, CA 96080
|
- sq. feet
|
- baths - beds |
show details | |

|
#33
Purported From Said Tax Sheet:, 13223 Taylor St
Chico, CA 95973
|
- sq. feet
|
- baths - beds |
show details | |

|
#34
Woodland Ave
Gerber, CA 96035
|
1,188 sq. feet
|
- baths - beds |
show details | |

|
#35
S Main St Spc 44
Red Bluff, CA 96080
|
- sq. feet
|
- baths - beds |
show details | |

|
#36
Cascade Ave
Red Bluff, CA 96080
|
- sq. feet
|
- baths - beds |
show details | |

|
#37
Kimball Rd Apt 208
Red Bluff, CA 96080
|
- sq. feet
|
- baths - beds |
show details | |

|
#38
State Highway 99e
Los Molinos, CA 96055
|
- sq. feet
|
- baths - beds |
show details | |

|
#39
Blackberry Ave
Red Bluff, CA 96080
|
- sq. feet
|
- baths - beds |
show details | |

|
#40
Buena Vista Ave
Los Molinos, CA 96055
|
- sq. feet
|
- baths - beds |
show details |
| Photo | Address | Area | Beds / Baths | Price | Details |
|---|---|---|---|---|---|

|
#41
Mariposa Ave
Gerber, CA 96035
|
- sq. feet
|
- baths - beds |
show details | |

|
#42
San Benito Ave
Gerber, CA 96035
|
- sq. feet
|
- baths - beds |
show details | |

|
#43
Foothill Blvd
Los Molinos, CA 96055
|
- sq. feet
|
- baths - beds |
show details | |

|
#44
Watts Ave
Orland, CA 95963
|
- sq. feet
|
- baths - beds |
show details | |

|
#45
County Road Ff
Orland, CA 95963
|
- sq. feet
|
- baths - beds |
show details | |

|
#46
County Road Ff
Orland, CA 95963
|
- sq. feet
|
- baths - beds |
show details | |

|
#47
W 5th St
Hamilton City, CA 95951
|
- sq. feet
|
- baths - beds |
show details | |

|
#48
County Road L
Orland, CA 95963
|
- sq. feet
|
- baths - beds |
show details | |

|
Check over 1 million property listings on Foreclosure.com!
|
browse all offers | |||

Latest news about housing in Corning, CA collected exclusively by city-data.com from local newspapers, TV, and radio stations

 | 1900 block of south corning (2 replies) |
| Home Invasion in Venice,CA Story on CNN (42 replies) |
| Does anyone enjoy summer heatwaves (95+ degrees)? (53 replies) |
| What can YOU tell me about these Northern California counties? (Any info IS welcomed!) (100 replies) |
| CSU and the Housing Market (13 replies) |
| Looking to buy an acre or 2 of land in a calm part of California (12 replies) |

Median year apartment built: 1981
Household type by relationship:
Households: 8,166- Male householders: 1,229 (176 living alone), Female householders: 1,400 (414 living alone)
1,458 spouses (1,458 opposite-sex spouses), 53 unmarried partners, (53 opposite-sex unmarried partners), 2,773 children (2,462 natural, 218 adopted, 92 stepchildren), 251 grandchildren, 160 brothers or sisters, 226 parents, 41 foster children, 167 other relatives, 377 non-relatives
- In group quarters: 24
Size of family households: 757 2-persons, 405 3-persons, 302 4-persons, 247 5-persons, 93 6-persons, 322 7-or-more-persons.
Size of nonfamily households: 605 1-person, 5 2-persons, 64 3-persons.
1,155 married couples with children.
520 single-parent households (34 men, 486 women).
55.7% of residents of Corning speak English at home.
43.8% of residents speak Spanish at home (67% speak English very well, 9% speak English well, 11% speak English not well, 13% don't speak English at all).
0.5% of residents speak other Indo-European language at home (100% speak English very well).
Foreign born population: 2,241 (27.4%)
(28.0% of them are naturalized citizens)
| Here: | 5.9 |
| State: | 6.0 |
| Here: | 4.4 |
| State: | 3.9 |

- Bedrooms in owner-occupied houses and condos in Corning, California
- 0no bedroom
- 181 bedroom
- 2662 bedrooms
- 8403 bedrooms
- 2414 bedrooms
- 145+ bedrooms

- Bedrooms in renter-occupied apartments in Corning, California
- 24no bedroom
- 1881 bedroom
- 6322 bedrooms
- 3903 bedrooms
- 144 bedrooms
- 135+ bedrooms

- Cars and other vehicles available in Corning in owner-occupied houses/condos
- 44no vehicle
- 4461 vehicle
- 2932 vehicles
- 3113 vehicles
- 1544 vehicles
- 1315+ vehicles

- Cars and other vehicles available in Corning in renter-occupied apartments
- 207no vehicle
- 5471 vehicle
- 2962 vehicles
- 2113 vehicles
- 04 vehicles
- 05+ vehicles

- Rooms in owner-occupied houses in Corning, California
- 01 room
- 02 rooms
- 393 rooms
- 2184 rooms
- 2925 rooms
- 5016 rooms
- 2027 rooms
- 368 rooms
- 919+ rooms

- Rooms in renter-occupied apartments in Corning, California
- 101 room
- 1362 rooms
- 1553 rooms
- 2684 rooms
- 4295 rooms
- 1296 rooms
- 1057 rooms
- 168 rooms
- 139+ rooms


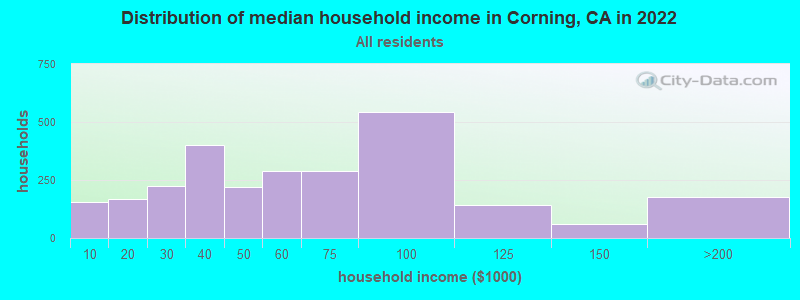
Corning, CA household income distribution

- 154Less than $10,000
- 166$10,000 to $19,999
- 224$20,000 to $29,999
- 401$30,000 to $39,999
- 221$40,000 to $49,999
- 288$50,000 to $59,999
- 288$60,000 to $74,999
- 543$75,000 to $99,999
- 144$100,000 to $124,999
- 61$125,000 to $149,999
- 171$150,000 to $199,999
- 6$200,000 or more
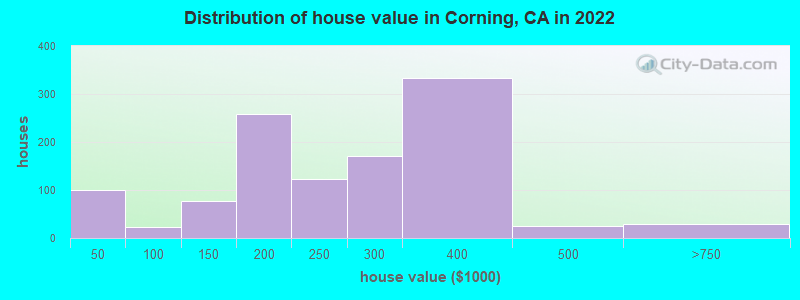
Home value of owner - occupied houses in 2022 in Corning, CA
-
- 85$20,000 to $24,999
- 13$35,000 to $39,999
- 16$70,000 to $79,999
- 6$90,000 to $99,999
- 44$100,000 to $124,999
- 33$125,000 to $149,999
- 175$150,000 to $174,999
- 83$175,000 to $199,999
- 123$200,000 to $249,999
- 170$250,000 to $299,999
- 334$300,000 to $399,999
- 23$400,000 to $499,999
- 30$500,000 to $749,999
Rent paid by renters in 2022 in Corning, CA
-
- 68$100 to $149
- 35$150 to $199
- 66$200 to $249
- 14$300 to $349
- 16$350 to $399
- 35$400 to $449
- 6$450 to $499
- 10$500 to $549
- 42$550 to $599
- 68$600 to $649
- 64$650 to $699
- 113$700 to $749
- 17$750 to $799
- 26$800 to $899
- 317$900 to $999
- 211$1,000 to $1,249
- 27$1,250 to $1,499
- 53$2,500 to $2,999
- 52No cash rent


Percentage of workers working in this county: 70.2%
Number of people working at home: 121 (3.4% of all workers)
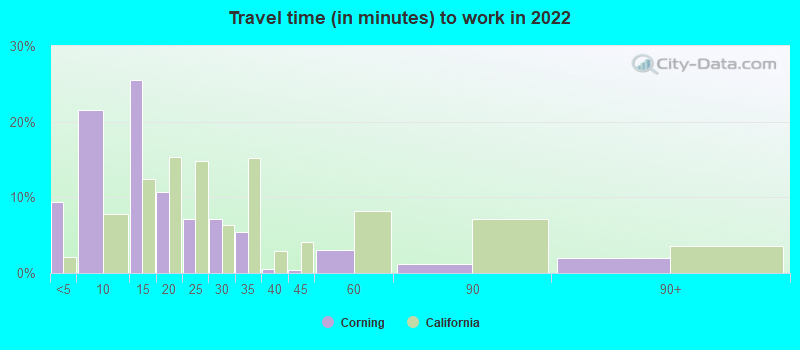
Travel time to work (commute)
- Less than 5 minutes: 171
- 5 to 9 minutes: 654
- 10 to 14 minutes: 430
- 15 to 19 minutes: 434
- 20 to 24 minutes: 215
- 25 to 29 minutes: 0
- 30 to 34 minutes: 366
- 35 to 39 minutes: 123
- 40 to 44 minutes: 143
- 45 to 59 minutes: 61
- 60 to 89 minutes: 73
- 90 or more minutes: 47
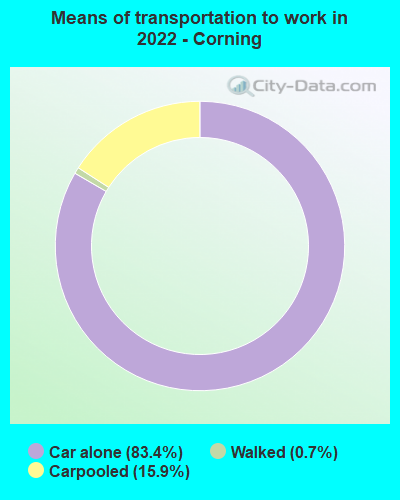
Means of transportation to work:
- Drove a car alone: 2,334 (77.3%)
- Carpooled: 479 (15.9%)
- Walked: 19 (0.6%)
- Worked at home: 121 (4.0%)

- Unemployment by race in 2022
- Unemployment rate for White non-Hispanic residents
- 8.3%Males
- 7.1%Females
- Unemployment rate for other race residents
- 2.0%Males

- Year of entry for the foreign-born population in Corning, California
- 4932010 or later
- 2722000 to 2009
- 5481990 to 1999
- 4251980 to 1989
- 1221970 to 1979
- 103Before 1970

First ancestries reported:
- American: 671 (11.6%)
- German: 390 (6.8%)
- English: 322 (5.6%)
- Irish: 145 (2.5%)
- Northern European: 66 (1.1%)
- Norwegian: 49 (0.8%)
- Portuguese: 43 (0.7%)
- Italian: 34 (0.6%)
- British: 26 (0.5%)
- Russian: 25 (0.4%)
- Scotch-Irish: 13 (0.2%)
Most common places of birth for foreign-born residents (%):
| Corning: | 93.7% (1,814) |
| California: | 37.2% (3,881,193) |
| Corning: | 3.0% (58) |
| California: | 4.2% (440,287) |
| Corning: | 1.8% (34) |
| California: | 0.5% (48,911) |
Place of birth for U.S.-born residents:
- This state: 4,404
- Other state: 1,711
- Northeast: 79
- Midwest: 474
- South: 708
- West: 538
97.5% of Corning residents lived in the same house 1 years ago.
Out of people who lived in different houses, 33.8% lived in this county.
Out of people who lived in different counties, 53.8% lived in California.
| Corning: | 97.5% |
| State average: | 88.9% |
Education attainment for males 25 years and older:
- No schooling: 119
- Nursery to 4th grade: 74
- 5th and 6th grade: 0
- 7th and 8th grade: 17
- 9th grade: 0
- 10th grade: 6
- 11th grade: 75
- 12th grade, no diploma: 76
- High school graduate (or equivalency): 850
- Less than 1 year of college: 400
- Some college more than 1 year, no degree: 330
- Associate degree: 130
- Bachelor's degree: 141
- Master's degree: 136
- Professional school degree: 0
- Doctorate degree: 0

Education attainment for females 25 years and older:
- No schooling: 79
- Nursery to 4th grade: 214
- 5th and 6th grade: 0
- 7th and 8th grade: 24
- 9th grade: 221
- 10th grade: 53
- 11th grade: 17
- 12th grade, no diploma: 83
- High school graduate (or equivalency): 1,442
- Less than 1 year of college: 200
- Some college more than 1 year, no degree: 245
- Associate degree: 155
- Bachelor's degree: 191
- Master's degree: 21
- Professional school degree: 18
- Doctorate degree: 0


Housing units in structures:
- One, detached: 1,972
- One, attached: 58
- 3 or 4: 196
- 5 to 9: 81
- 10 to 19: 114
- 20 to 49: 112
- 50 or more: 74
- Mobile homes: 266
Housing units lacking complete kitchen facilities in 2022: 1.8%
House/condo owner moved in on average 14 years ago
Renter moved in on average 5 years ago

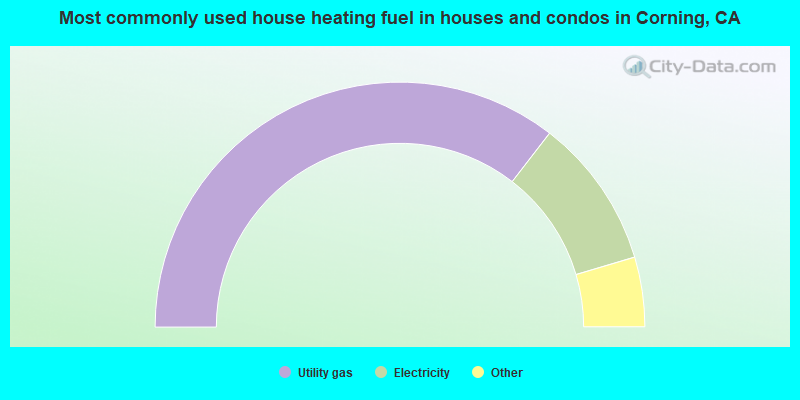
- 71.0%Utility gas
- 19.9%Electricity
- 3.8%Wood
- 3.5%Bottled, tank, or LP gas
- 1.9%Solar energy
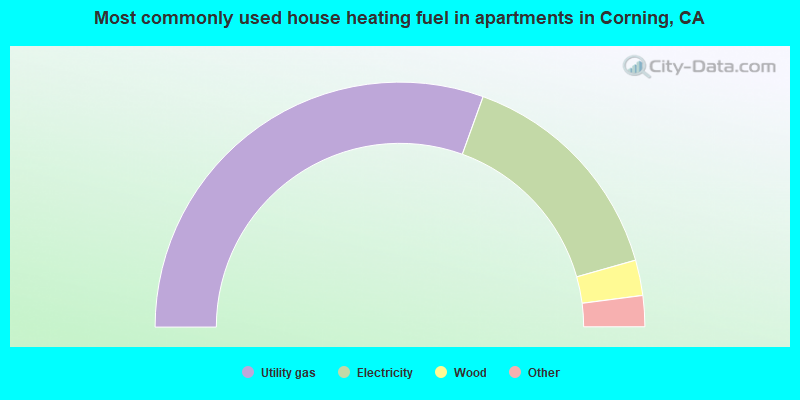
- 61.1%Utility gas
- 30.2%Electricity
- 4.7%Wood
- 2.3%Bottled, tank, or LP gas
- 1.7%Other fuel
Private vs. public school enrollment:
| Here: | 11.4% |
| California: | 10.5% |
| Here: | 0.0% |
| California: | 8.5% |
| Here: | 3.9% |
| California: | 15.9% |


