Corning, NY (New York) Houses and Residents
| Corning: | $146,151 |
| New York: | $400,400 |
Total population: 10,993 (Urban population: 10,842 (all inside urban clusters), Rural population: 0)
Houses: 5,779 (5,300 occupied: 2,825 owner occupied, 2,617 renter occupied)
| % of renters here: | 48% |
| State: | 46% |
Housing density: 1,860 houses/condos per square mile
Median price asked for vacant for-sale houses and condos in 2022: $430,804.
Median contract rent in 2022: $888 (lower quartile is $668, upper quartile is $991)
Median rent asked for vacant for-rent units in 2022: $351
Median gross rent in Corning, NY in 2022: $1,142
Housing units in Corning with a mortgage: 1,765 (184 second mortgage, 0 home equity loan, 168 both second mortgage and home equity loan)
Houses without a mortgage: 216
Median household income for houses/condos with a mortgage: $104,022
Median household income for apartments without a mortgage: $51,375
Median monthly housing costs: $1,062
Compare current foreclosures near Corning, NY:
| Photo | Address | Area | Beds / Baths | Price | Details |
|---|---|---|---|---|---|

|
#1
Griffith St
Corning, NY 14830
|
2,100 sq. feet
|
2 baths 4 beds |
show details | |

|
#2
Reynolds Ave
Corning, NY 14830
|
1,696 sq. feet
|
1 baths 3 beds |
show details | |

|
#3
Kingsbury Ave
Corning, NY 14830
|
1,159 sq. feet
|
1 baths 3 beds |
show details | |

|
#4
Maple St
Corning, NY 14830
|
1,776 sq. feet
|
1 baths 4 beds |
show details | |

|
#5
Spencer Hill Rd
Corning, NY 14830
|
- sq. feet
|
- baths - beds |
show details | |

|
#6
Roberts Ave
Corning, NY 14830
|
- sq. feet
|
- baths - beds |
show details | |

|
#7
E 1st St # 3
Corning, NY 14830
|
- sq. feet
|
- baths - beds |
show details | |

|
#8
Boot Jack Rd
Bath, NY 14810
|
1,078 sq. feet
|
1 baths 3 beds |
$91,520
|
show details |

|
#9
Lewis Rd
Campbell, NY 14821
|
720 sq. feet
|
2 baths 4 beds |
$92,623
|
show details |

|
#10
Norton St
Elmira, NY 14901
|
1,161 sq. feet
|
1 baths 2 beds |
$16,900
|
show details |
| Photo | Address | Area | Beds / Baths | Price | Details |
|---|---|---|---|---|---|

|
#11
W 2nd St
Elmira, NY 14901
|
3,450 sq. feet
|
4 baths 9 beds |
show details | |

|
#12
Steuben St
Horseheads, NY 14845
|
1,252 sq. feet
|
1 baths 2 beds |
show details | |

|
#13
Old State Rd
Addison, NY 14801
|
1,297 sq. feet
|
2 baths 3 beds |
show details | |

|
#14
Lyon St
Elmira, NY 14904
|
1,267 sq. feet
|
1 baths 3 beds |
show details | |

|
#15
W 2nd St
Elmira, NY 14905
|
2,060 sq. feet
|
2 baths 5 beds |
show details | |

|
#16
Beeman Hollow Rd
Addison, NY 14801
|
2,512 sq. feet
|
2 baths 3 beds |
show details | |

|
#17
Standish St
Elmira, NY 14901
|
2 sq. feet
|
2 baths 3 beds |
show details | |

|
#18
Seneca Pl
Elmira, NY 14904
|
1,540 sq. feet
|
1 baths 3 beds |
show details | |

|
#19
Steuben St
Horseheads, NY 14845
|
1,047 sq. feet
|
1 baths 2 beds |
show details | |

|
#20
Johnson St
Elmira, NY 14901
|
1,406 sq. feet
|
1 baths 3 beds |
show details |
| Photo | Address | Area | Beds / Baths | Price | Details |
|---|---|---|---|---|---|

|
#21
Owens St
Horseheads, NY 14845
|
1,800 sq. feet
|
1 baths 3 beds |
show details | |

|
#22
Beckwith Rd
Pine City, NY 14871
|
2,540 sq. feet
|
2 baths 4 beds |
show details | |

|
#23
Wygant Rd
Horseheads, NY 14845
|
1,176 sq. feet
|
1 baths 3 beds |
show details | |

|
#24
Church St
Savona, NY 14879
|
2 sq. feet
|
2 baths 3 beds |
show details | |

|
#25
Dubois St
Elmira, NY 14904
|
1,232 sq. feet
|
1 baths 3 beds |
show details | |

|
#26
County Route 85
Addison, NY 14801
|
840 sq. feet
|
1 baths 2 beds |
show details | |

|
#27
Sunset Cir
Tioga, PA 16946
|
1,176 sq. feet
|
2 baths 3 beds |
show details | |

|
#28
Collins St
Elmira, NY 14904
|
1,296 sq. feet
|
1 baths 3 beds |
show details | |

|
#29
Laurel St
Elmira, NY 14904
|
1,292 sq. feet
|
1 baths 3 beds |
show details | |

|
#30
Post St
Elmira, NY 14904
|
1,466 sq. feet
|
1 baths 3 beds |
show details |
| Photo | Address | Area | Beds / Baths | Price | Details |
|---|---|---|---|---|---|

|
#31
Esty St
Elmira, NY 14904
|
1,396 sq. feet
|
1 baths 3 beds |
show details | |

|
#32
Plymouth Ave
Elmira, NY 14904
|
1,088 sq. feet
|
1 baths 3 beds |
show details | |

|
#33
Baylor Cir
Elmira, NY 14904
|
1,175 sq. feet
|
2 baths 3 beds |
show details | |

|
#34
Gano Rd
Montour Falls, NY 14865
|
975 sq. feet
|
1 baths 2 beds |
show details | |

|
#35
E Clinton St
Elmira, NY 14901
|
1,992 sq. feet
|
2 baths 4 beds |
show details | |

|
#36
Davis St
Elmira, NY 14901
|
2,106 sq. feet
|
1 baths 3 beds |
show details | |

|
#37
Park Ave
Elmira, NY 14901
|
1,360 sq. feet
|
1 baths 3 beds |
show details | |

|
#38
Redfield Dr
Elmira, NY 14905
|
1,200 sq. feet
|
2 baths 2 beds |
show details | |

|
#39
Olcott Rd N
Big Flats, NY 14814
|
2,230 sq. feet
|
2 baths 4 beds |
show details | |

|
#40
Park Ln
Big Flats, NY 14814
|
1,688 sq. feet
|
1 baths 3 beds |
show details |
| Photo | Address | Area | Beds / Baths | Price | Details |
|---|---|---|---|---|---|

|
#41
Eacher Hollow Rd
Horseheads, NY 14845
|
2,024 sq. feet
|
1 baths 3 beds |
show details | |

|
#42
Main St
Campbell, NY 14821
|
1,644 sq. feet
|
1 baths 3 beds |
show details | |

|
#43
County Route 125
Campbell, NY 14821
|
2,268 sq. feet
|
1 baths 4 beds |
show details | |

|
#44
Brooks Ave
Addison, NY 14801
|
1,868 sq. feet
|
1 baths 3 beds |
show details | |

|
#45
Hill St
Elkland, PA 16920
|
1,175 sq. feet
|
1 baths 2 beds |
show details | |

|
#46
Rilla St
Elmira, NY 14903
|
912 sq. feet
|
1 baths 3 beds |
show details | |

|
#47
Oakwood Ave
Elmira, NY 14903
|
2,356 sq. feet
|
2 baths 3 beds |
show details | |

|
#48
Thorne St
Horseheads, NY 14845
|
638 sq. feet
|
1 baths 2 beds |
show details | |

|
#49
County Rte. 17
Savona, NY 14879
|
1,300 sq. feet
|
1 baths 3 beds |
show details | |

|
Check over 1 million property listings on Foreclosure.com!
|
browse all offers | |||

Latest news about housing in Corning, NY collected exclusively by city-data.com from local newspapers, TV, and radio stations


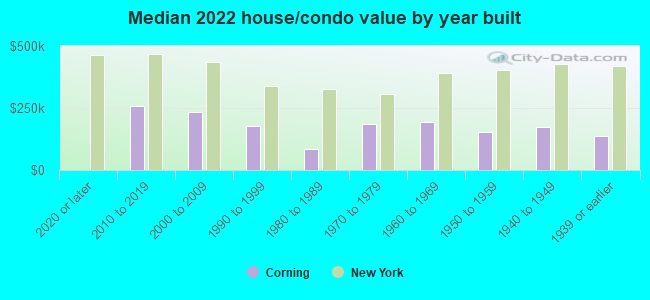
Median year apartment built: 1960
Household type by relationship:
Households: 10,572- Male householders: 2,340 (940 living alone), Female householders: 2,888 (1,278 living alone)
1,822 spouses (1,759 opposite-sex spouses), 482 unmarried partners, (475 opposite-sex unmarried partners), 2,411 children (2,361 natural, 10 adopted, 38 stepchildren), 88 grandchildren, 44 brothers or sisters, 30 parents, 0 foster children, 20 other relatives, 272 non-relatives
- In group quarters: 171
Size of family households: 1,421 2-persons, 654 3-persons, 488 4-persons, 161 5-persons, 5 7-or-more-persons.
Size of nonfamily households: 2,165 1-person, 479 2-persons, 26 4-persons.
1,081 married couples with children.
725 single-parent households (232 men, 493 women).
94.0% of residents of Corning speak English at home.
1.2% of residents speak Spanish at home (67% speak English very well, 33% speak English well).
2.1% of residents speak other Indo-European language at home (74% speak English very well, 26% speak English well).
2.3% of residents speak Asian or Pacific Island language at home (91% speak English very well, 9% speak English well).
0.1% of residents speak other language at home (100% speak English very well).
Foreign born population: 559 (5.3%)
(64.9% of them are naturalized citizens)
| Here: | 6.6 |
| State: | 6.3 |
| Here: | 4.4 |
| State: | 3.8 |
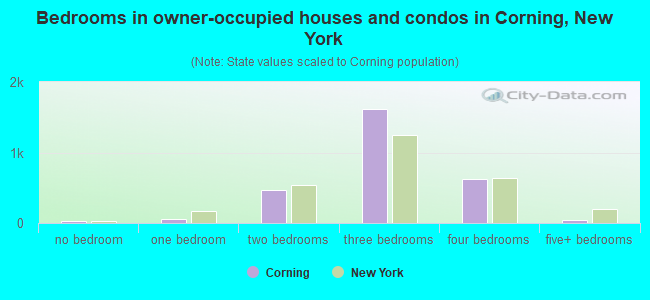
- Bedrooms in owner-occupied houses and condos in Corning, New York
- 35no bedroom
- 521 bedroom
- 4662 bedrooms
- 1,6113 bedrooms
- 6244 bedrooms
- 385+ bedrooms
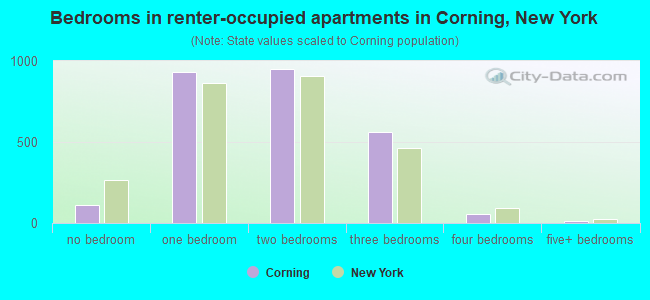
- Bedrooms in renter-occupied apartments in Corning, New York
- 112no bedroom
- 9301 bedroom
- 9512 bedrooms
- 5613 bedrooms
- 534 bedrooms
- 105+ bedrooms
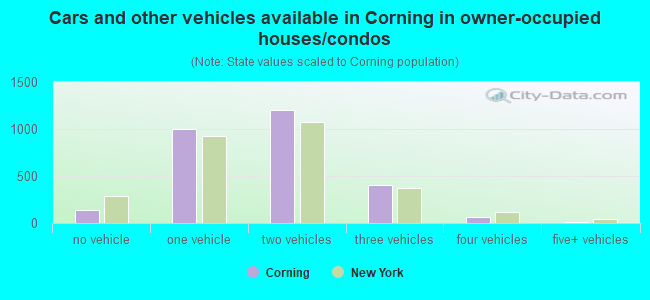
- Cars and other vehicles available in Corning in owner-occupied houses/condos
- 134no vehicle
- 1,0041 vehicle
- 1,2062 vehicles
- 4063 vehicles
- 684 vehicles
- 75+ vehicles
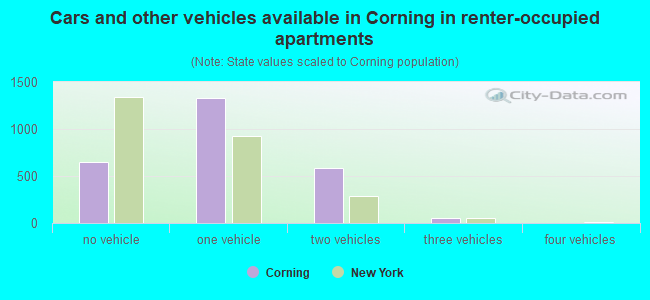
- Cars and other vehicles available in Corning in renter-occupied apartments
- 648no vehicle
- 1,3291 vehicle
- 5832 vehicles
- 583 vehicles
- 04 vehicles
- 05+ vehicles
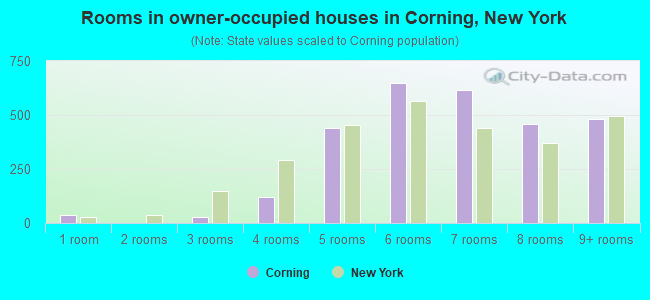
- Rooms in owner-occupied houses in Corning, New York
- 351 room
- 02 rooms
- 283 rooms
- 1214 rooms
- 4405 rooms
- 6466 rooms
- 6167 rooms
- 4598 rooms
- 4819+ rooms
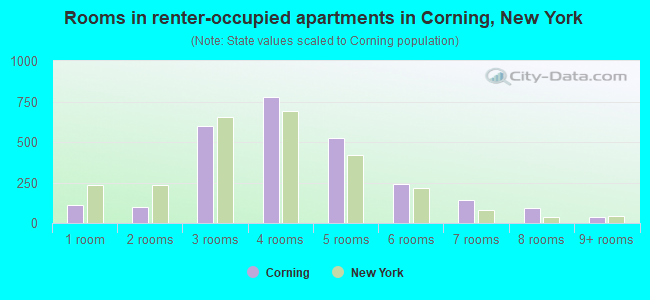
- Rooms in renter-occupied apartments in Corning, New York
- 1121 room
- 982 rooms
- 6003 rooms
- 7754 rooms
- 5225 rooms
- 2396 rooms
- 1427 rooms
- 958 rooms
- 359+ rooms
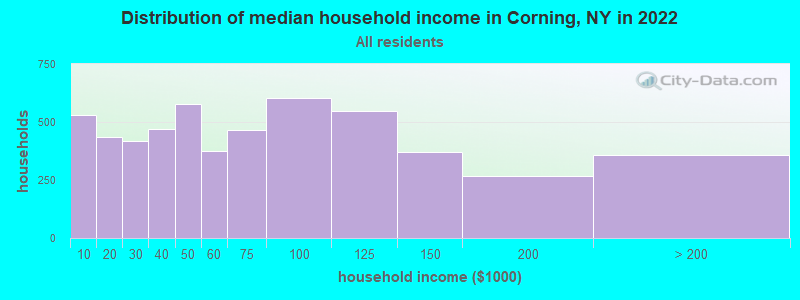
Corning, NY household income distribution

- 530Less than $10,000
- 437$10,000 to $19,999
- 416$20,000 to $29,999
- 468$30,000 to $39,999
- 579$40,000 to $49,999
- 374$50,000 to $59,999
- 464$60,000 to $74,999
- 603$75,000 to $99,999
- 547$100,000 to $124,999
- 369$125,000 to $149,999
- 266$150,000 to $199,999
- 359$200,000 or more
Home value of owner - occupied houses in 2022 in Corning, NY
-
- 18Less than $10,000
- 13$15,000 to $19,999
- 20$40,000 to $49,999
- 61$50,000 to $59,999
- 25$60,000 to $69,999
- 140$70,000 to $79,999
- 172$80,000 to $89,999
- 178$90,000 to $99,999
- 421$100,000 to $124,999
- 408$125,000 to $149,999
- 304$150,000 to $174,999
- 199$175,000 to $199,999
- 353$200,000 to $249,999
- 207$250,000 to $299,999
- 145$300,000 to $399,999
- 32$400,000 to $499,999
- 54$500,000 to $749,999
- 27$750,000 to $999,999
- 8$2,000,000 or more

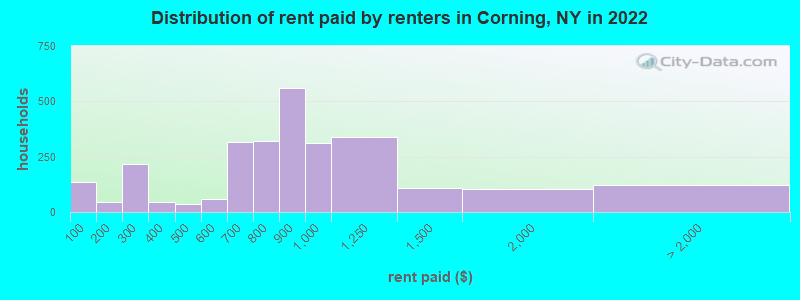
Rent paid by renters in 2022 in Corning, NY
-
- 135Less than $100
- 46$100 to $149
- 77$200 to $249
- 140$250 to $299
- 4$300 to $349
- 39$350 to $399
- 28$400 to $449
- 6$450 to $499
- 11$500 to $549
- 47$550 to $599
- 204$600 to $649
- 111$650 to $699
- 162$700 to $749
- 159$750 to $799
- 562$800 to $899
- 313$900 to $999
- 336$1,000 to $1,249
- 110$1,250 to $1,499
- 101$1,500 to $1,999
- 31$2,000 to $2,499
- 51$2,500 to $2,999
- 11$3,500 or more
- 27No cash rent
Percentage of workers working in this county: 77.3%
Number of people working at home: 675 (12.6% of all workers)
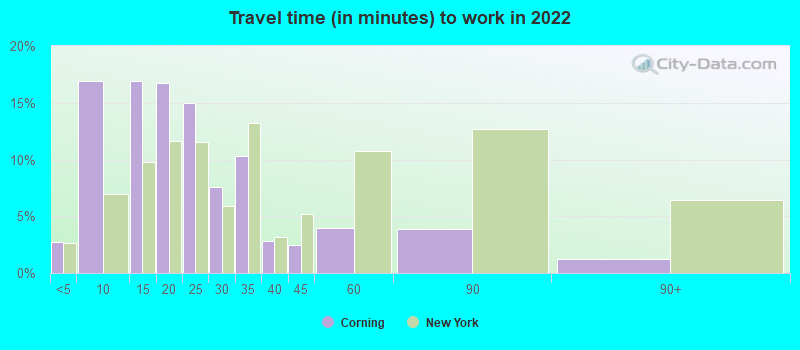
Travel time to work (commute)
- Less than 5 minutes: 249
- 5 to 9 minutes: 1,132
- 10 to 14 minutes: 1,426
- 15 to 19 minutes: 459
- 20 to 24 minutes: 443
- 25 to 29 minutes: 244
- 30 to 34 minutes: 464
- 35 to 39 minutes: 18
- 40 to 44 minutes: 32
- 45 to 59 minutes: 100
- 60 to 89 minutes: 113
- 90 or more minutes: 77
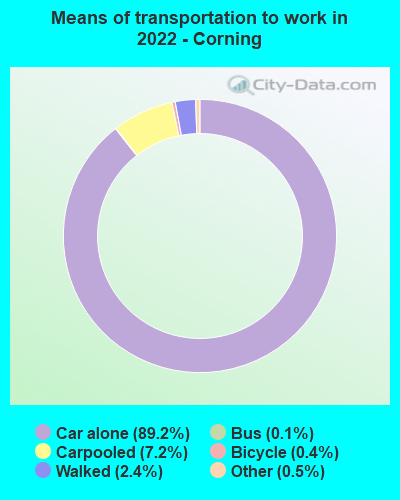
Means of transportation to work:
- Drove a car alone: 9,908 (82.3%)
- Carpooled: 898 (7.5%)
- Bus: 15 (0.1%)
- Taxi: 72 (0.6%)
- Bicycle: 40 (0.3%)
- Walked: 346 (2.9%)
- Worked at home: 675 (5.6%)
- Unemployment by race in 2022
- Unemployment rate for White non-Hispanic residents
- 2.9%Males
- 4.6%Females
- Unemployment rate for Black residents
- 23.4%Males
- Unemployment rate for other race residents
- 24.6%Males
- Unemployment rate for Hispanic or Latino residents
- 12.3%Males
- 34.3%Females
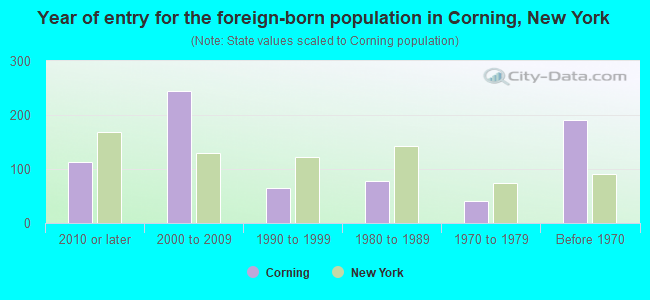
- Year of entry for the foreign-born population in Corning, New York
- 1132010 or later
- 2442000 to 2009
- 641990 to 1999
- 771980 to 1989
- 401970 to 1979
- 190Before 1970
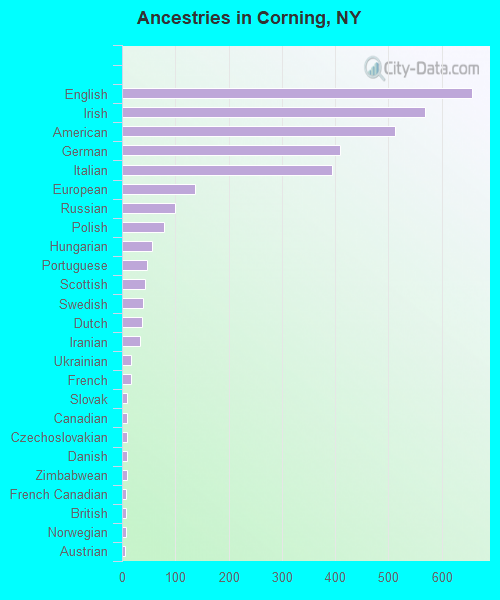
First ancestries reported:
- English: 656 (16.2%)
- Irish: 568 (14.0%)
- American: 512 (12.6%)
- German: 409 (10.1%)
- Italian: 395 (9.8%)
- European: 137 (3.4%)
- Russian: 100 (2.5%)
- Polish: 79 (2.0%)
- Hungarian: 56 (1.4%)
- Portuguese: 47 (1.2%)
- Scottish: 43 (1.1%)
- Swedish: 39 (1.0%)
- Dutch: 38 (0.9%)
- Iranian: 34 (0.8%)
- Ukrainian: 17 (0.4%)
- French: 16 (0.4%)
- Slovak: 10 (0.2%)
- Canadian: 9 (0.2%)
- Czechoslovakian: 9 (0.2%)
- Danish: 9 (0.2%)
- Zimbabwean: 9 (0.2%)
- French Canadian: 8 (0.2%)
- British: 7 (0.2%)
- Norwegian: 7 (0.2%)
- Austrian: 6 (0.1%)
- Czech: 6 (0.1%)
- Cajun: 4 (0.10%)
- Northern European: 4 (0.10%)
- Scotch-Irish: 4 (0.10%)
Most common places of birth for foreign-born residents (%):
| Corning: | 23.8% (136) |
| New York: | 3.5% (158,432) |
| Corning: | 7.7% (44) |
| New York: | 1.7% (75,802) |
| Corning: | 7.4% (42) |
| New York: | 0.2% (10,519) |
| Corning: | 6.5% (37) |
| New York: | 1.3% (59,107) |
| Corning: | 5.3% (30) |
| New York: | 0.4% (18,283) |
| Corning: | 5.1% (29) |
| New York: | 0.3% (12,762) |
| Corning: | 4.9% (28) |
| New York: | 0.6% (26,772) |
| Corning: | 4.4% (25) |
| New York: | 9.1% (410,910) |
| Corning: | 4.2% (24) |
| New York: | 0.1% (3,528) |
| Corning: | 3.3% (19) |
| New York: | 0.5% (23,058) |
| Corning: | 3.2% (18) |
| New York: | 1.8% (82,786) |
| Corning: | 3.0% (17) |
| New York: | 2.0% (91,428) |
| Corning: | 1.8% (10) |
| New York: | 0.5% (21,928) |
| Corning: | 1.8% (10) |
| New York: | 2.5% (111,920) |
| Corning: | 1.6% (9) |
| New York: | 0.6% (25,782) |
Place of birth for U.S.-born residents:
- This state: 7,460
- Other state: 2,454
- Northeast: 924
- Midwest: 571
- South: 988
- West: 97
81.8% of Corning residents lived in the same house 1 years ago.
Out of people who lived in different houses, 38.6% lived in this county.
Out of people who lived in different counties, 64.4% lived in New York.
| Corning: | 81.8% |
| State average: | 89.6% |
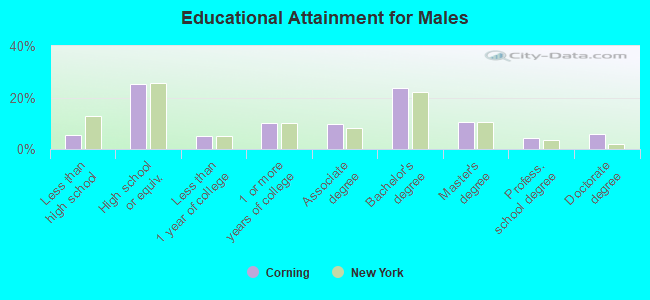
Education attainment for males 25 years and older:
- No schooling: 70
- Nursery to 4th grade: 0
- 5th and 6th grade: 3
- 7th and 8th grade: 9
- 9th grade: 0
- 10th grade: 3
- 11th grade: 82
- 12th grade, no diploma: 23
- High school graduate (or equivalency): 903
- Less than 1 year of college: 186
- Some college more than 1 year, no degree: 360
- Associate degree: 340
- Bachelor's degree: 841
- Master's degree: 374
- Professional school degree: 154
- Doctorate degree: 206
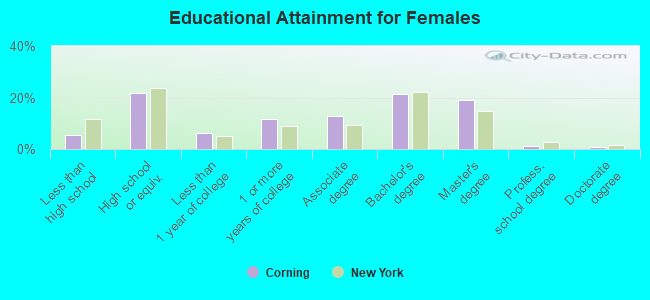
Education attainment for females 25 years and older:
- No schooling: 98
- Nursery to 4th grade: 6
- 5th and 6th grade: 7
- 7th and 8th grade: 12
- 9th grade: 12
- 10th grade: 13
- 11th grade: 9
- 12th grade, no diploma: 56
- High school graduate (or equivalency): 838
- Less than 1 year of college: 235
- Some college more than 1 year, no degree: 449
- Associate degree: 497
- Bachelor's degree: 831
- Master's degree: 737
- Professional school degree: 47
- Doctorate degree: 25
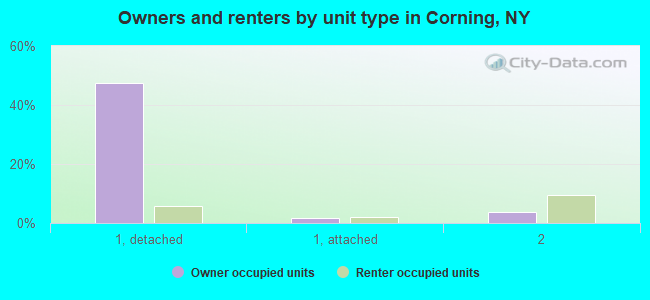
Housing units in structures:
- One, detached: 2,877
- One, attached: 226
- Two: 900
- 3 or 4: 657
- 5 to 9: 326
- 10 to 19: 321
- 20 to 49: 159
- 50 or more: 307
Housing units lacking complete kitchen facilities in 2022: 1.5%
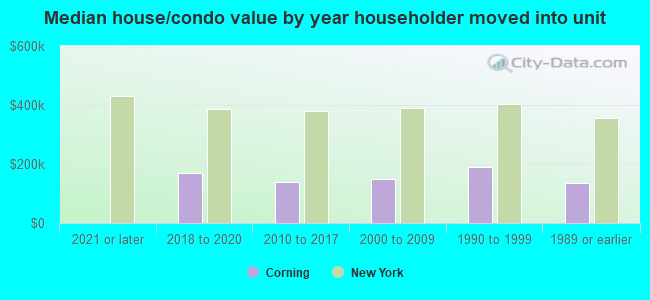
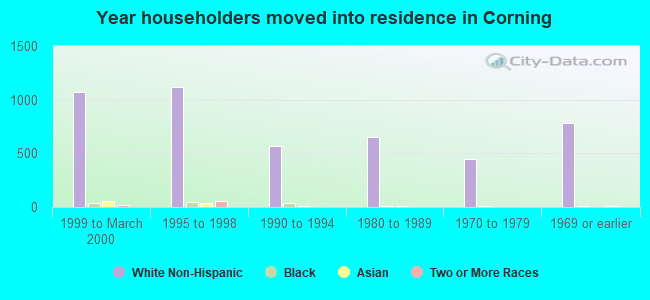
House/condo owner moved in on average 13 years ago
Renter moved in on average 1 years ago
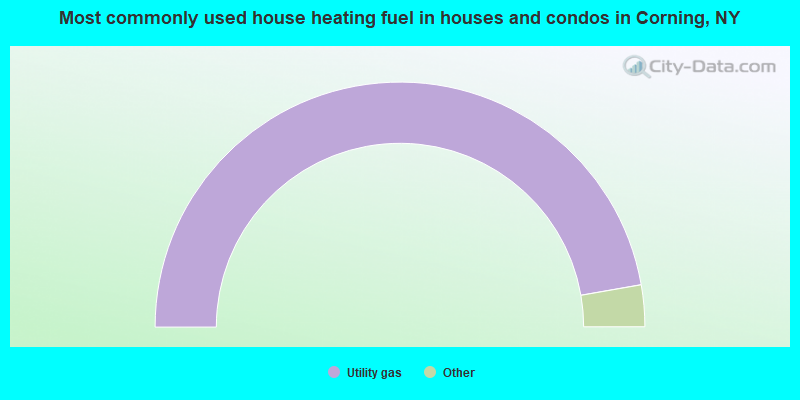
- 94.5%Utility gas
- 2.2%Bottled, tank, or LP gas
- 1.7%Electricity
- 0.8%Wood
- 0.7%Fuel oil, kerosene, etc.
- 0.2%Other fuel
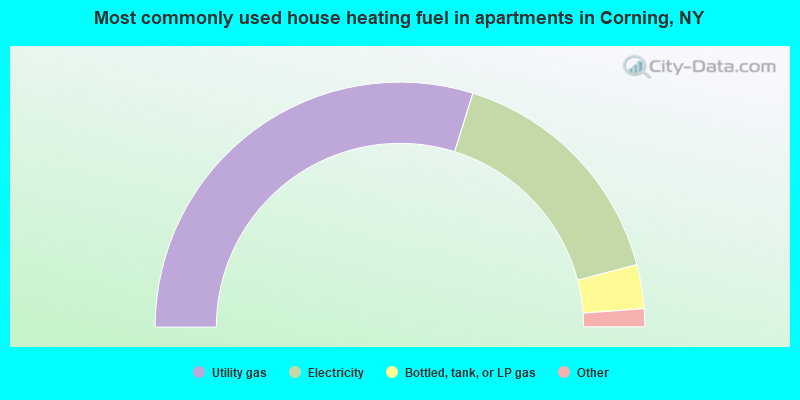
- 59.7%Utility gas
- 32.2%Electricity
- 5.8%Bottled, tank, or LP gas
- 1.3%Other fuel
- 1.1%Fuel oil, kerosene, etc.
Private vs. public school enrollment:
| Here: | 21.0% |
| New York: | 15.6% |
| Here: | 4.2% |
| New York: | 15.0% |
| Here: | 13.0% |
| New York: | 39.2% |