Housing density: 1,217 houses/condos per square mile
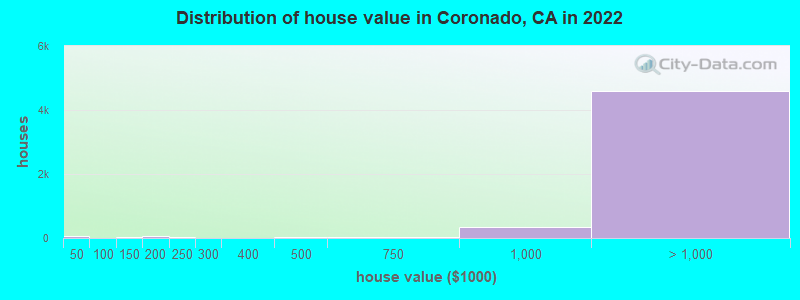
Median price asked for vacant for-sale houses and condos in 2022: $3,723,279.
Median contract rent in 2022: over $2,000 (lower quartile is over $2,000, upper quartile is over $2,000)
Median rent asked for vacant for-rent units in 2022: $2,439
Median gross rent in Coronado, CA in 2022: over $2,000
Housing units in Coronado with a mortgage: 1,977 (281 second mortgage, 0 home equity loan, 268 both second mortgage and home equity loan) Houses without a mortgage: 33
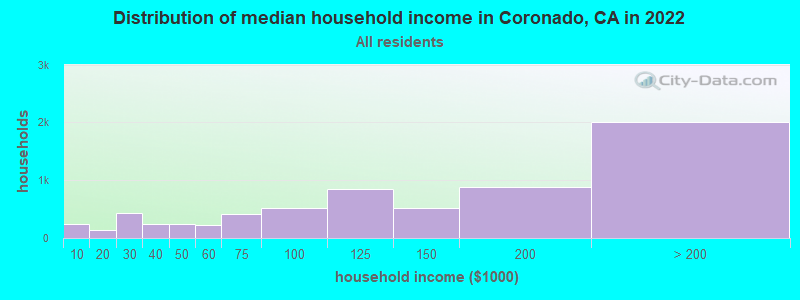
Median household income for houses/condos with a mortgage: $186,487
Median household income for apartments without a mortgage: $119,093
Size of family households: 2,766 2-persons, 1,035 3-persons, 645 4-persons, 217 5-persons, 56 6-persons, 44 7-or-more-persons.
Size of nonfamily households: 1,648 1-person, 291 2-persons, 17 3-persons.
2,551 married couples with children.
562 single-parent households (87 men, 475 women).
83.3% of residents of Coronado speak English at home.
11.1% of residents speak Spanish at home (80% speak English very well, 17% speak English well, 3% speak English not well).
2.6% of residents speak other Indo-European language at home (100% speak English very well).
2.3% of residents speak Asian or Pacific Island language at home (64% speak English very well, 33% speak English well, 3% speak English not well).
0.5% of residents speak other language at home (27% speak English very well, 73% speak English well).
Foreign born population: 1,733 (9.2%)
(69.1% of them are naturalized citizens)
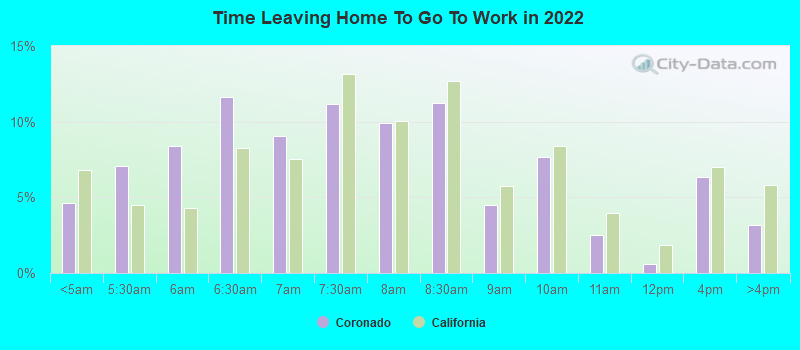
Percentage of workers working in this county: 97.0% Number of people working at home: 2,176 (21.5% of all workers)
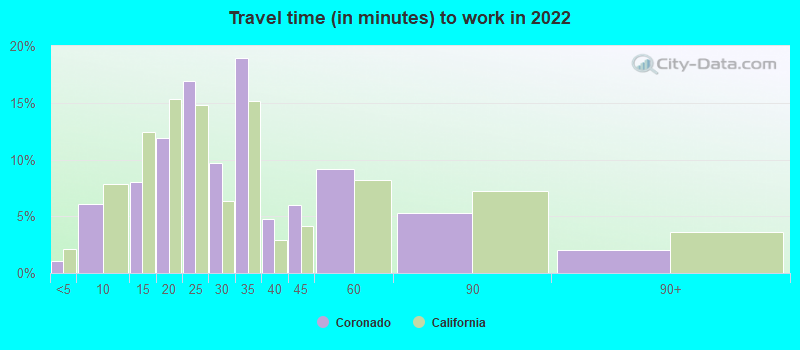
Travel time to work (commute)
Less than 5 minutes: 210
5 to 9 minutes: 1,450
10 to 14 minutes: 1,274
15 to 19 minutes: 1,294
20 to 24 minutes: 1,500
25 to 29 minutes: 481
30 to 34 minutes: 935
35 to 39 minutes: 92
40 to 44 minutes: 111
45 to 59 minutes: 509
60 to 89 minutes: 148
90 or more minutes: 79
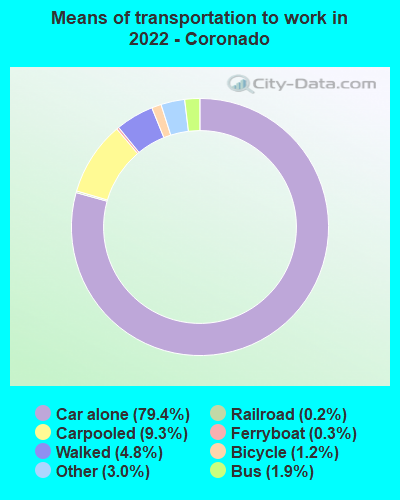
Means of transportation to work:
Drove a car alone: 21,628 (71.1%)
Carpooled: 2,637 (8.7%)
Bus: 471 (1.5%)
Light rail, streetcar or trolley: 71 (0.2%)
Ferryboat: 62 (0.2%)
Taxi: 849 (2.8%)
Bicycle: 344 (1.1%)
Walked: 1,441 (4.7%)
Worked at home: 2,176 (7.2%)
Unemployment by race in 2022
Unemployment rate for White non-Hispanic residents
4.0%Males
5.2%Females
Unemployment rate for Black residents
0.4%Males
Unemployment rate for Asian residents
4.2%Males
Unemployment rate for other race residents
13.4%Females
Unemployment rate for two or more race residents
6.3%Males
0.3%Females
Unemployment rate for Hispanic or Latino residents
5.4%Males
1.1%Females
Year of entry for the foreign-born population in Coronado, California
6392010 or later
2742000 to 2009
2891990 to 1999
7011980 to 1989
2481970 to 1979
499Before 1970
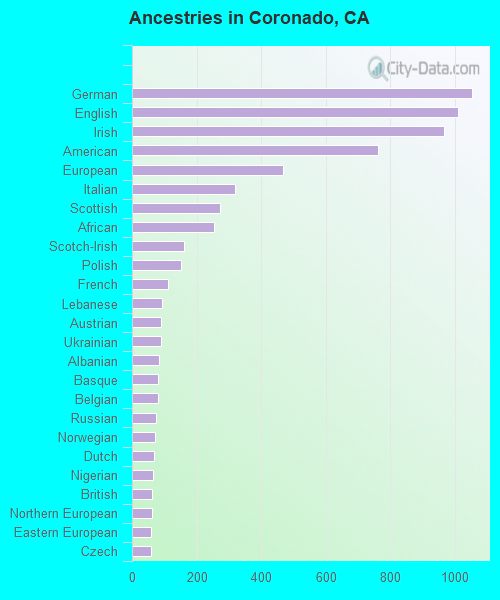
First ancestries reported:
German: 1,053 (10.7%)
English: 1,011 (10.3%)
Irish: 967 (9.8%)
American: 763 (7.7%)
European: 469 (4.8%)
Italian: 320 (3.2%)
Scottish: 272 (2.8%)
African: 254 (2.6%)
Scotch-Irish: 161 (1.6%)
Polish: 152 (1.5%)
French: 112 (1.1%)
Lebanese: 93 (0.9%)
Austrian: 91 (0.9%)
Ukrainian: 90 (0.9%)
Albanian: 84 (0.9%)
Basque: 82 (0.8%)
Belgian: 80 (0.8%)
Russian: 73 (0.7%)
Norwegian: 72 (0.7%)
Dutch: 67 (0.7%)
Nigerian: 66 (0.7%)
British: 62 (0.6%)
Northern European: 61 (0.6%)
Eastern European: 60 (0.6%)
Czech: 59 (0.6%)
Swedish: 50 (0.5%)
Hungarian: 35 (0.4%)
Greek: 26 (0.3%)
Lithuanian: 25 (0.3%)
Jamaican: 23 (0.2%)
Swiss: 22 (0.2%)
Danish: 21 (0.2%)
Macedonian: 17 (0.2%)
Haitian: 15 (0.2%)
French Canadian: 14 (0.1%)
Ethiopian: 11 (0.1%)
Welsh: 11 (0.1%)
Maltese: 9 (0.09%)
Finnish: 8 (0.08%)
Romanian: 7 (0.07%)
Portuguese: 6 (0.06%)
Slovak: 5 (0.05%)
Iranian: 5 (0.05%)
Assyrian: 4 (0.04%)
Serbian: 4 (0.04%)
Scandinavian: 2 (0.02%)
Slavic: 2 (0.02%)
Armenian: 2 (0.02%)
Israeli: 1 (0.01%)
Croatian: 1 (0.01%)
Brazilian: 1 (0.01%)
Most common places of birth for foreign-born residents (%):
Mexico
Coronado:
35.8% (620)
California:
37.2% (3,881,193)
Canada
Coronado:
9.9% (171)
California:
1.2% (127,477)
Uruguay
Coronado:
8.5% (148)
California:
0.0% (3,811)
Philippines
Coronado:
6.8% (118)
California:
7.8% (818,297)
Japan
Coronado:
6.5% (113)
California:
1.0% (103,575)
Nigeria
Coronado:
4.8% (84)
California:
0.3% (35,557)
China, excluding Hong Kong and Taiwan
Coronado:
2.8% (49)
California:
6.6% (684,672)
Brazil
Coronado:
2.8% (48)
California:
0.5% (53,222)
United Kingdom, excluding England and Scotland
Coronado:
2.5% (43)
California:
0.6% (60,582)
India
Coronado:
2.3% (39)
California:
5.2% (539,184)
Afghanistan
Coronado:
2.3% (39)
California:
0.5% (53,260)
Germany
Coronado:
2.2% (38)
California:
0.7% (73,304)
Australia
Coronado:
1.7% (30)
California:
0.2% (23,338)
Ukraine
Coronado:
1.6% (28)
California:
0.6% (60,761)
Colombia
Coronado:
1.6% (27)
California:
0.5% (55,249)
Place of birth for U.S.-born residents:
This state: 7,150
Other state: 9,199
Northeast: 2,356
Midwest: 2,027
South: 3,434
West: 1,432
79.3% of Coronado residents lived in the same house 1 years ago. Out of people who lived in different houses, 28.1% lived in this county. Out of people who lived in different counties, 32.1% lived in California.
Coronado:
79.3%
State average:
88.9%
Education attainment for males 25 years and older:
No schooling: 18
Nursery to 4th grade: 5
5th and 6th grade: 0
7th and 8th grade: 9
9th grade: 4
10th grade: 0
11th grade: 70
12th grade, no diploma: 90
High school graduate (or equivalency): 595
Less than 1 year of college: 254
Some college more than 1 year, no degree: 817
Associate degree: 394
Bachelor's degree: 2,162
Master's degree: 1,304
Professional school degree: 749
Doctorate degree: 257
Education attainment for females 25 years and older:
No schooling: 31
Nursery to 4th grade: 7
5th and 6th grade: 14
7th and 8th grade: 0
9th grade: 0
10th grade: 12
11th grade: 9
12th grade, no diploma: 5
High school graduate (or equivalency): 408
Less than 1 year of college: 238
Some college more than 1 year, no degree: 829
Associate degree: 522
Bachelor's degree: 2,134
Master's degree: 1,216
Professional school degree: 414
Doctorate degree: 191
Housing units in structures:
One, detached: 4,337
One, attached: 1,231
Two: 205
3 or 4: 336
5 to 9: 557
10 to 19: 394
20 to 49: 323
50 or more: 1,985
Mobile homes: 20
Housing units lacking complete plumbing facilities in 2022: 0.2%
Housing units lacking complete kitchen facilities in 2022: 0.9%
House/condo owner moved in on average 15 years ago