Cortland, IL (Illinois) Houses and Residents
| Cortland: | $204,202 |
| Illinois: | $251,600 |
Mean price in 2022:
Detached houses: $229,694
Here: $229,694 State: $310,164 Townhouses or other attached units: $109,520
Here: $109,520 State: $286,230
Total population: 4,341 (Urban population: 2,008, Rural population: 38 (all nonfarm))
Houses: 1,734 (1,682 occupied: 1,218 owner occupied, 453 renter occupied)
| % of renters here: | 27% |
| State: | 33% |
Housing density: 987 houses/condos per square mile
Median price asked for vacant for-sale houses and condos in 2022 in this county: $178,377.
Median contract rent in 2022: $1,182 (lower quartile is $1,083, upper quartile is $1,206)
Median rent asked for vacant for-rent units in 2022: $2,482
Median gross rent in Cortland, IL in 2022: $1,264
Housing units in Cortland with a mortgage: 971 (156 second mortgage, 0 home equity loan, 141 both second mortgage and home equity loan)
Houses without a mortgage: 18
Median household income for houses/condos with a mortgage: $118,502
Median household income for apartments without a mortgage: $74,047
Median monthly housing costs: $1,408
Compare current foreclosures near Cortland, IL:
| Photo | Address | Area | Beds / Baths | Price | Details |
|---|---|---|---|---|---|

|
#1
S Somonauk Rd
Cortland, IL 60112
|
- sq. feet
|
- baths - beds |
show details | |

|
#2
Corron Rd
Elgin, IL 60124
|
3,352 sq. feet
|
3 baths 4 beds |
$685,000
|
show details |

|
#3
Leonard Ave
Dekalb, IL 60115
|
1,295 sq. feet
|
2 baths 3 beds |
$245,000
|
show details |

|
#4
W Meadow Dr
Cortland, IL 60112
|
- sq. feet
|
- baths - beds |
show details | |

|
#5
S Hahn Dr
Cortland, IL 60112
|
- sq. feet
|
- baths - beds |
show details | |

|
#6
N Hickory St
Cortland, IL 60112
|
- sq. feet
|
- baths - beds |
show details | |

|
#7
W Prairiefield Ave
Cortland, IL 60112
|
- sq. feet
|
- baths - beds |
show details | |

|
#8
Collins Dr
Elburn, IL 60119
|
2,669 sq. feet
|
2 baths 4 beds |
show details | |

|
#9
Pine St
Sugar Grove, IL 60554
|
2,840 sq. feet
|
4 baths 4 beds |
show details | |

|
#10
Monroe St
Genoa, IL 60135
|
1,412 sq. feet
|
2 baths 3 beds |
show details |
| Photo | Address | Area | Beds / Baths | Price | Details |
|---|---|---|---|---|---|

|
#11
S Peace Rd
Sycamore, IL 60178
|
763 sq. feet
|
1 baths 2 beds |
show details | |

|
#12
Tilton Park Dr
Dekalb, IL 60115
|
1,400 sq. feet
|
1 baths 3 beds |
show details | |

|
#13
Easy St
Sycamore, IL 60178
|
- sq. feet
|
1 baths 4 beds |
show details | |

|
#14
Clark St
Dekalb, IL 60115
|
1,105 sq. feet
|
2 baths 2 beds |
show details | |

|
#15
Bella Dr
Hampshire, IL 60140
|
- sq. feet
|
- baths - beds |
show details | |

|
#16
Heatherington Pl
Elgin, IL 60124
|
- sq. feet
|
- baths - beds |
show details | |

|
#17
Aspen Ct, Apt 3
Dekalb, IL 60115
|
- sq. feet
|
- baths - beds |
show details | |

|
#18
Walt Whitman Rd
Saint Charles, IL 60175
|
- sq. feet
|
- baths - beds |
show details | |

|
#19
Peplow Rd
Hampshire, IL 60140
|
- sq. feet
|
- baths - beds |
show details | |

|
#20
Redwood Ln
Saint Charles, IL 60175
|
- sq. feet
|
- baths - beds |
show details |
| Photo | Address | Area | Beds / Baths | Price | Details |
|---|---|---|---|---|---|

|
#21
Eves Cir E
Dekalb, IL 60115
|
- sq. feet
|
- baths - beds |
show details | |

|
#22
Dauberman Rd
Elburn, IL 60119
|
- sq. feet
|
- baths - beds |
show details | |

|
#23
Fieldstone Ln
Geneva, IL 60134
|
- sq. feet
|
- baths - beds |
show details | |

|
#24
Carney Ln
Geneva, IL 60134
|
- sq. feet
|
- baths - beds |
show details | |

|
#25
Williams Way
Dekalb, IL 60115
|
- sq. feet
|
- baths - beds |
show details | |

|
#26
Settlement Dr
Maple Park, IL 60151
|
- sq. feet
|
- baths - beds |
show details | |

|
#27
Eves Cir W
Dekalb, IL 60115
|
- sq. feet
|
- baths - beds |
show details | |

|
#28
N 5th St
Malta, IL 60150
|
- sq. feet
|
- baths - beds |
show details | |

|
#29
Country Life Dr
Maple Park, IL 60151
|
- sq. feet
|
- baths - beds |
show details | |

|
#30
Motel Rd
Sycamore, IL 60178
|
- sq. feet
|
- baths - beds |
show details |
| Photo | Address | Area | Beds / Baths | Price | Details |
|---|---|---|---|---|---|

|
#31
Heatherington Pl
Elgin, IL 60124
|
- sq. feet
|
- baths - beds |
show details | |

|
#32
Empire Rd
Saint Charles, IL 60175
|
- sq. feet
|
- baths - beds |
show details | |

|
#33
Moluf St
Dekalb, IL 60115
|
- sq. feet
|
- baths - beds |
show details | |

|
#34
Heatherington Pl
Elgin, IL 60124
|
- sq. feet
|
- baths - beds |
show details | |

|
#35
Terney Ln
Geneva, IL 60134
|
- sq. feet
|
- baths - beds |
show details | |

|
#36
Locust St
Elburn, IL 60119
|
- sq. feet
|
- baths - beds |
show details | |

|
#37
W Plank Rd
Hampshire, IL 60140
|
- sq. feet
|
- baths - beds |
show details | |

|
#38
Hanson Ridge Dr
Saint Charles, IL 60175
|
- sq. feet
|
- baths - beds |
show details | |

|
#39
Paddock Ln
Saint Charles, IL 60175
|
- sq. feet
|
- baths - beds |
show details | |

|
#40
Katie Dr
Big Rock, IL 60511
|
- sq. feet
|
- baths - beds |
show details |
| Photo | Address | Area | Beds / Baths | Price | Details |
|---|---|---|---|---|---|

|
#41
Juniper Ct
Saint Charles, IL 60175
|
- sq. feet
|
- baths - beds |
show details | |

|
#42
S 6th St
Kirkland, IL 60146
|
- sq. feet
|
- baths - beds |
show details | |

|
#43
Brown Farm Ct
Saint Charles, IL 60175
|
- sq. feet
|
- baths - beds |
show details | |

|
#44
Hunters Hill Dr
Saint Charles, IL 60175
|
- sq. feet
|
- baths - beds |
show details | |

|
#45
Kendall Rd
Elgin, IL 60124
|
- sq. feet
|
- baths - beds |
show details | |

|
#46
Lance Ave
Elburn, IL 60119
|
- sq. feet
|
- baths - beds |
show details | |

|
#47
Meadowsweet Dr
Elburn, IL 60119
|
- sq. feet
|
- baths - beds |
show details | |

|
#48
W Meadowdale Cir
Hampshire, IL 60140
|
- sq. feet
|
- baths - beds |
show details | |

|
#49
Florence St
Hampshire, IL 60140
|
- sq. feet
|
- baths - beds |
show details | |

|
Check over 1 million property listings on Foreclosure.com!
|
browse all offers | |||

Latest news about housing in Cortland, IL collected exclusively by city-data.com from local newspapers, TV, and radio stations

 | buying a condo near east humboldt / logan? (3 replies) |
| Park Ridge Real Estate Market (4 replies) |
| Condo on cortland (9 replies) |
| Does Anyone Have Any Info on Neumann Homes Going Belly Up?! (46 replies) |
| Is there a bad part of Freeport, Il? (38 replies) |
| Cheapest city to live in for one person? (15 replies) |

Median year apartment built: 1986
Household type by relationship:
Households: 4,712- Male householders: 991 (189 living alone), Female householders: 673 (112 living alone)
772 spouses (772 opposite-sex spouses), 471 unmarried partners, (471 opposite-sex unmarried partners), 1,288 children (1,215 natural, 0 adopted, 72 stepchildren), 214 grandchildren, 22 brothers or sisters, 39 parents, 0 foster children, 55 other relatives, 182 non-relatives
Size of family households: 384 2-persons, 254 3-persons, 184 4-persons, 144 5-persons, 83 6-persons, 69 7-or-more-persons.
Size of nonfamily households: 275 1-person, 231 2-persons.
511 married couples with children.
242 single-parent households (115 men, 127 women).
88.2% of residents of Cortland speak English at home.
9.6% of residents speak Spanish at home (73% speak English very well, 19% speak English well, 8% speak English not well).
1.0% of residents speak other Indo-European language at home (46% speak English very well, 54% speak English not well).
Foreign born population: 208 (4.4%)
(44.2% of them are naturalized citizens)
| Here: | 5.8 |
| State: | 6.4 |
| Here: | 4.9 |
| State: | 4.1 |

- Bedrooms in owner-occupied houses and condos in Cortland, Illinois
- 0no bedroom
- 01 bedroom
- 842 bedrooms
- 8063 bedrooms
- 2904 bedrooms
- 395+ bedrooms

- Bedrooms in renter-occupied apartments in Cortland, Illinois
- 0no bedroom
- 81 bedroom
- 1982 bedrooms
- 2433 bedrooms
- 54 bedrooms
- 05+ bedrooms

- Cars and other vehicles available in Cortland in owner-occupied houses/condos
- 27no vehicle
- 2641 vehicle
- 5342 vehicles
- 2583 vehicles
- 884 vehicles
- 485+ vehicles

- Cars and other vehicles available in Cortland in renter-occupied apartments
- 0no vehicle
- 2191 vehicle
- 1782 vehicles
- 573 vehicles
- 04 vehicles
- 05+ vehicles

- Rooms in owner-occupied houses in Cortland, Illinois
- 01 room
- 02 rooms
- 03 rooms
- 1004 rooms
- 3045 rooms
- 3246 rooms
- 1647 rooms
- 1738 rooms
- 1549+ rooms

- Rooms in renter-occupied apartments in Cortland, Illinois
- 01 room
- 02 rooms
- 543 rooms
- 554 rooms
- 2205 rooms
- 686 rooms
- 07 rooms
- 08 rooms
- 579+ rooms


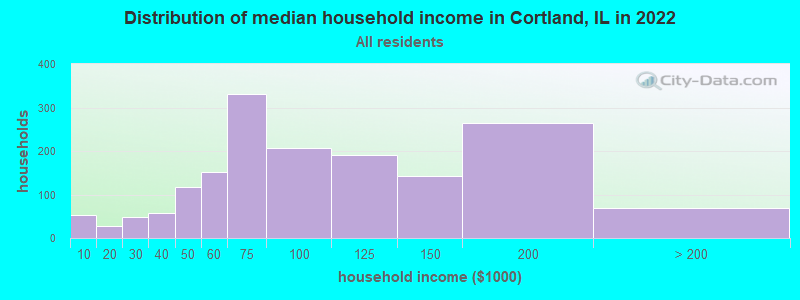
Cortland, IL household income distribution

- 53Less than $10,000
- 28$10,000 to $19,999
- 49$20,000 to $29,999
- 57$30,000 to $39,999
- 117$40,000 to $49,999
- 152$50,000 to $59,999
- 330$60,000 to $74,999
- 207$75,000 to $99,999
- 190$100,000 to $124,999
- 142$125,000 to $149,999
- 264$150,000 to $199,999
- 70$200,000 or more
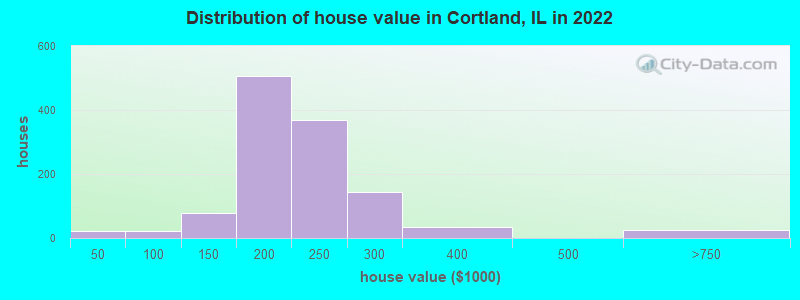
Home value of owner - occupied houses in 2022 in Cortland, IL
-
- 21Less than $10,000
- 20$80,000 to $89,999
- 2$90,000 to $99,999
- 13$100,000 to $124,999
- 62$125,000 to $149,999
- 289$150,000 to $174,999
- 216$175,000 to $199,999
- 369$200,000 to $249,999
- 145$250,000 to $299,999
- 35$300,000 to $399,999
- 25$500,000 to $749,999
Rent paid by renters in 2022 in Cortland, IL
-
- 5$750 to $799
- 19$800 to $899
- 19$900 to $999
- 75$1,000 to $1,249
- 202$1,250 to $1,499
- 44$1,500 to $1,999
- 10No cash rent


Percentage of workers working in this county: 51.7%
Number of people working at home: 160 (5.7% of all workers)
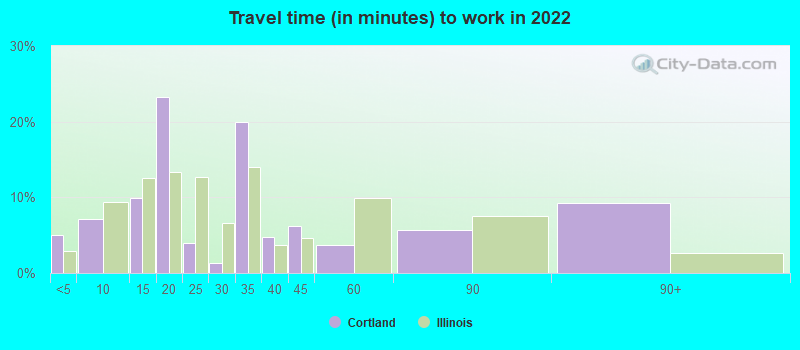
Travel time to work (commute)
- Less than 5 minutes: 6
- 5 to 9 minutes: 226
- 10 to 14 minutes: 574
- 15 to 19 minutes: 352
- 20 to 24 minutes: 163
- 25 to 29 minutes: 70
- 30 to 34 minutes: 138
- 35 to 39 minutes: 54
- 40 to 44 minutes: 303
- 45 to 59 minutes: 310
- 60 to 89 minutes: 241
- 90 or more minutes: 63
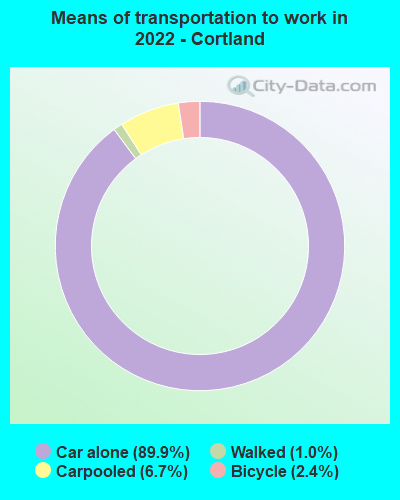
Means of transportation to work:
- Drove a car alone: 418 (72.2%)
- Carpooled: 31 (5.4%)
- Bicycle: 9 (1.6%)
- Walked: 4 (0.7%)
- Worked at home: 217 (37.5%)

- Unemployment by race in 2022
- Unemployment rate for White non-Hispanic residents
- 7.5%Males
- 0.6%Females

- Year of entry for the foreign-born population in Cortland, Illinois
- 102010 or later
- 182000 to 2009
- 1731990 to 1999
- 241980 to 1989
- 231970 to 1979
- 13Before 1970

First ancestries reported:
- German: 370 (18.8%)
- Irish: 156 (7.9%)
- American: 107 (5.5%)
- Polish: 97 (4.9%)
- Dutch: 87 (4.4%)
- English: 78 (4.0%)
- Eastern European: 62 (3.2%)
- Swedish: 41 (2.1%)
- Norwegian: 36 (1.8%)
- European: 33 (1.7%)
- Italian: 29 (1.5%)
- Slovak: 24 (1.2%)
- Greek: 20 (1.0%)
- Belgian: 12 (0.6%)
- Czechoslovakian: 7 (0.4%)
- Scandinavian: 7 (0.4%)
- Scottish: 7 (0.4%)
Most common places of birth for foreign-born residents (%):
| Cortland: | 84.4% (195) |
| Illinois: | 0.9% (16,553) |
| Cortland: | 24.2% (56) |
| Illinois: | 34.7% (626,958) |
| Cortland: | 5.6% (13) |
| Illinois: | 0.0% (775) |
| Cortland: | 4.8% (11) |
| Illinois: | 1.0% (18,753) |
| Cortland: | 3.9% (9) |
| Illinois: | 0.2% (3,363) |
Place of birth for U.S.-born residents:
- This state: 3,849
- Other state: 664
- Northeast: 87
- Midwest: 494
- South: 99
- West: 11
83.1% of Cortland residents lived in the same house 1 years ago.
Out of people who lived in different houses, 44.4% lived in this county.
Out of people who lived in different counties, 100.0% lived in Illinois.
| Cortland: | 83.1% |
| State average: | 88.3% |
Education attainment for males 25 years and older:
- No schooling: 4
- Nursery to 4th grade: 0
- 5th and 6th grade: 0
- 7th and 8th grade: 77
- 9th grade: 0
- 10th grade: 14
- 11th grade: 68
- 12th grade, no diploma: 44
- High school graduate (or equivalency): 391
- Less than 1 year of college: 118
- Some college more than 1 year, no degree: 398
- Associate degree: 92
- Bachelor's degree: 273
- Master's degree: 196
- Professional school degree: 0
- Doctorate degree: 30

Education attainment for females 25 years and older:
- No schooling: 13
- Nursery to 4th grade: 0
- 5th and 6th grade: 0
- 7th and 8th grade: 0
- 9th grade: 0
- 10th grade: 0
- 11th grade: 18
- 12th grade, no diploma: 8
- High school graduate (or equivalency): 544
- Less than 1 year of college: 133
- Some college more than 1 year, no degree: 159
- Associate degree: 259
- Bachelor's degree: 286
- Master's degree: 138
- Professional school degree: 0
- Doctorate degree: 7


Housing units in structures:
- One, detached: 1,092
- One, attached: 288
- Two: 48
- 5 to 9: 232
- 10 to 19: 72
House/condo owner moved in on average 11 years ago
Renter moved in on average 1 years ago

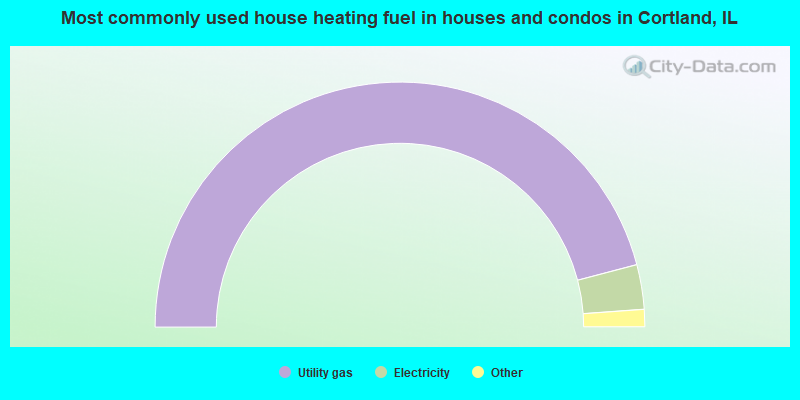
- 92.0%Utility gas
- 5.9%Electricity
- 1.9%Fuel oil, kerosene, etc.
- 0.2%Bottled, tank, or LP gas
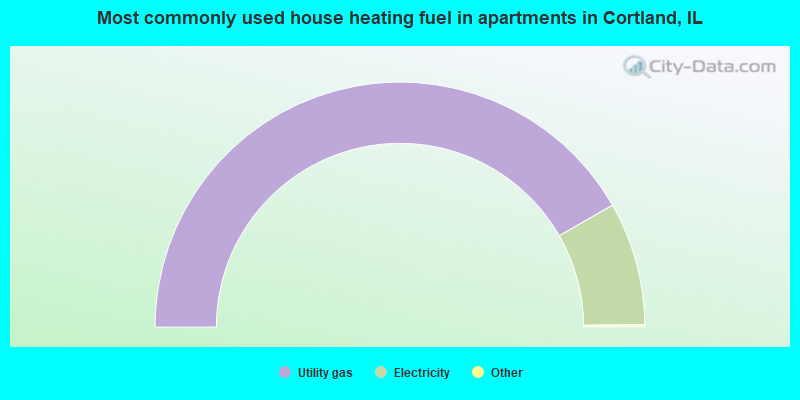
- 83.7%Utility gas
- 16.3%Electricity
Private vs. public school enrollment:
| Here: | 12.1% |
| Illinois: | 13.3% |
| Here: | 28.9% |
| Illinois: | 9.9% |
| Here: | 15.7% |
| Illinois: | 27.4% |


