Housing density: 3,050 houses/condos per square mile
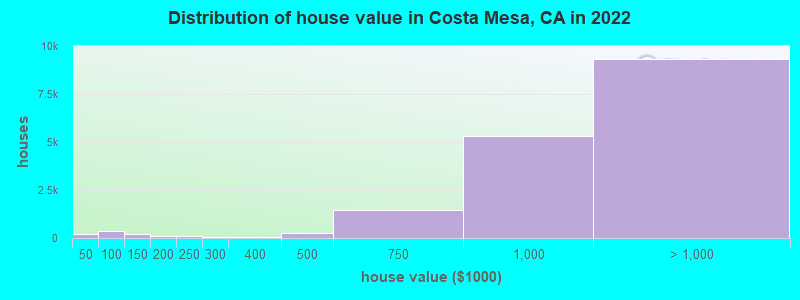
Median price asked for vacant for-sale houses and condos in 2022: $919,216.
Median contract rent in 2022: over $2,000 (lower quartile is $1,749, upper quartile is over $2,000)
Median rent asked for vacant for-rent units in 2022: $4,214
Median gross rent in Costa Mesa, CA in 2022: over $2,000
Housing units in Costa Mesa with a mortgage: 11,990 (930 second mortgage, 115 home equity loan, 815 both second mortgage and home equity loan) Houses without a mortgage: 43
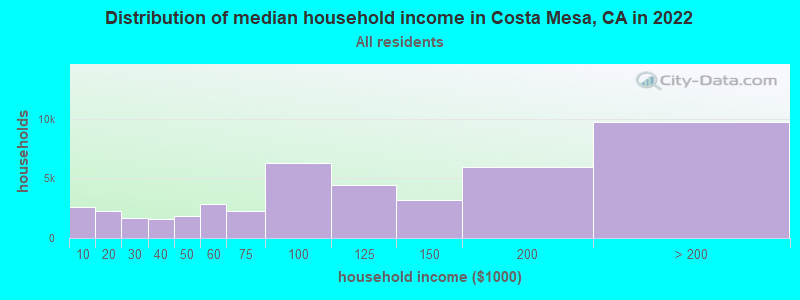
Median household income for houses/condos with a mortgage: $161,904
Median household income for apartments without a mortgage: $79,953
10,173 married couples with children.
4,002 single-parent households (1,459 men, 2,543 women).
61.3% of residents of Costa Mesa speak English at home.
26.9% of residents speak Spanish at home (62% speak English very well, 16% speak English well, 13% speak English not well, 8% don't speak English at all).
3.9% of residents speak other Indo-European language at home (79% speak English very well, 13% speak English well, 5% speak English not well, 3% don't speak English at all).
6.5% of residents speak Asian or Pacific Island language at home (66% speak English very well, 19% speak English well, 12% speak English not well, 3% don't speak English at all).
0.6% of residents speak other language at home (85% speak English very well, 4% speak English well, 11% speak English not well).
Foreign born population: 21,153 (19.3%)
(38.1% of them are naturalized citizens)
Percentage of workers working in this county: 92.9% Number of people working at home: 14,039 (21.1% of all workers)
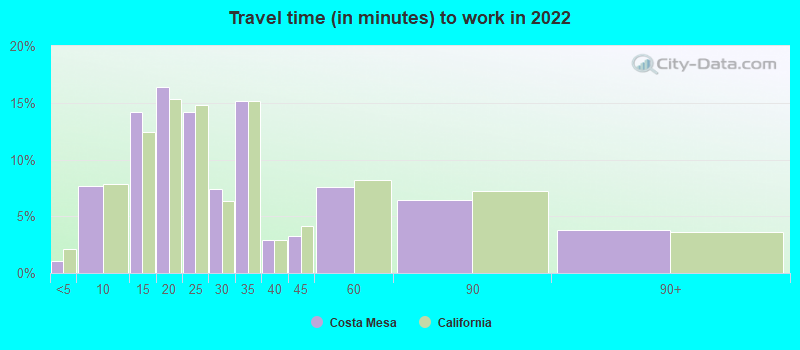
Travel time to work (commute)
Less than 5 minutes: 947
5 to 9 minutes: 4,237
10 to 14 minutes: 11,363
15 to 19 minutes: 11,026
20 to 24 minutes: 10,354
25 to 29 minutes: 2,401
30 to 34 minutes: 6,813
35 to 39 minutes: 789
40 to 44 minutes: 795
45 to 59 minutes: 1,763
60 to 89 minutes: 1,894
90 or more minutes: 209
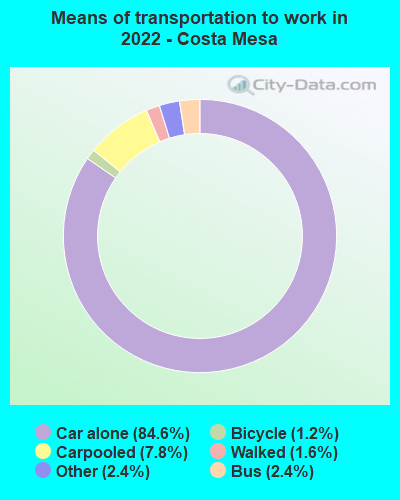
Means of transportation to work:
Drove a car alone: 60,947 (70.8%)
Carpooled: 5,589 (6.5%)
Bus: 1,697 (2.0%)
Long-distance train or commuter rail: 32 (0.0%)
Taxi: 1,723 (2.0%)
Bicycle: 873 (1.0%)
Walked: 1,151 (1.3%)
Worked at home: 14,039 (16.3%)
Unemployment by race in 2022
Unemployment rate for White non-Hispanic residents
3.2%Males
3.6%Females
Unemployment rate for Black residents
10.4%Males
3.9%Females
Unemployment rate for American Indian and Alaska Native residents
6.0%Females
Unemployment rate for Asian residents
1.1%Males
2.2%Females
Unemployment rate for other race residents
2.6%Males
5.5%Females
Unemployment rate for two or more race residents
2.5%Males
3.9%Females
Unemployment rate for Hispanic or Latino residents
1.1%Males
2.1%Females
Year of entry for the foreign-born population in Costa Mesa, California
5,0402010 or later
6,1482000 to 2009
5,5781990 to 1999
10,0071980 to 1989
4,2591970 to 1979
2,492Before 1970
First ancestries reported:
English: 2,881 (4.8%)
American: 2,857 (4.7%)
Irish: 2,742 (4.6%)
German: 2,721 (4.5%)
European: 2,526 (4.2%)
Italian: 1,770 (2.9%)
Scottish: 589 (1.0%)
Polish: 415 (0.7%)
Iranian: 400 (0.7%)
French: 382 (0.6%)
Ukrainian: 370 (0.6%)
Swedish: 335 (0.6%)
Norwegian: 311 (0.5%)
Eastern European: 274 (0.5%)
Scandinavian: 270 (0.4%)
Egyptian: 227 (0.4%)
Yugoslavian: 215 (0.4%)
Northern European: 208 (0.3%)
Turkish: 198 (0.3%)
Dutch: 178 (0.3%)
Welsh: 171 (0.3%)
Brazilian: 170 (0.3%)
Czech: 167 (0.3%)
Russian: 160 (0.3%)
Romanian: 156 (0.3%)
Armenian: 155 (0.3%)
French Canadian: 144 (0.2%)
Canadian: 136 (0.2%)
Croatian: 95 (0.2%)
British: 93 (0.2%)
Portuguese: 86 (0.1%)
Greek: 77 (0.1%)
Lebanese: 77 (0.1%)
Afghan: 76 (0.1%)
Danish: 63 (0.1%)
Scotch-Irish: 60 (0.10%)
Arab: 58 (0.10%)
African: 56 (0.09%)
Moroccan: 50 (0.08%)
Slovak: 48 (0.08%)
Hungarian: 47 (0.08%)
Jordanian: 41 (0.07%)
Finnish: 40 (0.07%)
Lithuanian: 35 (0.06%)
Slavic: 34 (0.06%)
Austrian: 31 (0.05%)
West Indian: 24 (0.04%)
Belgian: 23 (0.04%)
Icelander: 23 (0.04%)
Iraqi: 17 (0.03%)
South African: 15 (0.02%)
Serbian: 15 (0.02%)
Palestinian: 14 (0.02%)
Czechoslovakian: 13 (0.02%)
Ethiopian: 13 (0.02%)
Haitian: 13 (0.02%)
Syrian: 11 (0.02%)
Swiss: 10 (0.02%)
Bulgarian: 8 (0.01%)
Estonian: 7 (0.01%)
Australian: 7 (0.01%)
Belizean: 5 (0.01%)
Israeli: 4 (0.01%)
Most common places of birth for foreign-born residents (%):
Mexico
Costa Mesa:
44.1% (11,606)
California:
37.2% (3,881,193)
Vietnam
Costa Mesa:
7.6% (2,008)
California:
4.9% (512,335)
Philippines
Costa Mesa:
4.4% (1,146)
California:
7.8% (818,297)
Guatemala
Costa Mesa:
4.0% (1,054)
California:
2.8% (290,436)
El Salvador
Costa Mesa:
3.8% (992)
California:
4.2% (440,287)
Japan
Costa Mesa:
2.5% (669)
California:
1.0% (103,575)
Iran
Costa Mesa:
2.4% (634)
California:
2.0% (206,004)
Canada
Costa Mesa:
2.3% (593)
California:
1.2% (127,477)
China, excluding Hong Kong and Taiwan
Costa Mesa:
2.0% (515)
California:
6.6% (684,672)
India
Costa Mesa:
1.9% (509)
California:
5.2% (539,184)
Colombia
Costa Mesa:
1.7% (446)
California:
0.5% (55,249)
Korea
Costa Mesa:
1.6% (410)
California:
3.0% (315,248)
Place of birth for U.S.-born residents:
This state: 68,503
Other state: 18,800
Northeast: 4,872
Midwest: 5,601
South: 3,979
West: 4,348
87.5% of Costa Mesa residents lived in the same house 1 years ago. Out of people who lived in different houses, 41.7% lived in this county. Out of people who lived in different counties, 84.4% lived in California.
Costa Mesa:
87.5%
State average:
88.9%
Education attainment for males 25 years and older:
No schooling: 2,421
Nursery to 4th grade: 321
5th and 6th grade: 636
7th and 8th grade: 122
9th grade: 985
10th grade: 154
11th grade: 642
12th grade, no diploma: 972
High school graduate (or equivalency): 7,465
Less than 1 year of college: 2,004
Some college more than 1 year, no degree: 6,432
Associate degree: 2,798
Bachelor's degree: 12,152
Master's degree: 3,207
Professional school degree: 1,723
Doctorate degree: 971
Education attainment for females 25 years and older:
No schooling: 538
Nursery to 4th grade: 134
5th and 6th grade: 665
7th and 8th grade: 265
9th grade: 561
10th grade: 0
11th grade: 213
12th grade, no diploma: 712
High school graduate (or equivalency): 5,395
Less than 1 year of college: 2,366
Some college more than 1 year, no degree: 5,674
Associate degree: 3,120
Bachelor's degree: 14,843
Master's degree: 3,707
Professional school degree: 1,019
Doctorate degree: 147
Housing units in structures:
One, detached: 19,279
One, attached: 4,287
Two: 2,013
3 or 4: 4,743
5 to 9: 5,026
10 to 19: 3,210
20 to 49: 1,855
50 or more: 6,224
Mobile homes: 936
Boats, RVs, vans, etc.: 104
Median worth of mobile homes: $119,718
Housing units lacking complete plumbing facilities in 2022: 0.3%
Housing units lacking complete kitchen facilities in 2022: 0.8%
House/condo owner moved in on average 13 years ago