Country Club, CA (California) Houses and Residents
| Country Club: | $388,165 |
| California: | $715,900 |
Total population: 9,379 (All urban)
Houses: 3,851 (3,427 occupied: 2,307 owner occupied, 1,088 renter occupied)
| % of renters here: | 32% |
| State: | 44% |
Housing density: 2,015 houses/condos per square mile
Median price asked for vacant for-sale houses and condos in 2022: $436,344.
Median contract rent in 2022: $1,247 (lower quartile is $1,048, upper quartile is $1,664)
Median rent asked for vacant for-rent units in 2022: $1,457
Median gross rent in Country Club, CA in 2022: $1,600
Housing units in Country Club with a mortgage: 1,745 (169 second mortgage, 0 home equity loan, 184 both second mortgage and home equity loan)
Houses without a mortgage: 11
Median household income for houses/condos with a mortgage: $82,396
Median household income for apartments without a mortgage: $70,724
Median monthly housing costs: $1,631
Compare current foreclosures near Country Club, CA:
| Photo | Address | Area | Beds / Baths | Price | Details |
|---|---|---|---|---|---|

|
#1
Quail Lakes Dr Apt 126
Stockton, CA 95207
|
612 sq. feet
|
1 baths 1 beds |
$179,000
|
show details |

|
#2
Vineyard Dr
Lodi, CA 95240
|
1,225 sq. feet
|
2 baths 3 beds |
$370,000
|
show details |

|
#3
E Bianchi Rd Apt 2
Stockton, CA 95207
|
840 sq. feet
|
1 baths 2 beds |
$183,000
|
show details |

|
#4
W Benjamin Holt Dr
Stockton, CA 95219
|
926 sq. feet
|
1 baths 2 beds |
show details | |

|
#5
Almond Dr Apt 84
Lodi, CA 95240
|
1,064 sq. feet
|
1 baths 2 beds |
show details | |

|
#6
E Washington St
Stockton, CA 95215
|
1,064 sq. feet
|
2 baths 3 beds |
show details | |

|
#7
Boston Ave
Stockton, CA 95206
|
1,294 sq. feet
|
2 baths 4 beds |
show details | |

|
#8
Edgeview Way
Discovery Bay, CA 94505
|
2,585 sq. feet
|
3 baths 4 beds |
show details | |

|
#9
Ashburn Dr
Stockton, CA 95209
|
1,835 sq. feet
|
2 baths 4 beds |
show details | |

|
#10
Christina Ave
Stockton, CA 95204
|
- sq. feet
|
2 baths 3 beds |
show details |
| Photo | Address | Area | Beds / Baths | Price | Details |
|---|---|---|---|---|---|

|
#11
Laguna Dr
Tracy, CA 95376
|
1,577 sq. feet
|
2 baths 3 beds |
show details | |

|
#12
Plumas Dr.
Lathrop, CA 95330
|
1,829 sq. feet
|
2 baths 3 beds |
show details | |

|
#13
Myran Ave
Stockton, CA 95205
|
1,025 sq. feet
|
1 baths 2 beds |
show details | |

|
#14
Shirleen Dr
Stockton, CA 95209
|
2,837 sq. feet
|
3 baths 4 beds |
show details | |

|
#15
Fargo St
Stockton, CA 95204
|
1,776 sq. feet
|
2 baths 4 beds |
show details | |

|
#16
Shorelake Ct
Stockton, CA 95219
|
2,668 sq. feet
|
3 baths 4 beds |
show details | |

|
#17
Bristol Ave
Stockton, CA 95204
|
1,742 sq. feet
|
1 baths 3 beds |
show details | |

|
#18
Section Ave
Stockton, CA 95215
|
1,038 sq. feet
|
1 baths 3 beds |
show details | |

|
#19
W Poplar St
Stockton, CA 95203
|
1,335 sq. feet
|
1 baths 2 beds |
show details | |

|
#20
Creek Trail Cir
Stockton, CA 95209
|
2,135 sq. feet
|
3 baths 5 beds |
show details |
| Photo | Address | Area | Beds / Baths | Price | Details |
|---|---|---|---|---|---|

|
#21
Clinton Dr
Stockton, CA 95210
|
1,503 sq. feet
|
2 baths 3 beds |
show details | |

|
#22
W Harding Way
Stockton, CA 95204
|
2,029 sq. feet
|
2 baths 4 beds |
show details | |

|
#23
Betty Mae Ct
Stockton, CA 95212
|
2,468 sq. feet
|
2 baths 4 beds |
show details | |

|
#24
New Melones Cir
Discovery Bay, CA 94505
|
2,562 sq. feet
|
3 baths 4 beds |
show details | |

|
#25
N Country Club Blvd
Stockton, CA 95204
|
1,615 sq. feet
|
2 baths 3 beds |
show details | |

|
#26
Fern Dell Ln
Manteca, CA 95336
|
1,343 sq. feet
|
2 baths 4 beds |
show details | |

|
#27
Atlanta Cir
Stockton, CA 95219
|
- sq. feet
|
2 baths 3 beds |
show details | |

|
#28
Poplar Dr
Oakley, CA 94561
|
3,341 sq. feet
|
3 baths 4 beds |
show details | |

|
#29
Clipper Ln
Stockton, CA 95204
|
1,402 sq. feet
|
2 baths 3 beds |
show details | |

|
#30
E Robinhood Dr
Stockton, CA 95207
|
960 sq. feet
|
1 baths 3 beds |
show details |
| Photo | Address | Area | Beds / Baths | Price | Details |
|---|---|---|---|---|---|

|
#31
Green Plz
Lathrop, CA 95330
|
3,297 sq. feet
|
2 baths 4 beds |
show details | |

|
#32
Prairie Dunes Dr
Lathrop, CA 95330
|
1,714 sq. feet
|
3 baths 3 beds |
show details | |

|
#33
E Roosevelt St
Stockton, CA 95205
|
- sq. feet
|
1 baths 3 beds |
show details | |

|
#34
W Brannan Island Rd
Isleton, CA 95641
|
- sq. feet
|
2 baths 3 beds |
show details | |

|
#35
E Taylor St
Stockton, CA 95205
|
960 sq. feet
|
2 baths 3 beds |
show details | |

|
#36
Herndon Pl
Stockton, CA 95219
|
- sq. feet
|
1 baths 3 beds |
show details | |

|
#37
Montaro Ln
Stockton, CA 95212
|
2,585 sq. feet
|
4 baths 5 beds |
show details | |

|
#38
S Thelma Ave
Stockton, CA 95215
|
1,092 sq. feet
|
1 baths 3 beds |
show details | |

|
#39
Niobrara Ave
Stockton, CA 95206
|
1,669 sq. feet
|
2 baths 3 beds |
show details | |

|
#40
S School St
Lodi, CA 95240
|
1,164 sq. feet
|
1 baths 2 beds |
show details |
| Photo | Address | Area | Beds / Baths | Price | Details |
|---|---|---|---|---|---|

|
#41
Rubicon Ave
Stockton, CA 95219
|
2,668 sq. feet
|
3 baths 4 beds |
show details | |

|
#42
Loki Ln
Stockton, CA 95219
|
1,665 sq. feet
|
2 baths 3 beds |
show details | |

|
#43
Avalon Dr
Stockton, CA 95215
|
1,221 sq. feet
|
1 baths 3 beds |
show details | |

|
#44
Pleasant Valley Cir
Stockton, CA 95209
|
1,975 sq. feet
|
2 baths 4 beds |
show details | |

|
#45
Agusta Dr
Lathrop, CA 95330
|
1,714 sq. feet
|
2 baths 4 beds |
show details | |

|
#46
Finch Run
Lodi, CA 95240
|
1,440 sq. feet
|
2 baths 3 beds |
show details | |

|
#47
Vancouver Cir
Stockton, CA 95209
|
2,143 sq. feet
|
3 baths 4 beds |
show details | |

|
#48
Pleasant Valley Cir
Stockton, CA 95209
|
1,465 sq. feet
|
2 baths 3 beds |
show details | |

|
#49
Melones Way
Stockton, CA 95219
|
1,627 sq. feet
|
2 baths 3 beds |
show details | |

|
Check over 1 million property listings on Foreclosure.com!
|
browse all offers | |||


Median year apartment built: 1955
Household type by relationship:
Households: 9,857- Male householders: 1,588 (298 living alone), Female householders: 1,803 (571 living alone)
1,838 spouses (1,775 opposite-sex spouses), 181 unmarried partners, (181 opposite-sex unmarried partners), 3,020 children (2,717 natural, 268 adopted, 34 stepchildren), 142 grandchildren, 127 brothers or sisters, 311 parents, 0 foster children, 207 other relatives, 613 non-relatives
- In group quarters: 22
Size of family households: 879 2-persons, 507 3-persons, 541 4-persons, 251 5-persons, 180 6-persons, 25 7-or-more-persons.
Size of nonfamily households: 888 1-person, 96 2-persons, 18 4-persons, 22 7-or-more-persons.
1,622 married couples with children.
140 single-parent households (42 men, 98 women).
69.0% of residents of Country Club speak English at home.
25.4% of residents speak Spanish at home (61% speak English very well, 15% speak English well, 14% speak English not well, 10% don't speak English at all).
1.5% of residents speak other Indo-European language at home (85% speak English very well, 15% speak English not well).
2.9% of residents speak Asian or Pacific Island language at home (45% speak English very well, 26% speak English well, 28% speak English not well).
Foreign born population: 1,496 (15.2%)
(43.4% of them are naturalized citizens)
| Here: | 5.4 |
| State: | 6.0 |
| Here: | 4.9 |
| State: | 3.9 |

- Bedrooms in owner-occupied houses and condos in Country Club, California
- 7no bedroom
- 241 bedroom
- 5322 bedrooms
- 1,5663 bedrooms
- 1514 bedrooms
- 285+ bedrooms

- Bedrooms in renter-occupied apartments in Country Club, California
- 13no bedroom
- 411 bedroom
- 4772 bedrooms
- 4903 bedrooms
- 674 bedrooms
- 05+ bedrooms

- Cars and other vehicles available in Country Club in owner-occupied houses/condos
- 164no vehicle
- 5821 vehicle
- 7532 vehicles
- 4813 vehicles
- 1564 vehicles
- 1725+ vehicles

- Cars and other vehicles available in Country Club in renter-occupied apartments
- 87no vehicle
- 4321 vehicle
- 4182 vehicles
- 1363 vehicles
- 164 vehicles
- 05+ vehicles

- Rooms in owner-occupied houses in Country Club, California
- 71 room
- 02 rooms
- 323 rooms
- 2714 rooms
- 8885 rooms
- 6176 rooms
- 2387 rooms
- 2228 rooms
- 329+ rooms

- Rooms in renter-occupied apartments in Country Club, California
- 131 room
- 112 rooms
- 293 rooms
- 3324 rooms
- 3625 rooms
- 1496 rooms
- 1247 rooms
- 328 rooms
- 379+ rooms


Country Club, CA household income distribution

- 156Less than $10,000
- 177$10,000 to $19,999
- 192$20,000 to $29,999
- 312$30,000 to $39,999
- 265$40,000 to $49,999
- 286$50,000 to $59,999
- 188$60,000 to $74,999
- 522$75,000 to $99,999
- 493$100,000 to $124,999
- 272$125,000 to $149,999
- 308$150,000 to $199,999
- 217$200,000 or more

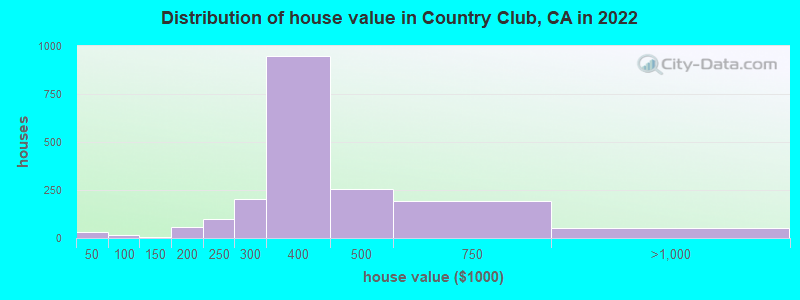
Home value of owner - occupied houses in 2022 in Country Club, CA
-
- 9Less than $10,000
- 7$25,000 to $29,999
- 16$40,000 to $49,999
- 5$125,000 to $149,999
- 55$150,000 to $174,999
- 100$200,000 to $249,999
- 204$250,000 to $299,999
- 950$300,000 to $399,999
- 254$400,000 to $499,999
- 195$500,000 to $749,999
- 36$750,000 to $999,999
- 15$1,000,000 to $1,499,999
Rent paid by renters in 2022 in Country Club, CA
-
- 21$700 to $749
- 18$750 to $799
- 45$800 to $899
- 82$900 to $999
- 318$1,000 to $1,249
- 104$1,250 to $1,499
- 263$1,500 to $1,999
- 39$2,000 to $2,499
- 12$3,500 or more
- 77No cash rent


Percentage of workers working in this county: 84.6%
Number of people working at home: 278 (6.3% of all workers)
Travel time to work (commute)
- Less than 5 minutes: 35
- 5 to 9 minutes: 100
- 10 to 14 minutes: 936
- 15 to 19 minutes: 785
- 20 to 24 minutes: 745
- 25 to 29 minutes: 250
- 30 to 34 minutes: 464
- 35 to 39 minutes: 0
- 40 to 44 minutes: 74
- 45 to 59 minutes: 132
- 60 to 89 minutes: 251
- 90 or more minutes: 408
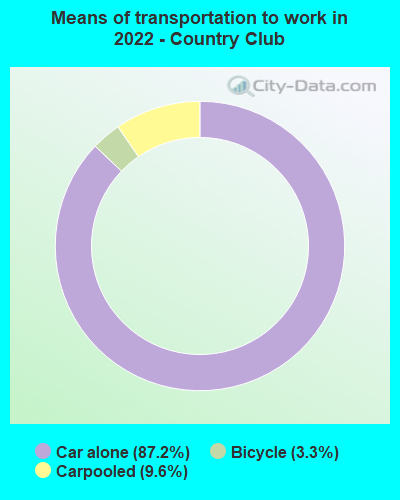
Means of transportation to work:
- Drove a car alone: 438 (68.2%)
- Carpooled: 47 (7.3%)
- Bicycle: 12 (1.9%)
- Worked at home: 244 (38.0%)

- Unemployment by race in 2022
- Unemployment rate for White non-Hispanic residents
- 15.1%Males
- 3.4%Females
- Unemployment rate for Black residents
- 2.9%Males
- 10.9%Females
- Unemployment rate for Asian residents
- 3.4%Males
- Unemployment rate for other race residents
- 3.1%Males
- 15.8%Females
- Unemployment rate for two or more race residents
- 8.3%Males
- 4.0%Females
- Unemployment rate for Hispanic or Latino residents
- 5.4%Males
- 8.8%Females

- Year of entry for the foreign-born population in Country Club, California
- 5112010 or later
- 3222000 to 2009
- 1971990 to 1999
- 2821980 to 1989
- 1841970 to 1979
- 248Before 1970
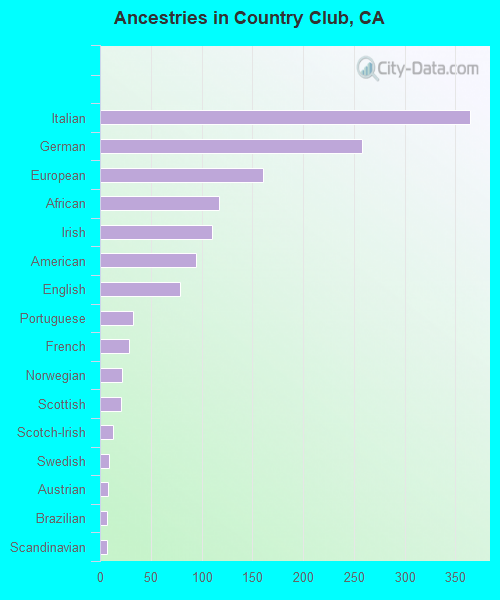
First ancestries reported:
- Italian: 365 (6.4%)
- German: 258 (4.5%)
- European: 161 (2.8%)
- African: 117 (2.1%)
- Irish: 110 (1.9%)
- American: 95 (1.7%)
- English: 79 (1.4%)
- Portuguese: 33 (0.6%)
- French: 29 (0.5%)
- Norwegian: 22 (0.4%)
- Scottish: 21 (0.4%)
- Scotch-Irish: 13 (0.2%)
- Swedish: 9 (0.2%)
- Austrian: 8 (0.1%)
- Brazilian: 7 (0.1%)
- Scandinavian: 7 (0.1%)
Most common places of birth for foreign-born residents (%):
| Country Club: | 65.8% (918) |
| California: | 37.2% (3,881,193) |
| Country Club: | 9.5% (132) |
| California: | 7.8% (818,297) |
| Country Club: | 6.3% (88) |
| California: | 4.2% (440,287) |
| Country Club: | 6.2% (87) |
| California: | 0.5% (49,399) |
| Country Club: | 2.1% (30) |
| California: | 3.0% (315,248) |
| Country Club: | 1.8% (25) |
| California: | 6.6% (684,672) |
| Country Club: | 1.6% (23) |
| California: | 4.9% (512,335) |
Place of birth for U.S.-born residents:
- This state: 7,462
- Other state: 687
- Northeast: 114
- Midwest: 214
- South: 155
- West: 205
95.6% of Country Club residents lived in the same house 1 years ago.
Out of people who lived in different houses, 40.1% lived in this county.
Out of people who lived in different counties, 70.0% lived in California.
| Country Club: | 95.6% |
| State average: | 88.9% |
Education attainment for males 25 years and older:
- No schooling: 189
- Nursery to 4th grade: 9
- 5th and 6th grade: 108
- 7th and 8th grade: 2
- 9th grade: 14
- 10th grade: 72
- 11th grade: 49
- 12th grade, no diploma: 160
- High school graduate (or equivalency): 1,312
- Less than 1 year of college: 310
- Some college more than 1 year, no degree: 418
- Associate degree: 214
- Bachelor's degree: 296
- Master's degree: 116
- Professional school degree: 29
- Doctorate degree: 0

Education attainment for females 25 years and older:
- No schooling: 153
- Nursery to 4th grade: 49
- 5th and 6th grade: 26
- 7th and 8th grade: 51
- 9th grade: 34
- 10th grade: 17
- 11th grade: 40
- 12th grade, no diploma: 37
- High school graduate (or equivalency): 1,389
- Less than 1 year of college: 220
- Some college more than 1 year, no degree: 365
- Associate degree: 559
- Bachelor's degree: 463
- Master's degree: 227
- Professional school degree: 8
- Doctorate degree: 38


Housing units in structures:
- One, detached: 3,604
- One, attached: 109
- Two: 26
- 3 or 4: 24
- 5 to 9: 30
- 20 to 49: 42
- Boats, RVs, vans, etc.: 13
Housing units lacking complete kitchen facilities in 2022: 1.3%
House/condo owner moved in on average 9 years ago
Renter moved in on average 4 years ago

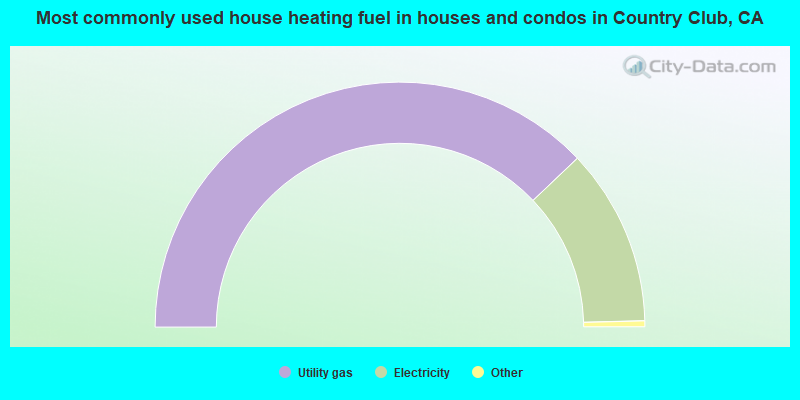
- 75.9%Utility gas
- 23.4%Electricity
- 0.5%Solar energy
- 0.2%Wood
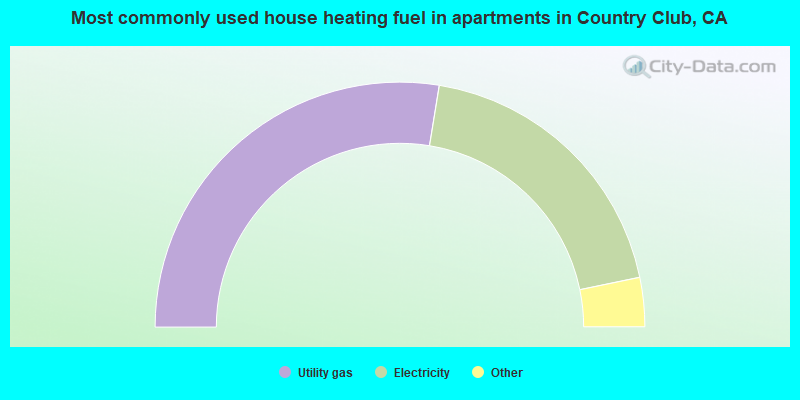
- 55.2%Utility gas
- 38.4%Electricity
- 3.4%Solar energy
- 2.7%No fuel used
- 0.3%Bottled, tank, or LP gas
Private vs. public school enrollment:
| Here: | 5.1% |
| California: | 10.5% |
| Here: | 6.9% |
| California: | 8.5% |
| Here: | 34.3% |
| California: | 15.9% |


