Coupeville, WA (Washington) Houses and Residents
| Coupeville: | $557,234 |
| Washington: | $569,500 |
Total population: 1,860 (Urban population: 0, Rural population: 1,738 (all nonfarm))
Houses: 1,033 (868 occupied: 585 owner occupied, 306 renter occupied)
| % of renters here: | 34% |
| State: | 36% |
Housing density: 807 houses/condos per square mile
Median price asked for vacant for-sale houses and condos in 2022 in this county: $552,749.
Median contract rent in 2022: $971
Median rent asked for vacant for-rent units in 2022: $843
Median gross rent in Coupeville, WA in 2022: $1,089
Housing units in Coupeville with a mortgage: 363 (19 second mortgage, 4 home equity loan, 14 both second mortgage and home equity loan)
Houses without a mortgage: 0
Median household income for houses/condos with a mortgage: $107,083
Median household income for apartments without a mortgage: $100,673
Median monthly housing costs: $1,194
Compare current foreclosures near Coupeville, WA:
| Photo | Address | Area | Beds / Baths | Price | Details |
|---|---|---|---|---|---|

|
#1
Seaside Dr
Coupeville, WA 98239
|
1,983 sq. feet
|
3 baths 4 beds |
show details | |

|
#2
Parker Rd
Coupeville, WA 98239
|
964 sq. feet
|
2 baths 3 beds |
show details | |

|
#3
Seaview Ave
Coupeville, WA 98239
|
1,746 sq. feet
|
2 baths 3 beds |
show details | |

|
#4
Leahy Dr
Coupeville, WA 98239
|
- sq. feet
|
- baths - beds |
show details | |

|
#5
El Toro St
Coupeville, WA 98239
|
- sq. feet
|
- baths - beds |
show details | |

|
#6
Olympic View Dr
Coupeville, WA 98239
|
- sq. feet
|
- baths - beds |
show details | |

|
#7
Olympic View Dr
Coupeville, WA 98239
|
- sq. feet
|
- baths - beds |
show details | |

|
#8
Donald Ave
Oak Harbor, WA 98277
|
1,006 sq. feet
|
1 baths 1 beds |
show details | |

|
#9
Mashie St
Anacortes, WA 98221
|
1,152 sq. feet
|
1 baths 2 beds |
show details | |

|
#10
Cape George Rd
Port Townsend, WA 98368
|
1,080 sq. feet
|
2 baths 3 beds |
show details |
| Photo | Address | Area | Beds / Baths | Price | Details |
|---|---|---|---|---|---|

|
#11
96th Ct NW
Stanwood, WA 98292
|
- sq. feet
|
2 baths 3 beds |
show details | |

|
#12
NE 3rd Ave
Oak Harbor, WA 98277
|
1,138 sq. feet
|
1 baths 3 beds |
show details | |

|
#13
285th Pl NW
Stanwood, WA 98292
|
2,268 sq. feet
|
3 baths 3 beds |
show details | |

|
#14
W Lake Ketchum Rd
Stanwood, WA 98292
|
2,613 sq. feet
|
2 baths 3 beds |
show details | |

|
#15
Lola Ln
Langley, WA 98260
|
1,311 sq. feet
|
2 baths 2 beds |
show details | |

|
#16
W Lake Ketchum Rd
Stanwood, WA 98292
|
2,613 sq. feet
|
2 baths 3 beds |
show details | |

|
#17
Thompson Dr
Camano Island, WA 98282
|
1,475 sq. feet
|
3 baths 3 beds |
show details | |

|
#18
Flagler Rd
Nordland, WA 98358
|
864 sq. feet
|
1 baths 1 beds |
show details | |

|
#19
Mallard Ln
Camano Island, WA 98282
|
3,158 sq. feet
|
2 baths 3 beds |
show details | |

|
#20
Frayne St
Port Hadlock, WA 98339
|
1,404 sq. feet
|
2 baths 3 beds |
show details |
| Photo | Address | Area | Beds / Baths | Price | Details |
|---|---|---|---|---|---|

|
#21
Dogwood Ln
Camano Island, WA 98282
|
2,652 sq. feet
|
3 baths 4 beds |
show details | |

|
#22
183rd St NW
Stanwood, WA 98292
|
1,824 sq. feet
|
1 baths 3 beds |
show details | |

|
#23
Florence Rd
Stanwood, WA 98292
|
1,584 sq. feet
|
1 baths 4 beds |
show details | |

|
#24
183rd St NW
Stanwood, WA 98292
|
1,824 sq. feet
|
1 baths 3 beds |
show details | |

|
#25
S Lake Ketchum Rd
Stanwood, WA 98292
|
1,028 sq. feet
|
2 baths 3 beds |
show details | |

|
#26
S Sapphire Dr
Camano Island, WA 98282
|
1,476 sq. feet
|
2 baths 2 beds |
show details | |

|
#27
281st Pl NW
Stanwood, WA 98292
|
1,954 sq. feet
|
2 baths 4 beds |
show details | |

|
#28
Church Creek Loop NW
Stanwood, WA 98292
|
1,220 sq. feet
|
2 baths 3 beds |
show details | |

|
#29
72nd Ave NW
Stanwood, WA 98292
|
1,101 sq. feet
|
1 baths 3 beds |
show details | |

|
#30
78th Dr NW
Stanwood, WA 98292
|
1,072 sq. feet
|
1 baths 3 beds |
show details |
| Photo | Address | Area | Beds / Baths | Price | Details |
|---|---|---|---|---|---|

|
#31
289th Pl NW
Stanwood, WA 98292
|
1,628 sq. feet
|
2 baths 3 beds |
show details | |

|
#32
287th Pl NW
Stanwood, WA 98292
|
2,949 sq. feet
|
2 baths 4 beds |
show details | |

|
#33
284th St NW
Stanwood, WA 98292
|
1,597 sq. feet
|
1 baths 3 beds |
show details | |

|
#34
Happy Hollow Rd
Stanwood, WA 98292
|
1,460 sq. feet
|
1 baths 2 beds |
show details | |

|
#35
Mountain View Ln
Freeland, WA 98249
|
1,414 sq. feet
|
2 baths 3 beds |
show details | |

|
#36
Summit St
Camano Island, WA 98282
|
1,439 sq. feet
|
2 baths 2 beds |
show details | |

|
#37
SW Xavier Dr
Oak Harbor, WA 98277
|
2,170 sq. feet
|
2 baths 3 beds |
show details | |

|
#38
SW Periwinkle Ln
Oak Harbor, WA 98277
|
1,980 sq. feet
|
2 baths 4 beds |
show details | |

|
#39
Dolphin St
Camano Island, WA 98282
|
1,432 sq. feet
|
2 baths 2 beds |
show details | |

|
#40
Links Way
Oak Harbor, WA 98277
|
2,766 sq. feet
|
2 baths 3 beds |
show details |
| Photo | Address | Area | Beds / Baths | Price | Details |
|---|---|---|---|---|---|

|
#41
Haines St
Port Townsend, WA 98368
|
1,336 sq. feet
|
2 baths 3 beds |
show details | |

|
#42
Colonial Way
Oak Harbor, WA 98277
|
1,424 sq. feet
|
2 baths 3 beds |
show details | |

|
#43
NE 8th Ave
Oak Harbor, WA 98277
|
1,680 sq. feet
|
2 baths 3 beds |
show details | |

|
#44
SW Talon Loop
Oak Harbor, WA 98277
|
1,809 sq. feet
|
2 baths 3 beds |
show details | |

|
#45
Admiralty Way
Camano Island, WA 98282
|
2,127 sq. feet
|
3 baths 3 beds |
show details | |

|
#46
SW Beeksma Dr
Oak Harbor, WA 98277
|
2,144 sq. feet
|
3 baths - beds |
show details | |

|
#47
SE 2nd Ct
Oak Harbor, WA 98277
|
1,670 sq. feet
|
2 baths - beds |
show details | |

|
#48
83rd Dr NW
Stanwood, WA 98292
|
1,402 sq. feet
|
- baths 3 beds |
show details | |

|
#49
SW Kimball Dr Apt F202
Oak Harbor, WA 98277
|
- sq. feet
|
- baths - beds |
show details | |

|
Check over 1 million property listings on Foreclosure.com!
|
browse all offers | |||

Latest news about housing in Coupeville, WA collected exclusively by city-data.com from local newspapers, TV, and radio stations


Median year apartment built: 1978
Household type by relationship:
Households: 2,042- Male householders: 465 (81 living alone), Female householders: 388 (179 living alone)
467 spouses (452 opposite-sex spouses), 64 unmarried partners, (64 opposite-sex unmarried partners), 255 children (238 natural, 0 adopted, 17 stepchildren), 11 grandchildren, 0 brothers or sisters, 123 parents, 0 foster children, 43 other relatives, 92 non-relatives
- In group quarters: 132
Size of family households: 365 2-persons, 198 3-persons, 43 4-persons, 9 5-persons, 10 6-persons.
Size of nonfamily households: 235 1-person, 19 2-persons, 10 3-persons.
127 married couples with children.
11 single-parent households (2 men, 9 women).
91.2% of residents of Coupeville speak English at home.
2.4% of residents speak Spanish at home (75% speak English very well, 25% speak English well).
3.4% of residents speak other Indo-European language at home (91% speak English very well, 9% speak English well).
2.0% of residents speak Asian or Pacific Island language at home (100% speak English very well).
2.4% of residents speak other language at home (67% speak English very well, 33% speak English not well).
Foreign born population: 253 (12.4%)
(78.7% of them are naturalized citizens)
| Here: | 6.2 |
| State: | 6.5 |
| Here: | 4.4 |
| State: | 3.9 |

- Bedrooms in owner-occupied houses and condos in Coupeville, Washington
- 0no bedroom
- 41 bedroom
- 1332 bedrooms
- 3073 bedrooms
- 844 bedrooms
- 575+ bedrooms

- Bedrooms in renter-occupied apartments in Coupeville, Washington
- 15no bedroom
- 861 bedroom
- 1102 bedrooms
- 863 bedrooms
- 04 bedrooms
- 105+ bedrooms

- Cars and other vehicles available in Coupeville in owner-occupied houses/condos
- 22no vehicle
- 1831 vehicle
- 2542 vehicles
- 953 vehicles
- 224 vehicles
- 95+ vehicles

- Cars and other vehicles available in Coupeville in renter-occupied apartments
- 44no vehicle
- 1681 vehicle
- 672 vehicles
- 273 vehicles
- 04 vehicles
- 05+ vehicles

- Rooms in owner-occupied houses in Coupeville, Washington
- 01 room
- 42 rooms
- 93 rooms
- 454 rooms
- 1395 rooms
- 1356 rooms
- 867 rooms
- 938 rooms
- 749+ rooms

- Rooms in renter-occupied apartments in Coupeville, Washington
- 91 room
- 342 rooms
- 433 rooms
- 734 rooms
- 665 rooms
- 286 rooms
- 07 rooms
- 48 rooms
- 489+ rooms


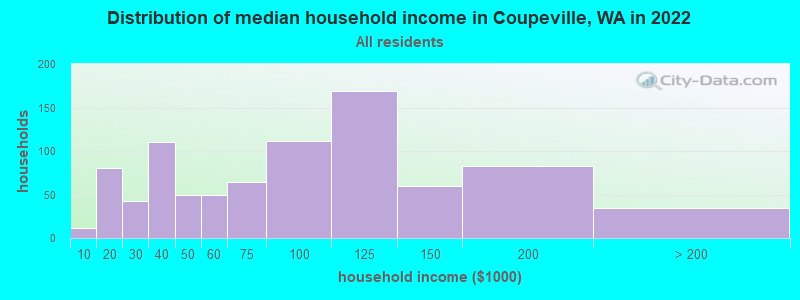
Coupeville, WA household income distribution

- 11Less than $10,000
- 81$10,000 to $19,999
- 43$20,000 to $29,999
- 110$30,000 to $39,999
- 49$40,000 to $49,999
- 49$50,000 to $59,999
- 64$60,000 to $74,999
- 112$75,000 to $99,999
- 169$100,000 to $124,999
- 60$125,000 to $149,999
- 83$150,000 to $199,999
- 34$200,000 or more
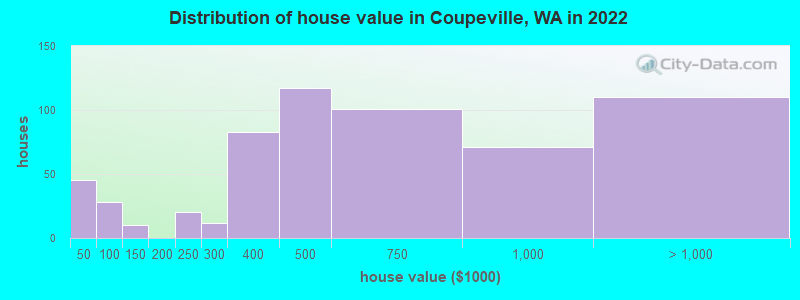
Home value of owner - occupied houses in 2022 in Coupeville, WA
-
- 10$10,000 to $14,999
- 9$20,000 to $24,999
- 5$30,000 to $34,999
- 18$40,000 to $49,999
- 9$70,000 to $79,999
- 9$100,000 to $124,999
- 20$200,000 to $249,999
- 12$250,000 to $299,999
- 82$300,000 to $399,999
- 116$400,000 to $499,999
- 101$500,000 to $749,999
- 70$750,000 to $999,999
- 91$1,000,000 to $1,499,999
- 18$2,000,000 or more
Rent paid by renters in 2022 in Coupeville, WA
-
- 4Less than $100
- 15$100 to $149
- 33$150 to $199
- 17$200 to $249
- 9$250 to $299
- 3$300 to $349
- 4$350 to $399
- 14$450 to $499
- 4$650 to $699
- 23$800 to $899
- 43$900 to $999
- 43$1,000 to $1,249
- 5$1,250 to $1,499
- 33$1,500 to $1,999
- 9$2,000 to $2,499
- 16No cash rent


Percentage of workers working in this county: 86.9%
Number of people working at home: 172 (22.8% of all workers)
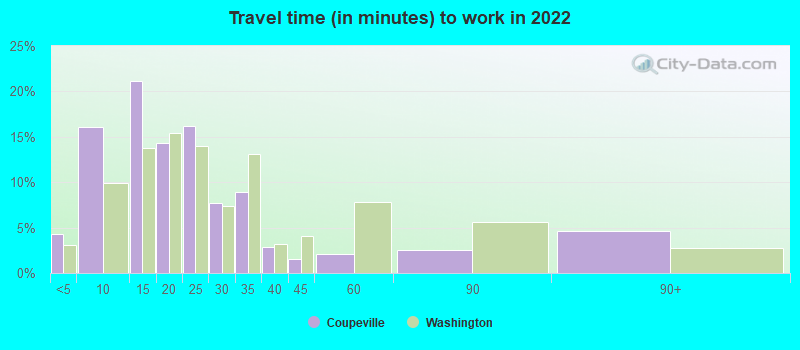
Travel time to work (commute)
- Less than 5 minutes: 55
- 5 to 9 minutes: 138
- 10 to 14 minutes: 71
- 15 to 19 minutes: 56
- 20 to 24 minutes: 91
- 25 to 29 minutes: 9
- 30 to 34 minutes: 38
- 35 to 39 minutes: 0
- 40 to 44 minutes: 24
- 45 to 59 minutes: 21
- 60 to 89 minutes: 43
- 90 or more minutes: 43
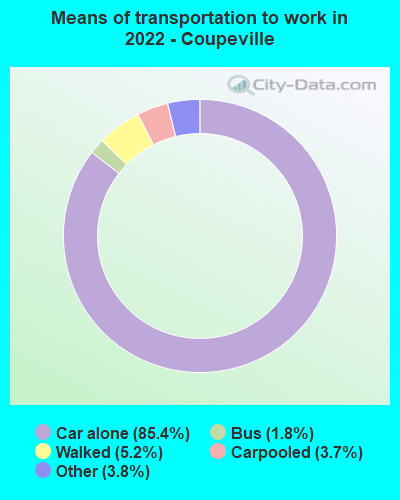
Means of transportation to work:
- Drove a car alone: 1,687 (76.5%)
- Carpooled: 75 (3.4%)
- Bus: 24 (1.1%)
- Taxi: 71 (3.2%)
- Walked: 105 (4.8%)
- Worked at home: 172 (7.8%)

- Unemployment by race in 2022
- Unemployment rate for American Indian and Alaska Native residents
- 100.0%Females

- Year of entry for the foreign-born population in Coupeville, Washington
- 162010 or later
- 142000 to 2009
- 621990 to 1999
- 311980 to 1989
- 91970 to 1979
- 34Before 1970

First ancestries reported:
- German: 200 (22.6%)
- Irish: 90 (10.2%)
- American: 74 (8.4%)
- Norwegian: 73 (8.3%)
- Danish: 72 (8.2%)
- English: 52 (5.9%)
- European: 40 (4.5%)
- Dutch: 31 (3.5%)
- Swedish: 19 (2.2%)
- Iranian: 16 (1.8%)
- French: 12 (1.4%)
- Scandinavian: 12 (1.4%)
- Swiss: 11 (1.2%)
- Basque: 8 (0.9%)
- Yugoslavian: 8 (0.9%)
- Canadian: 7 (0.8%)
- Italian: 7 (0.8%)
- Egyptian: 4 (0.5%)
- Russian: 4 (0.5%)
- Welsh: 4 (0.5%)
- Lithuanian: 2 (0.2%)
- Northern European: 2 (0.2%)
- Pennsylvania German: 2 (0.2%)
- Romanian: 2 (0.2%)
- African: 2 (0.2%)
Most common places of birth for foreign-born residents (%):
| Coupeville: | 15.4% (44) |
| Washington: | 0.1% (1,642) |
| Coupeville: | 15.1% (43) |
| Washington: | 6.3% (71,661) |
| Coupeville: | 8.1% (23) |
| Washington: | 21.1% (241,655) |
| Coupeville: | 7.7% (22) |
| Washington: | 0.8% (9,457) |
| Coupeville: | 7.4% (21) |
| Washington: | 1.6% (17,761) |
| Coupeville: | 6.0% (17) |
| Washington: | 0.9% (10,499) |
| Coupeville: | 5.3% (15) |
| Washington: | 0.3% (3,414) |
| Coupeville: | 4.2% (12) |
| Washington: | 0.4% (4,951) |
| Coupeville: | 3.9% (11) |
| Washington: | 1.5% (17,453) |
| Coupeville: | 3.5% (10) |
| Washington: | 8.9% (101,353) |
| Coupeville: | 3.5% (10) |
| Washington: | 1.2% (13,855) |
| Coupeville: | 2.1% (6) |
| Washington: | 0.3% (3,373) |
Place of birth for U.S.-born residents:
- This state: 683
- Other state: 1,063
- Northeast: 145
- Midwest: 165
- South: 169
- West: 582
85.8% of Coupeville residents lived in the same house 1 years ago.
Out of people who lived in different houses, 36.5% lived in this county.
Out of people who lived in different counties, 52.1% lived in Washington.
| Coupeville: | 85.8% |
| State average: | 85.2% |
Education attainment for males 25 years and older:
- No schooling: 0
- Nursery to 4th grade: 0
- 5th and 6th grade: 0
- 7th and 8th grade: 3
- 9th grade: 8
- 10th grade: 0
- 11th grade: 1
- 12th grade, no diploma: 17
- High school graduate (or equivalency): 243
- Less than 1 year of college: 38
- Some college more than 1 year, no degree: 145
- Associate degree: 120
- Bachelor's degree: 171
- Master's degree: 123
- Professional school degree: 7
- Doctorate degree: 9

Education attainment for females 25 years and older:
- No schooling: 15
- Nursery to 4th grade: 0
- 5th and 6th grade: 1
- 7th and 8th grade: 18
- 9th grade: 0
- 10th grade: 2
- 11th grade: 0
- 12th grade, no diploma: 0
- High school graduate (or equivalency): 239
- Less than 1 year of college: 69
- Some college more than 1 year, no degree: 116
- Associate degree: 168
- Bachelor's degree: 188
- Master's degree: 130
- Professional school degree: 0
- Doctorate degree: 14


Housing units in structures:
- One, detached: 701
- One, attached: 33
- Two: 33
- 3 or 4: 49
- 5 to 9: 47
- 10 to 19: 5
- 20 to 49: 56
- 50 or more: 52
- Mobile homes: 45
- Boats, RVs, vans, etc.: 6
House/condo owner moved in on average 7 years ago
Renter moved in on average 5 years ago

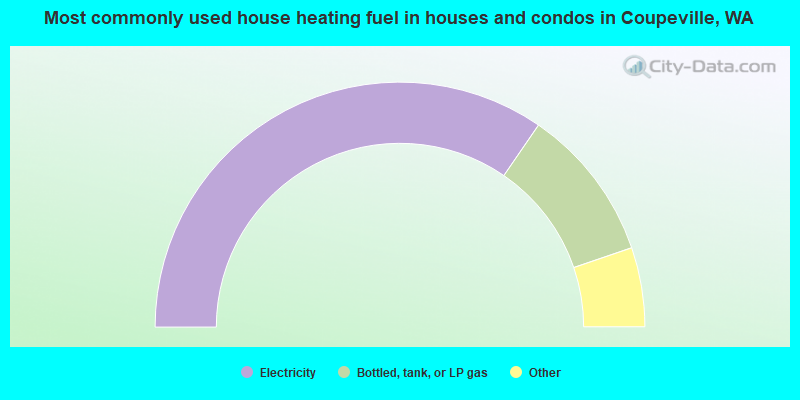
- 69.3%Electricity
- 20.4%Bottled, tank, or LP gas
- 3.8%Wood
- 2.5%Utility gas
- 2.3%Other fuel
- 1.8%Fuel oil, kerosene, etc.
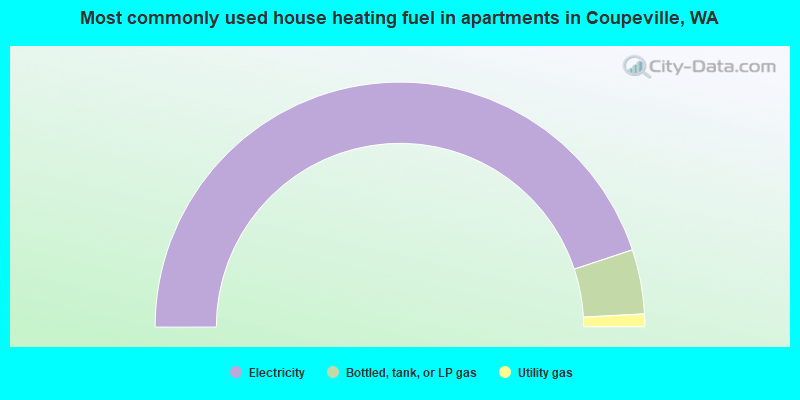
- 89.8%Electricity
- 8.5%Bottled, tank, or LP gas
- 1.7%Utility gas
Private vs. public school enrollment:
| Here: | 3.3% |
| Washington: | 12.4% |
| Here: | 15.9% |
| Washington: | 9.2% |
| Here: | 24.4% |
| Washington: | 16.5% |


