Crescent Springs, KY (Kentucky) Houses and Residents
| Crescent Springs: | $296,034 |
| Kentucky: | $196,300 |
Total population: 3,987 (Urban population: 3,596, Rural population: 0)
Houses: 1,934 (1,904 occupied: 944 owner occupied, 927 renter occupied)
| % of renters here: | 50% |
| State: | 31% |
Housing density: 1,349 houses/condos per square mile
Median price asked for vacant for-sale houses and condos in 2022 in this county: $436,610.
Median contract rent in 2022: $794 (lower quartile is $722, upper quartile is $921)
Median rent asked for vacant for-rent units in 2022: $855
Median gross rent in Crescent Springs, KY in 2022: $911
Housing units in Crescent Springs with a mortgage: 655 (31 second mortgage, 0 home equity loan, 30 both second mortgage and home equity loan)
Houses without a mortgage: 0
Median household income for houses/condos with a mortgage: $85,201
Median household income for apartments without a mortgage: $87,175
Median monthly housing costs: $909
Compare current foreclosures near Crescent Springs, KY:
| Photo | Address | Area | Beds / Baths | Price | Details |
|---|---|---|---|---|---|

|
#1
Werner Ave
Cincinnati, OH 45231
|
1,032 sq. feet
|
1 baths 2 beds |
$124,900
|
show details |

|
#2
Garvey Ave
Erlanger, KY 41018
|
848 sq. feet
|
1 baths 3 beds |
show details | |

|
#3
Perry St
Cincinnati, OH 45231
|
1,176 sq. feet
|
1 baths 2 beds |
show details | |

|
#4
Woodlyn Hills Dr
Erlanger, KY 41018
|
1,908 sq. feet
|
3 baths 3 beds |
show details | |

|
#5
Creekhill Dr
Cincinnati, OH 45231
|
1,352 sq. feet
|
3 baths 3 beds |
show details | |

|
#6
Delhi Ave
Cincinnati, OH 45204
|
950 sq. feet
|
1 baths 3 beds |
show details | |

|
#7
Stormy Way
Cincinnati, OH 45230
|
2,448 sq. feet
|
2 baths 4 beds |
show details | |

|
#8
Alex Ct
Hebron, KY 41048
|
1,432 sq. feet
|
2 baths 3 beds |
show details | |

|
#9
Williams St
Cincinnati, OH 45215
|
1,152 sq. feet
|
1 baths 2 beds |
show details | |

|
#10
Glade Ave
Cincinnati, OH 45230
|
1,138 sq. feet
|
1 baths 3 beds |
show details |
| Photo | Address | Area | Beds / Baths | Price | Details |
|---|---|---|---|---|---|

|
#11
Linda Dr
Cincinnati, OH 45238
|
1,131 sq. feet
|
2 baths 3 beds |
show details | |

|
#12
Regent Rd
Cincinnati, OH 45245
|
1,886 sq. feet
|
3 baths 3 beds |
show details | |

|
#13
Philloret Dr
Cincinnati, OH 45239
|
1,233 sq. feet
|
1 baths 3 beds |
show details | |

|
#14
Musket Cir
Independence, KY 41051
|
1,147 sq. feet
|
2 baths 3 beds |
show details | |

|
#15
Knollridge Ln
Cincinnati, OH 45231
|
1,307 sq. feet
|
2 baths 3 beds |
show details | |

|
#16
Ann St
Newport, KY 41071
|
939 sq. feet
|
1 baths 2 beds |
show details | |

|
#17
Andrew St
Cincinnati, OH 45217
|
1,172 sq. feet
|
1 baths 3 beds |
show details | |

|
#18
Ramble Vw Unit 102
Cincinnati, OH 45231
|
1,129 sq. feet
|
2 baths 2 beds |
show details | |

|
#19
Blossom Dr
Newport, KY 41076
|
1,823 sq. feet
|
2 baths 3 beds |
show details | |

|
#20
Lexington Dr
Erlanger, KY 41018
|
1,063 sq. feet
|
1 baths 3 beds |
show details |
| Photo | Address | Area | Beds / Baths | Price | Details |
|---|---|---|---|---|---|

|
#21
Cascade Rd
Cincinnati, OH 45240
|
1,423 sq. feet
|
1 baths 4 beds |
show details | |

|
#22
Terrydel Ln
Cincinnati, OH 45245
|
832 sq. feet
|
1 baths 2 beds |
show details | |

|
#23
Bertus St
Cincinnati, OH 45217
|
1,488 sq. feet
|
2 baths 2 beds |
show details | |

|
#24
Race Rd
Cincinnati, OH 45211
|
1,523 sq. feet
|
2 baths 3 beds |
show details | |

|
#25
Kirkup Ave
Cincinnati, OH 45213
|
2,142 sq. feet
|
2 baths 4 beds |
show details | |

|
#26
Laidlaw Ave
Cincinnati, OH 45237
|
1,160 sq. feet
|
1 baths 2 beds |
show details | |

|
#27
Salvia Ave
Cincinnati, OH 45224
|
1,824 sq. feet
|
2 baths 3 beds |
show details | |

|
#28
Llanfair Ave
Cincinnati, OH 45224
|
1,240 sq. feet
|
1 baths 2 beds |
show details | |

|
#29
Robers Ave
Cincinnati, OH 45239
|
1,847 sq. feet
|
2 baths 3 beds |
show details | |

|
#30
Carolina Ave
Cincinnati, OH 45237
|
1,232 sq. feet
|
1 baths 3 beds |
show details |
| Photo | Address | Area | Beds / Baths | Price | Details |
|---|---|---|---|---|---|

|
#31
Minot Ave # 2
Cincinnati, OH 45209
|
1,886 sq. feet
|
2 baths 4 beds |
show details | |

|
#32
Dale Rd
Cincinnati, OH 45237
|
1,395 sq. feet
|
1 baths 3 beds |
show details | |

|
#33
Maple St
Cincinnati, OH 45216
|
1,568 sq. feet
|
1 baths 3 beds |
show details | |

|
#34
Hunter Ave
Cincinnati, OH 45212
|
1,287 sq. feet
|
1 baths 2 beds |
show details | |

|
#35
Paxton Ave
Cincinnati, OH 45209
|
594 sq. feet
|
1 baths 2 beds |
show details | |

|
#36
James St
Cincinnati, OH 45216
|
1,235 sq. feet
|
1 baths 3 beds |
show details | |

|
#37
Lawn Ave
Cincinnati, OH 45237
|
884 sq. feet
|
1 baths 2 beds |
show details | |

|
#38
Ryland Ave
Cincinnati, OH 45237
|
1,294 sq. feet
|
1 baths 2 beds |
show details | |

|
#39
Watch Point Dr
Cincinnati, OH 45230
|
1,614 sq. feet
|
2 baths 3 beds |
show details | |

|
#40
Pameleen Ct
Cincinnati, OH 45239
|
1,825 sq. feet
|
3 baths 3 beds |
show details |
| Photo | Address | Area | Beds / Baths | Price | Details |
|---|---|---|---|---|---|

|
#41
Seiler Dr
Cincinnati, OH 45239
|
2,204 sq. feet
|
2 baths 3 beds |
show details | |

|
#42
Blue Spruce Ln
Cincinnati, OH 45224
|
1,581 sq. feet
|
2 baths 3 beds |
show details | |

|
#43
Banning Rd
Cincinnati, OH 45239
|
1,469 sq. feet
|
1 baths 2 beds |
show details | |

|
#44
Linden St
Cincinnati, OH 45216
|
1,819 sq. feet
|
2 baths 3 beds |
show details | |

|
#45
Andina Ave
Cincinnati, OH 45237
|
1,812 sq. feet
|
1 baths 3 beds |
show details | |

|
#46
Sycamore St
Cincinnati, OH 45216
|
806 sq. feet
|
1 baths 2 beds |
show details | |

|
#47
Mayland Dr
Cincinnati, OH 45230
|
1,732 sq. feet
|
1 baths 2 beds |
show details | |

|
#48
Keywest Dr
Cincinnati, OH 45239
|
1,001 sq. feet
|
1 baths 2 beds |
show details | |

|
#49
W Fork Rd
Cincinnati, OH 45247
|
1,302 sq. feet
|
1 baths 2 beds |
show details | |

|
Check over 1 million property listings on Foreclosure.com!
|
browse all offers | |||


 | Looking for Home NKY (2 replies) |
| Looking for Apartment in NKY (5 replies) |
| Relocating from Northern Michigan (0 replies) |
| Cincinnati/NKY (4 replies) |
| Relocating to Northern KY (new job in Erlanger, KY) (2 replies) |
| Moving to N. Ky --what areas are safe vs. not safe (2 replies) |

Median year apartment built: 1985
Household type by relationship:
Households: 4,382- Male householders: 944 (282 living alone), Female householders: 955 (427 living alone)
821 spouses (821 opposite-sex spouses), 78 unmarried partners, (78 opposite-sex unmarried partners), 1,250 children (1,167 natural, 43 adopted, 39 stepchildren), 34 grandchildren, 0 brothers or sisters, 54 parents, 0 foster children, 206 other relatives, 36 non-relatives
Size of family households: 421 2-persons, 303 3-persons, 239 4-persons, 100 5-persons.
Size of nonfamily households: 722 1-person, 71 2-persons.
678 married couples with children.
311 single-parent households (119 men, 192 women).
84.2% of residents of Crescent Springs speak English at home.
0.9% of residents speak Spanish at home (100% speak English very well).
7.0% of residents speak other Indo-European language at home (93% speak English very well, 7% speak English well).
4.0% of residents speak Asian or Pacific Island language at home (100% speak English very well).
4.2% of residents speak other language at home (37% speak English very well, 35% speak English well, 13% speak English not well, 15% don't speak English at all).
Foreign born population: 666 (15.2%)
(58.1% of them are naturalized citizens)
| Here: | 6.3 |
| State: | 6.4 |
| Here: | 3.9 |
| State: | 4.4 |

- Bedrooms in owner-occupied houses and condos in Crescent Springs, Kentucky
- 0no bedroom
- 01 bedroom
- 2662 bedrooms
- 3263 bedrooms
- 2694 bedrooms
- 835+ bedrooms

- Bedrooms in renter-occupied apartments in Crescent Springs, Kentucky
- 0no bedroom
- 3391 bedroom
- 4552 bedrooms
- 1183 bedrooms
- 154 bedrooms
- 05+ bedrooms

- Cars and other vehicles available in Crescent Springs in owner-occupied houses/condos
- 0no vehicle
- 1971 vehicle
- 5212 vehicles
- 1163 vehicles
- 1104 vehicles
- 05+ vehicles

- Cars and other vehicles available in Crescent Springs in renter-occupied apartments
- 0no vehicle
- 5051 vehicle
- 3922 vehicles
- 313 vehicles
- 04 vehicles
- 05+ vehicles

- Rooms in owner-occupied houses in Crescent Springs, Kentucky
- 01 room
- 02 rooms
- 263 rooms
- 2114 rooms
- 1415 rooms
- 856 rooms
- 1037 rooms
- 678 rooms
- 3109+ rooms

- Rooms in renter-occupied apartments in Crescent Springs, Kentucky
- 01 room
- 912 rooms
- 1273 rooms
- 4184 rooms
- 1585 rooms
- 946 rooms
- 247 rooms
- 08 rooms
- 159+ rooms


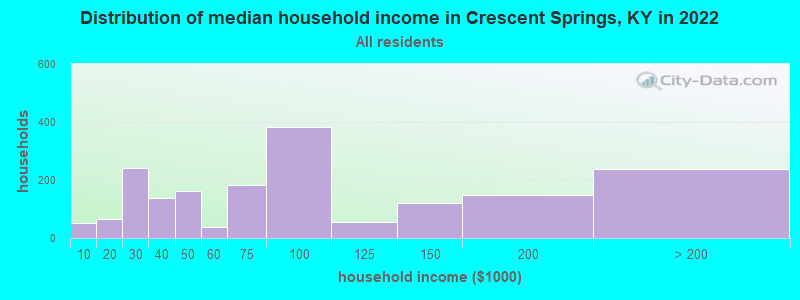
Crescent Springs, KY household income distribution

- 51Less than $10,000
- 64$10,000 to $19,999
- 242$20,000 to $29,999
- 139$30,000 to $39,999
- 162$40,000 to $49,999
- 38$50,000 to $59,999
- 182$60,000 to $74,999
- 383$75,000 to $99,999
- 55$100,000 to $124,999
- 120$125,000 to $149,999
- 150$150,000 to $199,999
- 239$200,000 or more
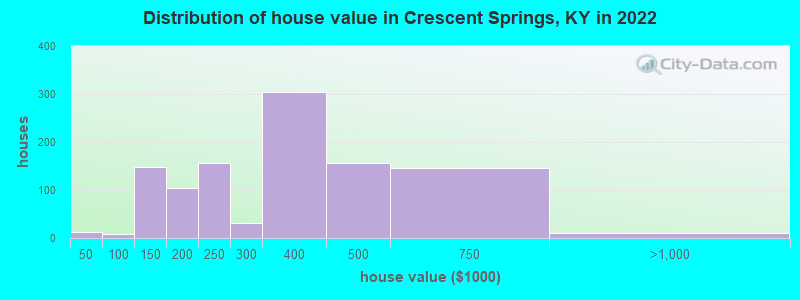
Home value of owner - occupied houses in 2022 in Crescent Springs, KY
-
- 13Less than $10,000
- 9$90,000 to $99,999
- 97$100,000 to $124,999
- 50$125,000 to $149,999
- 27$150,000 to $174,999
- 77$175,000 to $199,999
- 156$200,000 to $249,999
- 31$250,000 to $299,999
- 305$300,000 to $399,999
- 157$400,000 to $499,999
- 145$500,000 to $749,999
- 9$750,000 to $999,999
Rent paid by renters in 2022 in Crescent Springs, KY
-
- 25$500 to $549
- 45$600 to $649
- 179$650 to $699
- 113$700 to $749
- 92$750 to $799
- 195$800 to $899
- 20$900 to $999
- 63$1,000 to $1,249
- 55No cash rent


Percentage of workers working in this county: 51.4%
Number of people working at home: 408 (20.3% of all workers)
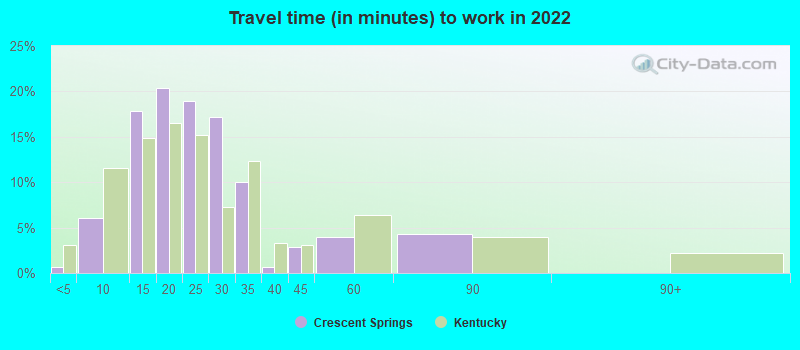
Travel time to work (commute)
- Less than 5 minutes: 11
- 5 to 9 minutes: 74
- 10 to 14 minutes: 118
- 15 to 19 minutes: 363
- 20 to 24 minutes: 512
- 25 to 29 minutes: 108
- 30 to 34 minutes: 171
- 35 to 39 minutes: 45
- 40 to 44 minutes: 22
- 45 to 59 minutes: 163
- 60 to 89 minutes: 15
- 90 or more minutes: 16
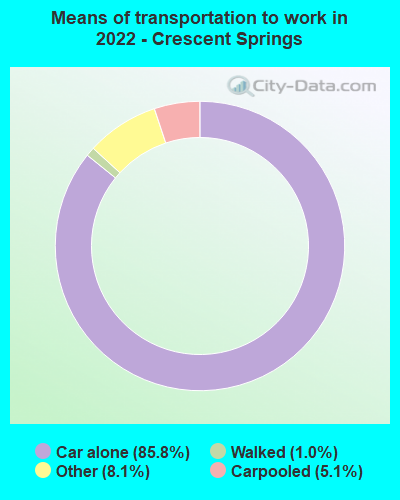
Means of transportation to work:
- Drove a car alone: 1,610 (73.0%)
- Carpooled: 105 (4.8%)
- Taxi: 181 (8.2%)
- Walked: 18 (0.8%)
- Worked at home: 343 (15.5%)

- Unemployment by race in 2022
- Unemployment rate for White non-Hispanic residents
- 7.5%Males
- 6.8%Females

- Year of entry for the foreign-born population in Crescent Springs, Kentucky
- 5082010 or later
- 1762000 to 2009
- 01990 to 1999
- 141980 to 1989
- 171970 to 1979
- 19Before 1970

First ancestries reported:
- German: 724 (29.8%)
- English: 305 (12.6%)
- American: 160 (6.6%)
- Irish: 156 (6.4%)
- European: 148 (6.1%)
- Moroccan: 81 (3.3%)
- Scottish: 77 (3.2%)
- Polish: 16 (0.7%)
- Italian: 12 (0.5%)
- Hungarian: 11 (0.5%)
Most common places of birth for foreign-born residents (%):
| Crescent Springs: | 38.4% (274) |
| Kentucky: | 0.4% (782) |
| Crescent Springs: | 21.8% (156) |
| Kentucky: | 1.9% (3,470) |
| Crescent Springs: | 15.4% (110) |
| Kentucky: | 0.6% (1,089) |
| Crescent Springs: | 8.5% (61) |
| Kentucky: | 7.3% (13,454) |
| Crescent Springs: | 7.4% (53) |
| Kentucky: | 0.3% (553) |
| Crescent Springs: | 6.4% (46) |
| Kentucky: | 0.0% (67) |
| Crescent Springs: | 2.9% (21) |
| Kentucky: | 0.1% (258) |
| Crescent Springs: | 2.1% (15) |
| Kentucky: | 0.2% (438) |
Place of birth for U.S.-born residents:
- This state: 2,352
- Other state: 1,279
- Northeast: 41
- Midwest: 1,149
- South: 55
- West: 25
78.0% of Crescent Springs residents lived in the same house 1 years ago.
Out of people who lived in different houses, 45.8% lived in this county.
Out of people who lived in different counties, 39.9% lived in Kentucky.
| Crescent Springs: | 78.0% |
| State average: | 87.2% |
Education attainment for males 25 years and older:
- No schooling: 0
- Nursery to 4th grade: 0
- 5th and 6th grade: 0
- 7th and 8th grade: 0
- 9th grade: 0
- 10th grade: 0
- 11th grade: 0
- 12th grade, no diploma: 35
- High school graduate (or equivalency): 280
- Less than 1 year of college: 59
- Some college more than 1 year, no degree: 228
- Associate degree: 77
- Bachelor's degree: 626
- Master's degree: 77
- Professional school degree: 20
- Doctorate degree: 23

Education attainment for females 25 years and older:
- No schooling: 32
- Nursery to 4th grade: 0
- 5th and 6th grade: 0
- 7th and 8th grade: 23
- 9th grade: 0
- 10th grade: 0
- 11th grade: 0
- 12th grade, no diploma: 0
- High school graduate (or equivalency): 534
- Less than 1 year of college: 115
- Some college more than 1 year, no degree: 181
- Associate degree: 175
- Bachelor's degree: 377
- Master's degree: 303
- Professional school degree: 8
- Doctorate degree: 0


Housing units in structures:
- One, detached: 619
- One, attached: 59
- Two: 42
- 3 or 4: 161
- 5 to 9: 456
- 10 to 19: 487
- 20 to 49: 18
- 50 or more: 88
House/condo owner moved in on average 9 years ago
Renter moved in on average 1 years ago

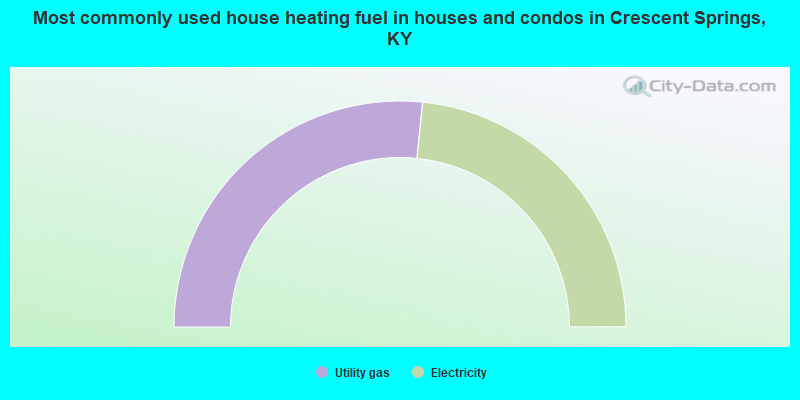
- 53.2%Utility gas
- 46.8%Electricity
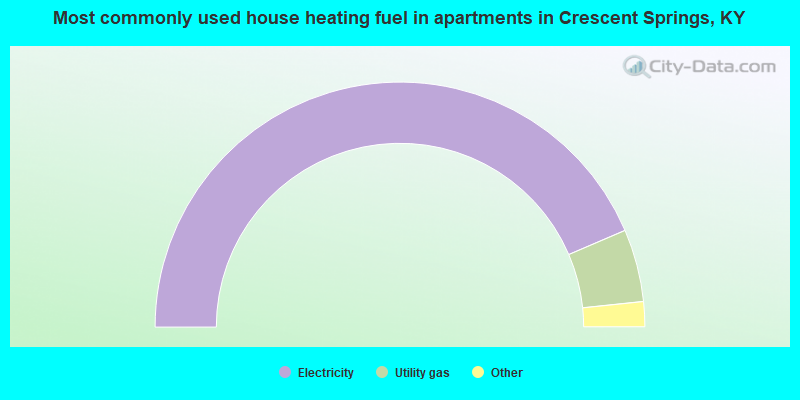
- 87.2%Electricity
- 9.6%Utility gas
- 1.9%No fuel used
- 1.3%Bottled, tank, or LP gas
Private vs. public school enrollment:
| Here: | 27.1% |
| Kentucky: | 17.2% |
| Here: | 16.6% |
| Kentucky: | 15.2% |
| Here: | 34.3% |
| Kentucky: | 19.6% |


