Crest, CA (California) Houses and Residents
| Crest: | $784,611 |
| California: | $715,900 |
Mean price in 2022:
Detached houses: $850,388
Here: $850,388 State: $988,808
Total population: 2,593 (Urban population: 1,898, Rural population: 882 (all nonfarm))
Houses: 1,141 (1,088 occupied: 985 owner occupied, 110 renter occupied)
| % of renters here: | 10% |
| State: | 44% |
Housing density: 179 houses/condos per square mile
Median price asked for vacant for-sale houses and condos in 2022 in this county: $1,340,665.
Median contract rent in 2022: over $2,000
Median rent asked for vacant for-rent units in 2022: $672
Median gross rent in Crest, CA in 2022: over $2,000
Housing units in Crest with a mortgage: 744 (53 second mortgage, 0 home equity loan, 41 both second mortgage and home equity loan)
Houses without a mortgage: 8
Median household income for houses/condos with a mortgage: $143,273
Median household income for apartments without a mortgage: $42,527
Median monthly housing costs: $2,336
Compare current foreclosures near Crest, CA:
| Photo | Address | Area | Beds / Baths | Price | Details |
|---|---|---|---|---|---|

|
#1
Sacramento Ave
Spring Valley, CA 91977
|
1,380 sq. feet
|
1 baths 3 beds |
show details | |

|
#2
Baltimore Dr Unit 75
La Mesa, CA 91942
|
1,612 sq. feet
|
3 baths 3 beds |
show details | |

|
#3
E Chase Ave
El Cajon, CA 92020
|
2,617 sq. feet
|
3 baths 4 beds |
show details | |

|
#4
Mono Lake Dr
San Diego, CA 92119
|
1,714 sq. feet
|
2 baths 3 beds |
show details | |

|
#5
45th St
San Diego, CA 92115
|
1,064 sq. feet
|
1 baths 2 beds |
show details | |

|
#6
Joliet St
El Cajon, CA 92019
|
1,408 sq. feet
|
1 baths 3 beds |
show details | |

|
#7
Tamayo Dr Apt 1
Chula Vista, CA 91910
|
1,006 sq. feet
|
2 baths 2 beds |
show details | |

|
#8
Silva Rd
El Cajon, CA 92021
|
3,158 sq. feet
|
3 baths 4 beds |
show details | |

|
#9
Cool Lake Way
San Diego, CA 92128
|
1,739 sq. feet
|
2 baths 4 beds |
show details | |

|
#10
Rancho Diego Cir
El Cajon, CA 92019
|
2,955 sq. feet
|
2 baths 4 beds |
show details |
| Photo | Address | Area | Beds / Baths | Price | Details |
|---|---|---|---|---|---|

|
#11
N Paradise Ridge Way
Chula Vista, CA 91915
|
3,258 sq. feet
|
3 baths 3 beds |
show details | |

|
#12
Euclid Ave
National City, CA 91950
|
1,435 sq. feet
|
2 baths 4 beds |
show details | |

|
#13
Roswell St
San Diego, CA 92114
|
2,185 sq. feet
|
2 baths 5 beds |
show details | |

|
#14
Macawa Ave
San Diego, CA 92123
|
900 sq. feet
|
1 baths 3 beds |
show details | |

|
#15
Choctaw Dr
San Diego, CA 92115
|
2,455 sq. feet
|
3 baths 5 beds |
show details | |

|
#16
Skyview St
El Cajon, CA 92020
|
2,200 sq. feet
|
2 baths 4 beds |
show details | |

|
#17
Spring Oaks Rd Spc 150
El Cajon, CA 92021
|
1,776 sq. feet
|
2 baths 3 beds |
show details | |

|
#18
Normal Ave
La Mesa, CA 91941
|
1,766 sq. feet
|
2 baths 3 beds |
show details | |

|
#19
S 41st St
San Diego, CA 92113
|
- sq. feet
|
1 baths 2 beds |
show details | |

|
#20
Valley Vista Rd
Bonita, CA 91902
|
1,333 sq. feet
|
1 baths 2 beds |
show details |
| Photo | Address | Area | Beds / Baths | Price | Details |
|---|---|---|---|---|---|

|
#21
Florence St
San Diego, CA 92113
|
1,261 sq. feet
|
2 baths 2 beds |
show details | |

|
#22
Kent St
Chula Vista, CA 91913
|
2,035 sq. feet
|
2 baths 3 beds |
show details | |

|
#23
Afton Rd
San Diego, CA 92123
|
1,161 sq. feet
|
2 baths 3 beds |
show details | |

|
#24
Lakeview Dr
Spring Valley, CA 91977
|
- sq. feet
|
2 baths 4 beds |
show details | |

|
#25
Alleghany St
San Diego, CA 92139
|
744 sq. feet
|
1 baths 2 beds |
show details | |

|
#26
Via Sinuoso
Chula Vista, CA 91910
|
2,871 sq. feet
|
3 baths 4 beds |
show details | |

|
#27
51st St
San Diego, CA 92114
|
1,289 sq. feet
|
2 baths 4 beds |
show details | |

|
#28
Alvarado Rd Unit 2
San Diego, CA 92120
|
1,120 sq. feet
|
1 baths 2 beds |
show details | |

|
#29
Rancho Canada Rd
El Cajon, CA 92021
|
1,421 sq. feet
|
2 baths 4 beds |
show details | |

|
#30
Rangeview St
Spring Valley, CA 91977
|
- sq. feet
|
1 baths 3 beds |
show details |
| Photo | Address | Area | Beds / Baths | Price | Details |
|---|---|---|---|---|---|

|
#31
Palmer Way
National City, CA 91950
|
1,183 sq. feet
|
2 baths 2 beds |
show details | |

|
#32
E Madison Ave
El Cajon, CA 92020
|
1,152 sq. feet
|
2 baths 3 beds |
show details | |

|
#33
Alton Dr
Lemon Grove, CA 91945
|
1,723 sq. feet
|
2 baths 3 beds |
show details | |

|
#34
Olamar Way
San Diego, CA 92139
|
2,037 sq. feet
|
3 baths 5 beds |
show details | |

|
#35
Arthur Ave
Chula Vista, CA 91910
|
- sq. feet
|
1 baths 3 beds |
show details | |

|
#36
Magdalena Ave
Chula Vista, CA 91913
|
2,466 sq. feet
|
2 baths 4 beds |
show details | |

|
#37
D St
Ramona, CA 92065
|
396 sq. feet
|
1 baths 2 beds |
show details | |

|
#38
Mission Center Ct
San Diego, CA 92108
|
1,020 sq. feet
|
1 baths 2 beds |
show details | |

|
#39
Lakeview Rd
Lakeside, CA 92040
|
852 sq. feet
|
1 baths 2 beds |
show details | |

|
#40
Austin Dr
San Diego, CA 92115
|
1,299 sq. feet
|
2 baths 3 beds |
show details |
| Photo | Address | Area | Beds / Baths | Price | Details |
|---|---|---|---|---|---|

|
#41
Bear Valley Rd
Chula Vista, CA 91915
|
1,740 sq. feet
|
2 baths 4 beds |
show details | |

|
#42
Bullock Dr
San Diego, CA 92114
|
1,050 sq. feet
|
2 baths 3 beds |
show details | |

|
#43
Brookstone Rd Unit 202
Chula Vista, CA 91913
|
1,166 sq. feet
|
2 baths 3 beds |
show details | |

|
#44
Sandrock Rd
San Diego, CA 92123
|
1,204 sq. feet
|
2 baths 3 beds |
show details | |

|
#45
Timely Ter
San Diego, CA 92114
|
1,287 sq. feet
|
2 baths 3 beds |
show details | |

|
#46
Redwood St
San Diego, CA 92105
|
1,285 sq. feet
|
2 baths 2 beds |
show details | |

|
#47
Timely Ter
San Diego, CA 92114
|
1,320 sq. feet
|
2 baths 4 beds |
show details | |

|
#48
Leadrope Way
Bonita, CA 91902
|
2,234 sq. feet
|
3 baths 5 beds |
show details | |

|
#49
Hemlock St
San Diego, CA 92113
|
1,296 sq. feet
|
1 baths 3 beds |
show details | |

|
Check over 1 million property listings on Foreclosure.com!
|
browse all offers | |||

Latest news about housing in Crest, CA collected exclusively by city-data.com from local newspapers, TV, and radio stations

 | Crest apartments on Sherman way - hip homeless housing (4 replies) |
| Young couple seeking to buy or rent a house in Bay Area (10 replies) |
| Where are there more Victorian homes? Bay Area or LA/OC/IE? (10 replies) |
| Rental home in the Moreno Valley (8 replies) |
| seeking advice for good school and reasonable housing (2 replies) |
| Neighborhood Recommendations to Buy a Home (12 replies) |

Median year apartment built: 1970
Household type by relationship:
Households: 3,165- Male householders: 525 (94 living alone), Female householders: 543 (79 living alone)
687 spouses (681 opposite-sex spouses), 57 unmarried partners, (57 opposite-sex unmarried partners), 945 children (804 natural, 98 adopted, 41 stepchildren), 106 grandchildren, 35 brothers or sisters, 29 parents, 0 foster children, 43 other relatives, 190 non-relatives
Size of family households: 378 2-persons, 247 3-persons, 127 4-persons, 42 5-persons, 66 6-persons, 9 7-or-more-persons.
Size of nonfamily households: 178 1-person, 15 2-persons, 6 3-persons, 19 4-persons.
414 married couples with children.
63 single-parent households (50 men, 13 women).
79.2% of residents of Crest speak English at home.
17.8% of residents speak Spanish at home (82% speak English very well, 10% speak English well, 8% speak English not well).
0.6% of residents speak Asian or Pacific Island language at home (100% speak English very well).
1.4% of residents speak other language at home (27% speak English well, 73% speak English not well).
Foreign born population: 277 (8.8%)
(46.6% of them are naturalized citizens)
| Here: | 5.9 |
| State: | 6.0 |
| Here: | 3.4 |
| State: | 3.9 |

- Bedrooms in owner-occupied houses and condos in Crest, California
- 0no bedroom
- 301 bedroom
- 2462 bedrooms
- 3883 bedrooms
- 2864 bedrooms
- 375+ bedrooms

- Bedrooms in renter-occupied apartments in Crest, California
- 0no bedroom
- 321 bedroom
- 392 bedrooms
- 403 bedrooms
- 04 bedrooms
- 05+ bedrooms

- Cars and other vehicles available in Crest in owner-occupied houses/condos
- 0no vehicle
- 1361 vehicle
- 3742 vehicles
- 2773 vehicles
- 1194 vehicles
- 795+ vehicles

- Cars and other vehicles available in Crest in renter-occupied apartments
- 0no vehicle
- 551 vehicle
- 242 vehicles
- 03 vehicles
- 314 vehicles
- 05+ vehicles

- Rooms in owner-occupied houses in Crest, California
- 01 room
- 02 rooms
- 373 rooms
- 674 rooms
- 3205 rooms
- 1836 rooms
- 917 rooms
- 1178 rooms
- 1709+ rooms

- Rooms in renter-occupied apartments in Crest, California
- 01 room
- 282 rooms
- 303 rooms
- 04 rooms
- 225 rooms
- 96 rooms
- 217 rooms
- 08 rooms
- 09+ rooms


Crest, CA household income distribution

- 38Less than $10,000
- 36$10,000 to $19,999
- 74$20,000 to $29,999
- 39$30,000 to $39,999
- 88$40,000 to $49,999
- 59$50,000 to $59,999
- 60$60,000 to $74,999
- 104$75,000 to $99,999
- 82$100,000 to $124,999
- 227$125,000 to $149,999
- 135$150,000 to $199,999
- 153$200,000 or more

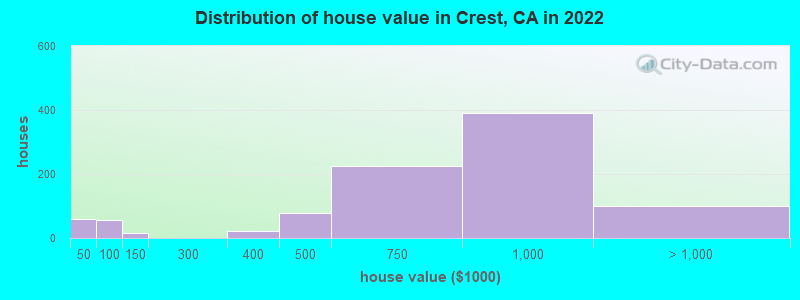
Home value of owner - occupied houses in 2022 in Crest, CA
-
- 50Less than $10,000
- 7$20,000 to $24,999
- 37$50,000 to $59,999
- 9$60,000 to $69,999
- 7$70,000 to $79,999
- 15$100,000 to $124,999
- 21$300,000 to $399,999
- 78$400,000 to $499,999
- 224$500,000 to $749,999
- 392$750,000 to $999,999
- 49$1,000,000 to $1,499,999
- 23$1,500,000 to $1,999,999
- 27$2,000,000 or more
Rent paid by renters in 2022 in Crest, CA
-
- 11$550 to $599
- 4$900 to $999
- 8$1,250 to $1,499
- 1$1,500 to $1,999
- 43$2,000 to $2,499
- 25No cash rent


Percentage of workers working in this county: 98.9%
Number of people working at home: 66 (5.3% of all workers)
Travel time to work (commute)
- Less than 5 minutes: 8
- 5 to 9 minutes: 57
- 10 to 14 minutes: 132
- 15 to 19 minutes: 170
- 20 to 24 minutes: 205
- 25 to 29 minutes: 69
- 30 to 34 minutes: 197
- 35 to 39 minutes: 31
- 40 to 44 minutes: 117
- 45 to 59 minutes: 116
- 60 to 89 minutes: 4
- 90 or more minutes: 40
Means of transportation to work:
- Drove a car alone: 1,044 (80.2%)
- Carpooled: 110 (8.4%)
- Motorcycle: 5 (0.4%)
- Bicycle: 6 (0.5%)
- Walked: 12 (0.9%)
- Other means: 25 (1.9%)
- Worked at home: 100 (7.7%)

- Unemployment by race in 2022
- Unemployment rate for White non-Hispanic residents
- 4.2%Males
- 5.4%Females
- Unemployment rate for two or more race residents
- 9.1%Males
- Unemployment rate for Hispanic or Latino residents
- 3.7%Males

- Year of entry for the foreign-born population in Crest, California
- 402010 or later
- 772000 to 2009
- 661990 to 1999
- 431980 to 1989
- 511970 to 1979
- 56Before 1970

First ancestries reported:
- European: 130 (7.8%)
- English: 129 (7.7%)
- German: 125 (7.5%)
- American: 87 (5.2%)
- Irish: 46 (2.8%)
- British: 38 (2.3%)
- Scottish: 31 (1.9%)
- Polish: 26 (1.6%)
- Scandinavian: 23 (1.4%)
- Iraqi: 20 (1.2%)
- Northern European: 14 (0.8%)
- Lebanese: 10 (0.6%)
- Croatian: 10 (0.6%)
- Italian: 10 (0.6%)
- Norwegian: 10 (0.6%)
- Portuguese: 7 (0.4%)
- Russian: 7 (0.4%)
- Danish: 6 (0.4%)
- Swedish: 5 (0.3%)
Most common places of birth for foreign-born residents (%):
| Crest: | 49.8% (138) |
| California: | 37.2% (3,881,193) |
| Crest: | 14.1% (39) |
| California: | 0.6% (66,590) |
| Crest: | 11.2% (31) |
| California: | 0.4% (40,941) |
| Crest: | 10.8% (30) |
| California: | 0.6% (60,582) |
| Crest: | 6.5% (18) |
| California: | 7.8% (818,297) |
| Crest: | 4.0% (11) |
| California: | 1.2% (127,477) |
| Crest: | 2.9% (8) |
| California: | 0.6% (57,953) |
Place of birth for U.S.-born residents:
- This state: 2,104
- Other state: 759
- Northeast: 130
- Midwest: 343
- South: 131
- West: 144
98.0% of Crest residents lived in the same house 1 years ago.
Out of people who lived in different houses, 46.9% lived in this county.
Out of people who lived in different counties, 0.0% lived in California.
| Crest: | 98.0% |
| State average: | 88.9% |
Education attainment for males 25 years and older:
- No schooling: 24
- Nursery to 4th grade: 0
- 5th and 6th grade: 0
- 7th and 8th grade: 0
- 9th grade: 6
- 10th grade: 7
- 11th grade: 6
- 12th grade, no diploma: 12
- High school graduate (or equivalency): 279
- Less than 1 year of college: 149
- Some college more than 1 year, no degree: 198
- Associate degree: 43
- Bachelor's degree: 211
- Master's degree: 75
- Professional school degree: 13
- Doctorate degree: 0

Education attainment for females 25 years and older:
- No schooling: 13
- Nursery to 4th grade: 0
- 5th and 6th grade: 0
- 7th and 8th grade: 0
- 9th grade: 0
- 10th grade: 0
- 11th grade: 7
- 12th grade, no diploma: 73
- High school graduate (or equivalency): 214
- Less than 1 year of college: 134
- Some college more than 1 year, no degree: 154
- Associate degree: 166
- Bachelor's degree: 227
- Master's degree: 110
- Professional school degree: 24
- Doctorate degree: 4


Housing units in structures:
- One, detached: 1,091
- One, attached: 4
- Two: 29
- Mobile homes: 16
Housing units lacking complete kitchen facilities in 2022: 4.9%
House/condo owner moved in on average 12 years ago
Renter moved in on average 10 years ago


- 36.2%Utility gas
- 34.9%Electricity
- 15.6%Bottled, tank, or LP gas
- 6.9%Wood
- 3.2%No fuel used
- 2.4%Other fuel
- 0.7%Solar energy
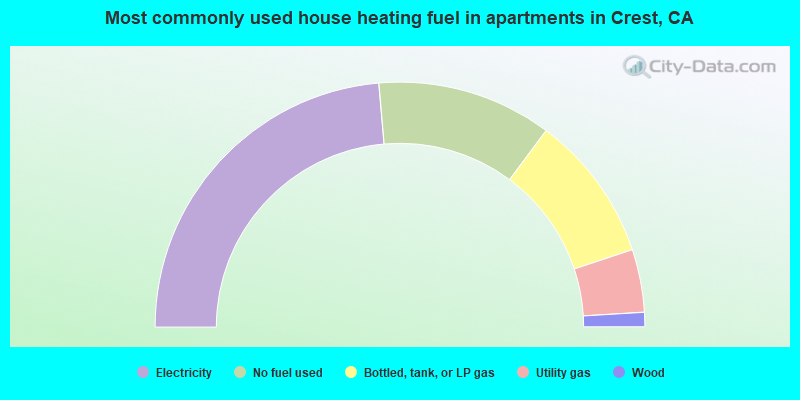
- 47.2%Electricity
- 23.1%No fuel used
- 19.4%Bottled, tank, or LP gas
- 8.3%Utility gas
- 1.9%Wood
Private vs. public school enrollment:
| Here: | 15.2% |
| California: | 10.5% |
| Here: | 5.8% |
| California: | 8.5% |
| Here: | 14.6% |
| California: | 15.9% |


