Cross Mountain, TX (Texas) Houses and Residents
| Cross Mountain: | $504,641 |
| Texas: | $275,400 |
Mean price in 2022:
Detached houses: $503,569
Here: $503,569 State: $369,058
Total population: 3,124 (Urban population: 0, Rural population: 1,545 (26 farm, 1,519 nonfarm))
Houses: 1,617 (1,427 occupied: 1,236 owner occupied, 190 renter occupied)
| % of renters here: | 13% |
| State: | 38% |
Housing density: 220 houses/condos per square mile
Median price asked for vacant for-sale houses and condos in 2022 in this county: $410,780.
Median gross rent in Cross Mountain, TX in 2022: $-689,768,976
Housing units in Cross Mountain with a mortgage: 822 (12 second mortgage, 0 home equity loan, 13 both second mortgage and home equity loan)
Houses without a mortgage: 0
Median household income for houses/condos with a mortgage: $217,313
Median household income for apartments without a mortgage: $94,305
Median monthly housing costs: $1,776
Compare current foreclosures near Cross Mountain, TX:
| Photo | Address | Area | Beds / Baths | Price | Details |
|---|---|---|---|---|---|

|
#1
Timber Park St
San Antonio, TX 78250
|
1,750 sq. feet
|
2 baths 3 beds |
$239,900
|
show details |

|
#2
Whitby Tower
San Antonio, TX 78258
|
2,209 sq. feet
|
3 baths 3 beds |
show details | |

|
#3
Highland Mist Ln
San Antonio, TX 78251
|
2,692 sq. feet
|
2 baths 4 beds |
show details | |

|
#4
Tianna Lace
San Antonio, TX 78253
|
- sq. feet
|
3 baths 5 beds |
show details | |

|
#5
Bricewood Place
Helotes, TX 78023
|
2,333 sq. feet
|
3 baths 3 beds |
show details | |

|
#6
Lark Ave
San Antonio, TX 78228
|
1,092 sq. feet
|
2 baths 4 beds |
show details | |

|
#7
Wood Sorrel
San Antonio, TX 78247
|
2,334 sq. feet
|
2 baths 4 beds |
show details | |

|
#8
Fermi Dr
San Antonio, TX 78228
|
1,835 sq. feet
|
2 baths 4 beds |
show details | |

|
#9
Cheshire Way
San Antonio, TX 78254
|
2,358 sq. feet
|
3 baths 4 beds |
show details | |

|
#10
Mesa Loop
San Antonio, TX 78258
|
3,401 sq. feet
|
2 baths 3 beds |
show details |
| Photo | Address | Area | Beds / Baths | Price | Details |
|---|---|---|---|---|---|

|
#11
Comfort
San Antonio, TX 78228
|
1,066 sq. feet
|
1 baths 3 beds |
show details | |

|
#12
Kingsbridge
San Antonio, TX 78253
|
1,097 sq. feet
|
2 baths 2 beds |
show details | |

|
#13
Impala Way
San Antonio, TX 78258
|
3,921 sq. feet
|
3 baths 4 beds |
show details | |

|
#14
Plaza Lake Dr
San Antonio, TX 78245
|
1,921 sq. feet
|
3 baths 4 beds |
show details | |

|
#15
Tower Creek
San Antonio, TX 78253
|
- sq. feet
|
3 baths 4 beds |
show details | |

|
#16
Timber Laurel
San Antonio, TX 78250
|
2,325 sq. feet
|
3 baths 4 beds |
show details | |

|
#17
Briarbend St
San Antonio, TX 78247
|
1,335 sq. feet
|
2 baths 3 beds |
show details | |

|
#18
Lark Ave
San Antonio, TX 78228
|
1,472 sq. feet
|
1 baths 2 beds |
show details | |

|
#19
Gazelle Clf
San Antonio, TX 78245
|
- sq. feet
|
2 baths 4 beds |
show details | |

|
#20
Villa Madama
San Antonio, TX 78259
|
- sq. feet
|
2 baths 4 beds |
show details |
| Photo | Address | Area | Beds / Baths | Price | Details |
|---|---|---|---|---|---|

|
#21
Santa Anna
San Antonio, TX 78201
|
1,220 sq. feet
|
2 baths 3 beds |
show details | |

|
#22
Cielo Trce
San Antonio, TX 78261
|
2,936 sq. feet
|
2 baths 3 beds |
show details | |

|
#23
Rubidoux Dr
San Antonio, TX 78228
|
864 sq. feet
|
1 baths 4 beds |
show details | |

|
#24
Honeysuckle Ln
San Antonio, TX 78213
|
2,973 sq. feet
|
3 baths 4 beds |
show details | |

|
#25
Autumn Sun
San Antonio, TX 78254
|
- sq. feet
|
2 baths 4 beds |
show details | |

|
#26
Fern Hl
San Antonio, TX 78259
|
3,635 sq. feet
|
2 baths 3 beds |
show details | |

|
#27
Emerald Pl
San Antonio, TX 78245
|
1,609 sq. feet
|
2 baths 3 beds |
show details | |

|
#28
Deer Vlg
San Antonio, TX 78250
|
1,404 sq. feet
|
4 baths 3 beds |
show details | |

|
#29
Belgard Cove
San Antonio, TX 78253
|
1,773 sq. feet
|
3 baths 3 beds |
show details | |

|
#30
Watering Point Dr
San Antonio, TX 78247
|
1,551 sq. feet
|
2 baths 3 beds |
show details |
| Photo | Address | Area | Beds / Baths | Price | Details |
|---|---|---|---|---|---|

|
#31
Colonia
San Antonio, TX 78254
|
3,288 sq. feet
|
2 baths 4 beds |
show details | |

|
#32
Appaloosa Bay
San Antonio, TX 78254
|
1,578 sq. feet
|
2 baths 4 beds |
show details | |

|
#33
Wetmore Knl
San Antonio, TX 78247
|
1,441 sq. feet
|
2 baths 3 beds |
show details | |

|
#34
Benwood Crst
San Antonio, TX 78238
|
1,721 sq. feet
|
2 baths 3 beds |
show details | |

|
#35
Rosemont Dr
San Antonio, TX 78228
|
2,081 sq. feet
|
2 baths 3 beds |
show details | |

|
#36
Pilgrim Dr
San Antonio, TX 78213
|
1,050 sq. feet
|
1 baths 3 beds |
show details | |

|
#37
Pebble Walk
San Antonio, TX 78217
|
1,973 sq. feet
|
2 baths 3 beds |
show details | |

|
#38
Gray Fox Crk
San Antonio, TX 78245
|
- sq. feet
|
2 baths 4 beds |
show details | |

|
#39
Longtailed Duck
San Antonio, TX 78253
|
- sq. feet
|
2 baths 4 beds |
show details | |

|
#40
S Shaenridge
San Antonio, TX 78254
|
1,390 sq. feet
|
2 baths 3 beds |
show details |
| Photo | Address | Area | Beds / Baths | Price | Details |
|---|---|---|---|---|---|

|
#41
Dancing Wolf
San Antonio, TX 78245
|
2,394 sq. feet
|
2 baths 3 beds |
show details | |

|
#42
Old Elm Way
San Antonio, TX 78230
|
- sq. feet
|
2 baths 3 beds |
show details | |

|
#43
W Mistletoe Ave
San Antonio, TX 78212
|
1,132 sq. feet
|
1 baths 2 beds |
show details | |

|
#44
Palomino Pony
San Antonio, TX 78254
|
2,365 sq. feet
|
2 baths 4 beds |
show details | |

|
#45
Orchard Acres
San Antonio, TX 78261
|
2,102 sq. feet
|
2 baths 3 beds |
show details | |

|
#46
Eagle Peak
Helotes, TX 78023
|
2,520 sq. feet
|
4 baths 4 beds |
show details | |

|
#47
Heidi St
San Antonio, TX 78247
|
1,480 sq. feet
|
2 baths 3 beds |
show details | |

|
#48
Kenton Mist
San Antonio, TX 78240
|
1,687 sq. feet
|
2 baths 3 beds |
show details | |

|
#49
White Crown
San Antonio, TX 78254
|
- sq. feet
|
2 baths 3 beds |
show details | |

|
Check over 1 million property listings on Foreclosure.com!
|
browse all offers | |||


Median year apartment built: 2001
Household type by relationship:
Households: 4,625- Male householders: 930 (59 living alone), Female householders: 480 (16 living alone)
1,061 spouses (1,061 opposite-sex spouses), 0 unmarried partners, (0 opposite-sex unmarried partners), 1,716 children (1,546 natural, 77 adopted, 93 stepchildren), 71 grandchildren, 47 brothers or sisters, 276 parents, 0 foster children, 0 other relatives, 31 non-relatives
- In group quarters: 9
Size of family households: 497 2-persons, 329 3-persons, 425 4-persons, 35 5-persons, 36 6-persons.
Size of nonfamily households: 78 1-person.
1,044 married couples with children.
0 single-parent households (0 men, 0 women).
62.9% of residents of Cross Mountain speak English at home.
26.6% of residents speak Spanish at home (53% speak English very well, 38% speak English well, 9% speak English not well).
7.0% of residents speak other Indo-European language at home (44% speak English very well, 37% speak English well, 19% speak English not well).
2.0% of residents speak Asian or Pacific Island language at home (100% speak English very well).
Foreign born population: 748 (16.2%)
(69.5% of them are naturalized citizens)
| Here: | 8.1 |
| State: | 6.3 |
| Here: | 7.9 |
| State: | 4.0 |

- Bedrooms in owner-occupied houses and condos in Cross Mountain, Texas
- 0no bedroom
- 01 bedroom
- 352 bedrooms
- 4583 bedrooms
- 5284 bedrooms
- 2155+ bedrooms

- Bedrooms in renter-occupied apartments in Cross Mountain, Texas
- 0no bedroom
- 01 bedroom
- 382 bedrooms
- 03 bedrooms
- 974 bedrooms
- 555+ bedrooms

- Cars and other vehicles available in Cross Mountain in owner-occupied houses/condos
- 14no vehicle
- 2151 vehicle
- 5902 vehicles
- 2413 vehicles
- 854 vehicles
- 915+ vehicles

- Cars and other vehicles available in Cross Mountain in renter-occupied apartments
- 0no vehicle
- 01 vehicle
- 742 vehicles
- 613 vehicles
- 554 vehicles
- 05+ vehicles

- Rooms in owner-occupied houses in Cross Mountain, Texas
- 01 room
- 02 rooms
- 03 rooms
- 354 rooms
- 2385 rooms
- 1476 rooms
- 677 rooms
- 2238 rooms
- 5269+ rooms

- Rooms in renter-occupied apartments in Cross Mountain, Texas
- 01 room
- 02 rooms
- 03 rooms
- 384 rooms
- 05 rooms
- 326 rooms
- 07 rooms
- 618 rooms
- 599+ rooms


Cross Mountain, TX household income distribution

- 34Less than $10,000
- 37$10,000 to $19,999
- 15$40,000 to $49,999
- 66$50,000 to $59,999
- 73$60,000 to $74,999
- 154$75,000 to $99,999
- 43$100,000 to $124,999
- 189$125,000 to $149,999
- 237$150,000 to $199,999
- 554$200,000 or more

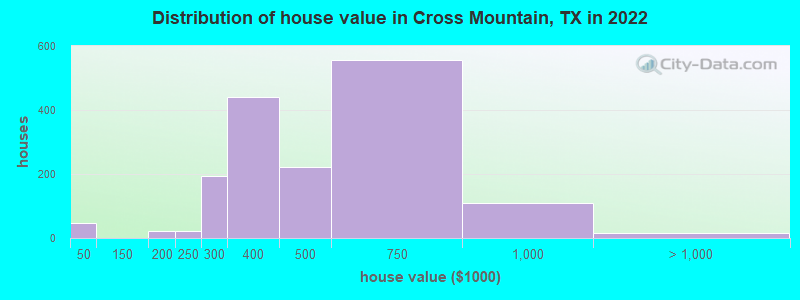
Home value of owner - occupied houses in 2022 in Cross Mountain, TX
-
- 47Less than $10,000
- 13$150,000 to $174,999
- 8$175,000 to $199,999
- 21$200,000 to $249,999
- 193$250,000 to $299,999
- 439$300,000 to $399,999
- 221$400,000 to $499,999
- 556$500,000 to $749,999
- 109$750,000 to $999,999
- 16$2,000,000 or more
Rent paid by renters in 2022 in Cross Mountain, TX
-
- 43Less than $100
- 37$650 to $699
- 37$1,500 to $1,999
- 62$2,000 to $2,499
- 4No cash rent


Percentage of workers working in this county: 87.4%
Number of people working at home: 458 (21.5% of all workers)
Travel time to work (commute)
- Less than 5 minutes: 0
- 5 to 9 minutes: 122
- 10 to 14 minutes: 190
- 15 to 19 minutes: 238
- 20 to 24 minutes: 241
- 25 to 29 minutes: 213
- 30 to 34 minutes: 407
- 35 to 39 minutes: 40
- 40 to 44 minutes: 69
- 45 to 59 minutes: 133
- 60 to 89 minutes: 43
- 90 or more minutes: 13
Means of transportation to work:
- Drove a car alone: 727 (85.0%)
- Carpooled: 31 (3.6%)
- Worked at home: 97 (11.3%)

- Unemployment by race in 2022
- Unemployment rate for White non-Hispanic residents
- 4.0%Females
- Unemployment rate for two or more race residents
- 10.3%Females
- Unemployment rate for Hispanic or Latino residents
- 8.8%Females

- Year of entry for the foreign-born population in Cross Mountain, Texas
- 02010 or later
- 2152000 to 2009
- 1991990 to 1999
- 01980 to 1989
- 561970 to 1979
- 47Before 1970

First ancestries reported:
- German: 378 (13.5%)
- American: 283 (10.1%)
- Iranian: 163 (5.8%)
- Italian: 146 (5.2%)
- English: 98 (3.5%)
- Czech: 42 (1.5%)
- Swedish: 35 (1.2%)
- Albanian: 34 (1.2%)
- Welsh: 26 (0.9%)
- Norwegian: 23 (0.8%)
- European: 21 (0.7%)
- Swiss: 19 (0.7%)
- Irish: 16 (0.6%)
- Finnish: 13 (0.5%)
Most common places of birth for foreign-born residents (%):
| Cross Mountain: | 52.8% (407) |
| Texas: | 48.4% (2,411,723) |
| Cross Mountain: | 19.6% (151) |
| Texas: | 0.6% (28,963) |
| Cross Mountain: | 11.5% (89) |
| Texas: | 4.5% (224,455) |
| Cross Mountain: | 3.1% (24) |
| Texas: | 0.0% (1,967) |
| Cross Mountain: | 2.7% (21) |
| Texas: | 0.0% (1,871) |
| Cross Mountain: | 1.6% (12) |
| Texas: | 1.1% (55,371) |
Place of birth for U.S.-born residents:
- This state: 2,793
- Other state: 1,028
- Northeast: 110
- Midwest: 269
- South: 219
- West: 428
84.5% of Cross Mountain residents lived in the same house 1 years ago.
Out of people who lived in different houses, 24.6% lived in this county.
Out of people who lived in different counties, 74.2% lived in Texas.
| Cross Mountain: | 84.5% |
| State average: | 85.7% |
Education attainment for males 25 years and older:
- No schooling: 23
- Nursery to 4th grade: 0
- 5th and 6th grade: 50
- 7th and 8th grade: 0
- 9th grade: 0
- 10th grade: 0
- 11th grade: 0
- 12th grade, no diploma: 20
- High school graduate (or equivalency): 144
- Less than 1 year of college: 101
- Some college more than 1 year, no degree: 144
- Associate degree: 241
- Bachelor's degree: 334
- Master's degree: 298
- Professional school degree: 146
- Doctorate degree: 81

Education attainment for females 25 years and older:
- No schooling: 0
- Nursery to 4th grade: 54
- 5th and 6th grade: 0
- 7th and 8th grade: 0
- 9th grade: 70
- 10th grade: 0
- 11th grade: 0
- 12th grade, no diploma: 0
- High school graduate (or equivalency): 224
- Less than 1 year of college: 143
- Some college more than 1 year, no degree: 23
- Associate degree: 182
- Bachelor's degree: 388
- Master's degree: 265
- Professional school degree: 135
- Doctorate degree: 113


Housing units in structures:
- One, detached: 1,556
- Mobile homes: 61
House/condo owner moved in on average 8 years ago
Renter moved in on average 0 years ago


- 50.7%Utility gas
- 44.1%Electricity
- 5.3%Bottled, tank, or LP gas
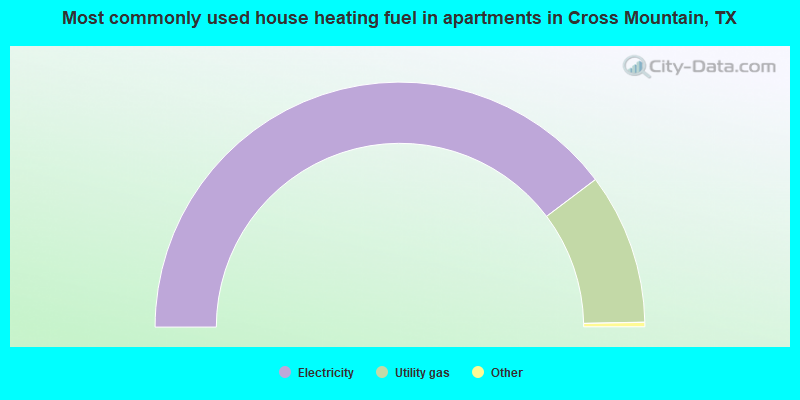
- 79.9%Electricity
- 20.1%Utility gas
Private vs. public school enrollment:
| Here: | 0.0% |
| Texas: | 8.8% |
| Here: | 23.2% |
| Texas: | 8.0% |
| Here: | 7.2% |
| Texas: | 16.2% |


