Housing density: 3,753 houses/condos per square mile
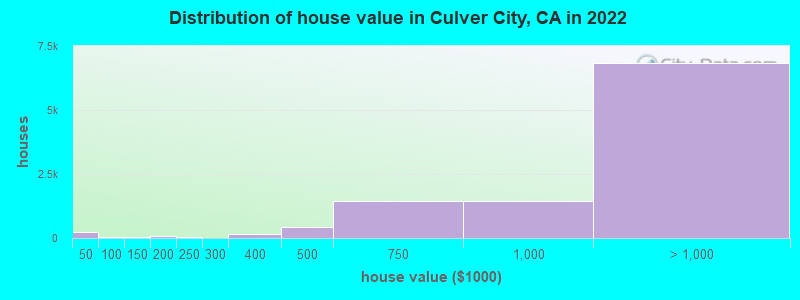
Median price asked for vacant for-sale houses and condos in 2022: $1,546,897.
Median contract rent in 2022: over $2,000 (lower quartile is $1,849, upper quartile is over $2,000)
Median rent asked for vacant for-rent units in 2022: $2,676
Median gross rent in Culver City, CA in 2022: over $2,000
Housing units in Culver City with a mortgage: 6,677 (751 second mortgage, 17 home equity loan, 710 both second mortgage and home equity loan) Houses without a mortgage: 26
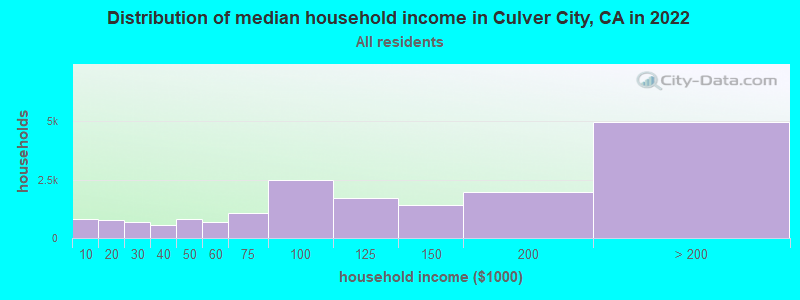
Median household income for houses/condos with a mortgage: $175,136
Median household income for apartments without a mortgage: $83,537
Median monthly housing costs: $2,492
Compare current foreclosures near Culver City, CA:
6,162 married couples with children.
899 single-parent households (239 men, 660 women).
64.9% of residents of Culver City speak English at home.
16.2% of residents speak Spanish at home (79% speak English very well, 15% speak English well, 5% speak English not well, 1% don't speak English at all).
7.6% of residents speak other Indo-European language at home (88% speak English very well, 9% speak English well, 1% speak English not well, 2% don't speak English at all).
9.7% of residents speak Asian or Pacific Island language at home (68% speak English very well, 23% speak English well, 3% speak English not well, 5% don't speak English at all).
2.1% of residents speak other language at home (88% speak English very well, 7% speak English well, 5% speak English not well).
Foreign born population: 9,476 (24.0%)
(59.2% of them are naturalized citizens)
Percentage of workers working in this county: 97.4% Number of people working at home: 7,229 (33.4% of all workers)
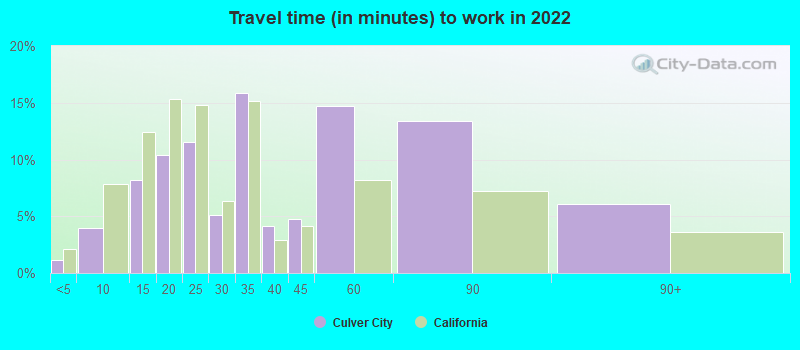
Travel time to work (commute)
Less than 5 minutes: 184
5 to 9 minutes: 738
10 to 14 minutes: 1,657
15 to 19 minutes: 2,050
20 to 24 minutes: 2,381
25 to 29 minutes: 1,086
30 to 34 minutes: 3,839
35 to 39 minutes: 645
40 to 44 minutes: 751
45 to 59 minutes: 1,265
60 to 89 minutes: 695
90 or more minutes: 160
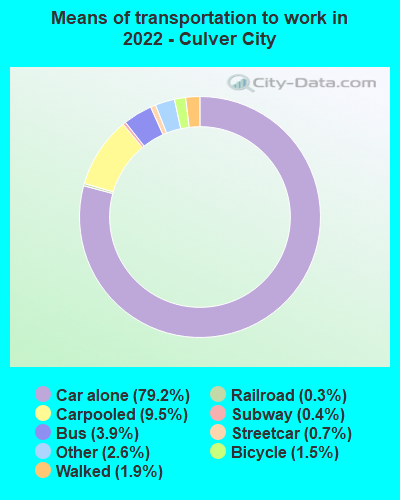
Means of transportation to work:
Drove a car alone: 31,102 (66.2%)
Carpooled: 4,111 (8.8%)
Bus: 1,386 (3.0%)
Subway or elevated rail: 202 (0.4%)
Long-distance train or commuter rail: 98 (0.2%)
Light rail, streetcar or trolley: 66 (0.1%)
Ferryboat: 22 (0.0%)
Taxi: 1,110 (2.4%)
Bicycle: 594 (1.3%)
Walked: 821 (1.7%)
Worked at home: 7,229 (15.4%)
Unemployment by race in 2022
Unemployment rate for White non-Hispanic residents
5.0%Males
3.4%Females
Unemployment rate for Black residents
8.4%Males
17.1%Females
Unemployment rate for Asian residents
0.5%Males
4.1%Females
Unemployment rate for other race residents
6.2%Males
6.9%Females
Unemployment rate for two or more race residents
3.3%Males
2.7%Females
Unemployment rate for Hispanic or Latino residents
4.4%Males
2.0%Females
Year of entry for the foreign-born population in Culver City, California
2,5792010 or later
1,9952000 to 2009
1,5871990 to 1999
3,2961980 to 1989
2,0851970 to 1979
2,216Before 1970
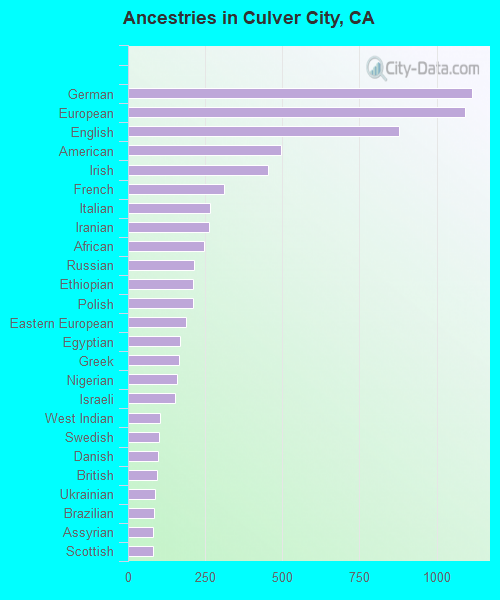
First ancestries reported:
German: 1,114 (5.0%)
European: 1,092 (4.9%)
English: 879 (3.9%)
American: 496 (2.2%)
Irish: 455 (2.0%)
French: 310 (1.4%)
Italian: 267 (1.2%)
Iranian: 261 (1.2%)
African: 246 (1.1%)
Russian: 215 (1.0%)
Ethiopian: 212 (0.9%)
Polish: 211 (0.9%)
Eastern European: 189 (0.8%)
Egyptian: 169 (0.8%)
Greek: 164 (0.7%)
Nigerian: 159 (0.7%)
Israeli: 152 (0.7%)
West Indian: 104 (0.5%)
Swedish: 100 (0.4%)
Danish: 96 (0.4%)
British: 94 (0.4%)
Ukrainian: 89 (0.4%)
Brazilian: 85 (0.4%)
Assyrian: 80 (0.4%)
Scottish: 80 (0.4%)
French Canadian: 79 (0.4%)
Welsh: 71 (0.3%)
Canadian: 66 (0.3%)
Jamaican: 63 (0.3%)
Dutch: 61 (0.3%)
Turkish: 60 (0.3%)
Lithuanian: 50 (0.2%)
Norwegian: 40 (0.2%)
Lebanese: 35 (0.2%)
Hungarian: 33 (0.1%)
Armenian: 31 (0.1%)
Portuguese: 31 (0.1%)
Cajun: 26 (0.1%)
Northern European: 22 (0.10%)
Guyanese: 21 (0.09%)
Scandinavian: 17 (0.08%)
Czech: 17 (0.08%)
Finnish: 15 (0.07%)
Romanian: 15 (0.07%)
Bulgarian: 14 (0.06%)
Haitian: 13 (0.06%)
Scotch-Irish: 12 (0.05%)
Ghanaian: 11 (0.05%)
Basque: 11 (0.05%)
Austrian: 11 (0.05%)
Australian: 8 (0.04%)
Pennsylvania German: 8 (0.04%)
Swiss: 8 (0.04%)
Slovak: 7 (0.03%)
Belgian: 6 (0.03%)
Czechoslovakian: 2 (0.01%)
Most common places of birth for foreign-born residents (%):
Mexico
Culver City:
15.2% (1,436)
California:
37.2% (3,881,193)
China, excluding Hong Kong and Taiwan
Culver City:
8.5% (807)
California:
6.6% (684,672)
India
Culver City:
7.0% (662)
California:
5.2% (539,184)
Philippines
Culver City:
6.3% (597)
California:
7.8% (818,297)
Japan
Culver City:
4.8% (453)
California:
1.0% (103,575)
United Kingdom, excluding England and Scotland
Culver City:
3.8% (361)
California:
0.6% (60,582)
Korea
Culver City:
3.3% (313)
California:
3.0% (315,248)
Israel
Culver City:
3.0% (283)
California:
0.3% (33,029)
Canada
Culver City:
2.9% (278)
California:
1.2% (127,477)
Iran
Culver City:
2.7% (259)
California:
2.0% (206,004)
Colombia
Culver City:
2.5% (235)
California:
0.5% (55,249)
Venezuela
Culver City:
2.4% (229)
California:
0.2% (16,998)
Burma (Myanmar)
Culver City:
2.1% (202)
California:
0.3% (28,176)
Egypt
Culver City:
2.0% (193)
California:
0.4% (42,718)
Taiwan
Culver City:
2.0% (190)
California:
1.7% (176,274)
Germany
Culver City:
1.9% (184)
California:
0.7% (73,304)
El Salvador
Culver City:
1.9% (180)
California:
4.2% (440,287)
Brazil
Culver City:
1.8% (172)
California:
0.5% (53,222)
Guatemala
Culver City:
1.7% (157)
California:
2.8% (290,436)
Ethiopia
Culver City:
1.6% (149)
California:
0.2% (24,635)
Place of birth for U.S.-born residents:
This state: 18,109
Other state: 10,894
Northeast: 3,749
Midwest: 3,052
South: 2,413
West: 1,674
90.2% of Culver City residents lived in the same house 1 years ago. Out of people who lived in different houses, 44.1% lived in this county. Out of people who lived in different counties, 37.7% lived in California.
Culver City:
90.2%
State average:
88.9%
Education attainment for males 25 years and older:
No schooling: 297
Nursery to 4th grade: 13
5th and 6th grade: 174
7th and 8th grade: 28
9th grade: 97
10th grade: 54
11th grade: 69
12th grade, no diploma: 274
High school graduate (or equivalency): 1,594
Less than 1 year of college: 405
Some college more than 1 year, no degree: 1,686
Associate degree: 683
Bachelor's degree: 4,597
Master's degree: 2,702
Professional school degree: 810
Doctorate degree: 578
Education attainment for females 25 years and older:
No schooling: 266
Nursery to 4th grade: 88
5th and 6th grade: 105
7th and 8th grade: 4
9th grade: 51
10th grade: 71
11th grade: 49
12th grade, no diploma: 310
High school graduate (or equivalency): 1,499
Less than 1 year of college: 652
Some college more than 1 year, no degree: 1,678
Associate degree: 1,011
Bachelor's degree: 6,017
Master's degree: 3,391
Professional school degree: 1,009
Doctorate degree: 726
Housing units in structures:
One, detached: 7,166
One, attached: 1,814
Two: 639
3 or 4: 1,652
5 to 9: 1,311
10 to 19: 1,324
20 to 49: 2,025
50 or more: 3,104
Mobile homes: 157
Median worth of mobile homes: $115,369
Housing units lacking complete plumbing facilities in 2022: 0.2%
Housing units lacking complete kitchen facilities in 2022: 1.8%
House/condo owner moved in on average 17 years ago