Custer, WA (Washington) Houses and Residents
| Custer: | $540,321 |
| Washington: | $569,500 |
Mean price in 2022:
Detached houses: $639,485
Here: $639,485 State: $734,307 Mobile homes: $115,877
Here: $115,877 State: $218,362
Total population: 366 (Urban population: 0, Rural population: 188 (all nonfarm))
Houses: 135 (135 occupied: 115 owner occupied, 20 renter occupied)
| % of renters here: | 15% |
| State: | 36% |
Housing density: 74 houses/condos per square mile
Median price asked for vacant for-sale houses and condos in 2022 in this county: $799,591.
Median gross rent in Custer, WA in 2022: $-693,917,274
Housing units in Custer with a mortgage: 119 (0 second mortgage, 0 home equity loan, 0 both second mortgage and home equity loan)
Houses without a mortgage: 0
Median household income for houses/condos with a mortgage: $99,062
Median monthly housing costs: $1,649
Compare current foreclosures near Custer, WA:
| Photo | Address | Area | Beds / Baths | Price | Details |
|---|---|---|---|---|---|

|
#1
Stein Rd
Custer, WA 98240
|
1,782 sq. feet
|
2 baths 3 beds |
show details | |

|
#2
Velvet Ln
Custer, WA 98240
|
- sq. feet
|
- baths - beds |
show details | |

|
#3
19th St
Lynden, WA 98264
|
1,596 sq. feet
|
2 baths 3 beds |
show details | |

|
#4
E Cedar Dr
Lynden, WA 98264
|
3,823 sq. feet
|
3 baths 4 beds |
show details | |

|
#5
Mosier Ln
Ferndale, WA 98248
|
1,248 sq. feet
|
1 baths 3 beds |
show details | |

|
#6
Glenmore St
Ferndale, WA 98248
|
- sq. feet
|
2 baths 3 beds |
show details | |

|
#7
W Pole Rd
Lynden, WA 98264
|
1,248 sq. feet
|
1 baths 2 beds |
show details | |

|
#8
Salish Rd
Blaine, WA 98230
|
1,188 sq. feet
|
2 baths 3 beds |
show details | |

|
#9
15th St
Bellingham, WA 98225
|
2,970 sq. feet
|
2 baths 3 beds |
show details | |

|
#10
Harksell Rd
Ferndale, WA 98248
|
1,801 sq. feet
|
2 baths 4 beds |
show details |
| Photo | Address | Area | Beds / Baths | Price | Details |
|---|---|---|---|---|---|

|
#11
Chehalis Rd
Blaine, WA 98230
|
1,488 sq. feet
|
2 baths 3 beds |
show details | |

|
#12
Sutton Dr
Everson, WA 98247
|
1,330 sq. feet
|
1 baths 3 beds |
show details | |

|
#13
Salish Rd
Blaine, WA 98230
|
1,731 sq. feet
|
2 baths 3 beds |
show details | |

|
#14
Dover St
Bellingham, WA 98226
|
1,606 sq. feet
|
2 baths 3 beds |
show details | |

|
#15
W Maplewood Ave
Bellingham, WA 98225
|
2,261 sq. feet
|
2 baths 3 beds |
show details | |

|
#16
Sterling Dr
Bellingham, WA 98226
|
1,222 sq. feet
|
1 baths 2 beds |
show details | |

|
#17
Cottonwood Ave
Bellingham, WA 98225
|
1,235 sq. feet
|
1 baths 3 beds |
show details | |

|
#18
Glenning St
Lynden, WA 98264
|
1,332 sq. feet
|
1 baths 2 beds |
show details | |

|
#19
Kobe Ct
Everson, WA 98247
|
1,930 sq. feet
|
2 baths 3 beds |
show details | |

|
#20
Northwest Ave
Bellingham, WA 98225
|
1,101 sq. feet
|
1 baths 2 beds |
show details |
| Photo | Address | Area | Beds / Baths | Price | Details |
|---|---|---|---|---|---|

|
#21
Everson Goshen Rd
Bellingham, WA 98226
|
2,021 sq. feet
|
2 baths 3 beds |
show details | |

|
#22
Hampton Pl
Bellingham, WA 98225
|
881 sq. feet
|
1 baths 2 beds |
show details | |

|
#23
Irving St
Bellingham, WA 98225
|
1,140 sq. feet
|
1 baths 3 beds |
show details | |

|
#24
Westhills Pl
Bellingham, WA 98226
|
3,114 sq. feet
|
2 baths 3 beds |
show details | |

|
#25
Undine St
Bellingham, WA 98226
|
1,664 sq. feet
|
1 baths 2 beds |
show details | |

|
#26
Valencia St
Bellingham, WA 98226
|
888 sq. feet
|
1 baths 3 beds |
show details | |

|
#27
S State St Apt 416
Bellingham, WA 98225
|
815 sq. feet
|
1 baths 1 beds |
show details | |

|
#28
Ellis St
Bellingham, WA 98225
|
952 sq. feet
|
2 baths 2 beds |
show details | |

|
#29
N Grace Ln
Bellingham, WA 98226
|
2,220 sq. feet
|
2 baths 3 beds |
show details | |

|
#30
Otis St
Bellingham, WA 98225
|
726 sq. feet
|
1 baths 2 beds |
show details |
| Photo | Address | Area | Beds / Baths | Price | Details |
|---|---|---|---|---|---|

|
#31
12th St
Bellingham, WA 98225
|
1,914 sq. feet
|
2 baths 3 beds |
show details | |

|
#32
Flynn St Spc 51
Bellingham, WA 98229
|
784 sq. feet
|
1 baths 2 beds |
show details | |

|
#33
Yew Street Rd
Bellingham, WA 98229
|
1,120 sq. feet
|
1 baths 2 beds |
show details | |

|
#34
Harrison Ave
Blaine, WA 98230
|
1,606 sq. feet
|
2 baths 3 beds |
show details | |

|
#35
Old Samish Rd
Bellingham, WA 98229
|
2,240 sq. feet
|
2 baths 6 beds |
show details | |

|
#36
Leeside Dr
Blaine, WA 98230
|
1,344 sq. feet
|
2 baths 3 beds |
show details | |

|
#37
Enterprise Rd, Trlr 16
Ferndale, WA 98248
|
1,248 sq. feet
|
1 baths 3 beds |
show details | |

|
#38
Cedar St
Ferndale, WA 98248
|
2,462 sq. feet
|
2 baths 4 beds |
show details | |

|
#39
Thor Pl
Ferndale, WA 98248
|
1,072 sq. feet
|
1 baths 3 beds |
show details | |

|
#40
Ryan Dr
Ferndale, WA 98248
|
856 sq. feet
|
1 baths 3 beds |
show details |
| Photo | Address | Area | Beds / Baths | Price | Details |
|---|---|---|---|---|---|

|
#41
Meadow Crescent St
Ferndale, WA 98248
|
1,738 sq. feet
|
2 baths 3 beds |
show details | |

|
#42
Tall Cedars Ln
Ferndale, WA 98248
|
1,056 sq. feet
|
1 baths 2 beds |
show details | |

|
#43
Timmerman Ln
Ferndale, WA 98248
|
672 sq. feet
|
2 baths 4 beds |
show details | |

|
#44
Douglas Rd, Trlr 31
Ferndale, WA 98248
|
1,604 sq. feet
|
2 baths 3 beds |
show details | |

|
#45
N Enterprise Rd
Ferndale, WA 98248
|
1,008 sq. feet
|
1 baths 6 beds |
show details | |

|
#46
Poplar Pl
Ferndale, WA 98248
|
880 sq. feet
|
1 baths 3 beds |
show details | |

|
#47
Alderson Rd Unit 302
Blaine, WA 98230
|
1,004 sq. feet
|
2 baths 2 beds |
show details | |

|
#48
Halibut Dr
Blaine, WA 98230
|
1,497 sq. feet
|
2 baths 3 beds |
show details | |

|
#49
Grandview Rd
Ferndale, WA 98248
|
1,232 sq. feet
|
1 baths 3 beds |
show details | |

|
Check over 1 million property listings on Foreclosure.com!
|
browse all offers | |||

Latest news about housing in Custer, WA collected exclusively by city-data.com from local newspapers, TV, and radio stations


Household type by relationship:
Households: 306- Male householders: 38 (18 living alone), Female householders: 94 (16 living alone)
78 spouses (78 opposite-sex spouses), 22 unmarried partners, (22 opposite-sex unmarried partners), 72 children (72 natural, 0 adopted, 0 stepchildren), 0 grandchildren, 0 brothers or sisters, 0 parents, 0 foster children, 0 other relatives, 0 non-relatives
Size of family households: 55 2-persons, 10 3-persons, 12 4-persons, 11 5-persons.
Size of nonfamily households: 39 1-person, 7 2-persons.
40 married couples with children.
18 single-parent households (0 men, 18 women).
93.7% of residents of Custer speak English at home.
4.9% of residents speak other Indo-European language at home (100% speak English very well).
Foreign born population: 18 (5.9%)
(88.9% of them are naturalized citizens)
| Here: | 6.9 |
| State: | 6.5 |
| Here: | -633333332.7 |
| State: | 3.9 |

- Bedrooms in owner-occupied houses and condos in Custer, Washington
- 0no bedroom
- 01 bedroom
- 02 bedrooms
- 573 bedrooms
- 474 bedrooms
- 115+ bedrooms

- Bedrooms in renter-occupied apartments in Custer, Washington
- 0no bedroom
- 171 bedroom
- 02 bedrooms
- 43 bedrooms
- 04 bedrooms
- 05+ bedrooms

- Cars and other vehicles available in Custer in owner-occupied houses/condos
- 0no vehicle
- 01 vehicle
- 292 vehicles
- 323 vehicles
- 344 vehicles
- 205+ vehicles

- Cars and other vehicles available in Custer in renter-occupied apartments
- 0no vehicle
- 171 vehicle
- 42 vehicles
- 03 vehicles
- 04 vehicles
- 05+ vehicles

- Rooms in owner-occupied houses in Custer, Washington
- 01 room
- 02 rooms
- 03 rooms
- 144 rooms
- 05 rooms
- 206 rooms
- 697 rooms
- 08 rooms
- 149+ rooms

- Rooms in renter-occupied apartments in Custer, Washington
- 01 room
- 02 rooms
- 173 rooms
- 04 rooms
- 05 rooms
- 46 rooms
- 07 rooms
- 08 rooms
- 09+ rooms


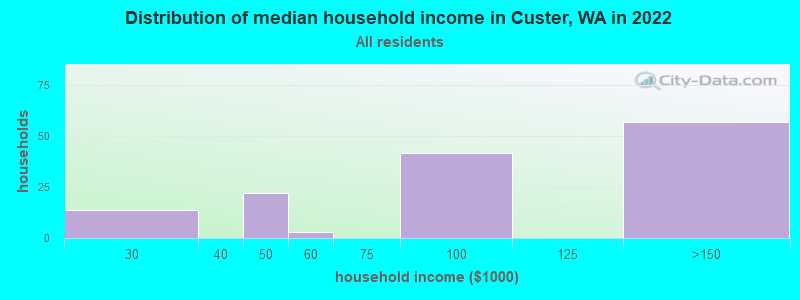
Custer, WA household income distribution

- 14$20,000 to $29,999
- 22$40,000 to $49,999
- 3$50,000 to $59,999
- 42$75,000 to $99,999
- 57$125,000 to $149,999
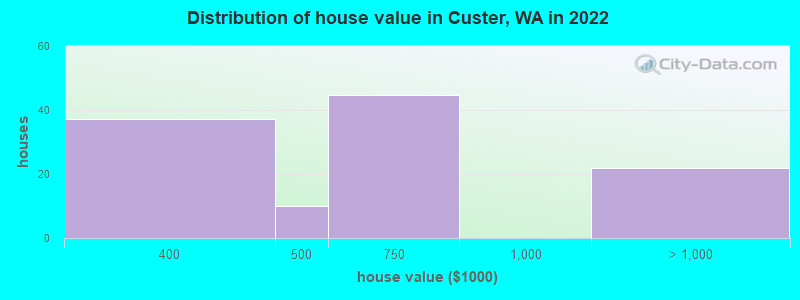
Home value of owner - occupied houses in 2022 in Custer, WA
-
- 37$300,000 to $399,999
- 10$400,000 to $499,999
- 44$500,000 to $749,999
- 21$1,000,000 to $1,499,999
Rent paid by renters in 2022 in Custer, WA
-
- 5$400 to $449
- 22$750 to $799


Percentage of workers working in this county: 83.5%
Number of people working at home: 19 (9.8% of all workers)
Travel time to work (commute)
- Less than 5 minutes: 0
- 5 to 9 minutes: 17
- 10 to 14 minutes: 2
- 15 to 19 minutes: 104
- 20 to 24 minutes: 0
- 25 to 29 minutes: 0
- 30 to 34 minutes: 21
- 35 to 39 minutes: 0
- 40 to 44 minutes: 0
- 45 to 59 minutes: 24
- 60 to 89 minutes: 0
- 90 or more minutes: 0
Means of transportation to work:
- Drove a car alone: 60 (82.2%)
- Carpooled: 13 (17.8%)

- Unemployment by race in 2022
- Unemployment rate for White non-Hispanic residents
- 34.0%Males

- Year of entry for the foreign-born population in Custer, Washington
- 02010 or later
- 132000 to 2009
- 41990 to 1999
- 01980 to 1989
- 01970 to 1979
- 6Before 1970
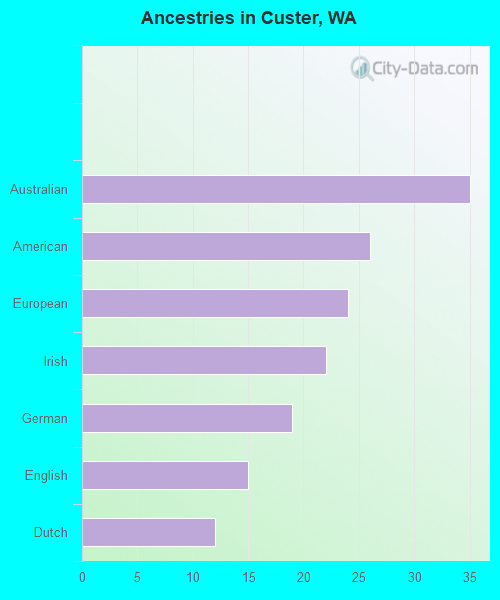
First ancestries reported:
- Australian: 35 (16.0%)
- American: 26 (11.9%)
- European: 24 (10.9%)
- Irish: 22 (10.0%)
- German: 19 (8.7%)
- English: 15 (6.8%)
- Dutch: 12 (5.5%)
Most common places of birth for foreign-born residents (%):
| Custer: | 64.7% (11) |
| Washington: | 0.4% (4,499) |
| Custer: | 23.5% (4) |
| Washington: | 21.1% (241,655) |
Place of birth for U.S.-born residents:
- This state: 186
- Other state: 73
- Northeast: 0
- Midwest: 30
- South: 0
- West: 41
96.3% of Custer residents lived in the same house 1 years ago.
Out of people who lived in different houses, 50.0% lived in this county.
| Custer: | 96.3% |
| State average: | 85.2% |
Education attainment for males 25 years and older:
- No schooling: 0
- Nursery to 4th grade: 0
- 5th and 6th grade: 0
- 7th and 8th grade: 0
- 9th grade: 0
- 10th grade: 0
- 11th grade: 0
- 12th grade, no diploma: 0
- High school graduate (or equivalency): 56
- Less than 1 year of college: 10
- Some college more than 1 year, no degree: 5
- Associate degree: 0
- Bachelor's degree: 51
- Master's degree: 0
- Professional school degree: 0
- Doctorate degree: 0

Education attainment for females 25 years and older:
- No schooling: 9
- Nursery to 4th grade: 0
- 5th and 6th grade: 0
- 7th and 8th grade: 0
- 9th grade: 0
- 10th grade: 0
- 11th grade: 0
- 12th grade, no diploma: 0
- High school graduate (or equivalency): 41
- Less than 1 year of college: 9
- Some college more than 1 year, no degree: 0
- Associate degree: 0
- Bachelor's degree: 12
- Master's degree: 56
- Professional school degree: 0
- Doctorate degree: 0


Housing units in structures:
- One, detached: 87
- 5 to 9: 16
- Mobile homes: 30

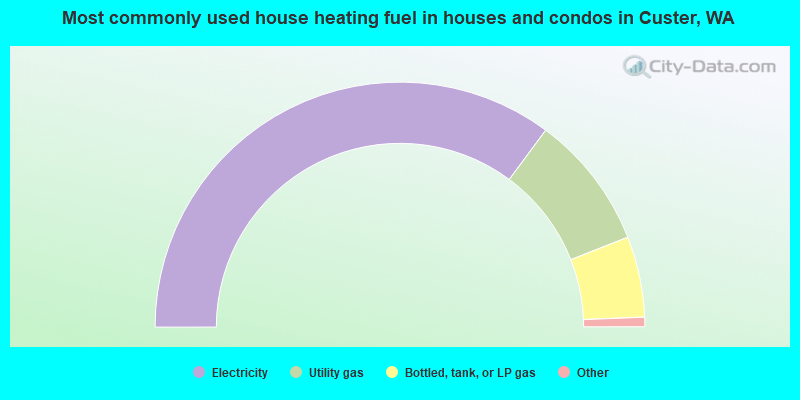
- 71.2%Electricity
- 18.0%Utility gas
- 10.8%Bottled, tank, or LP gas
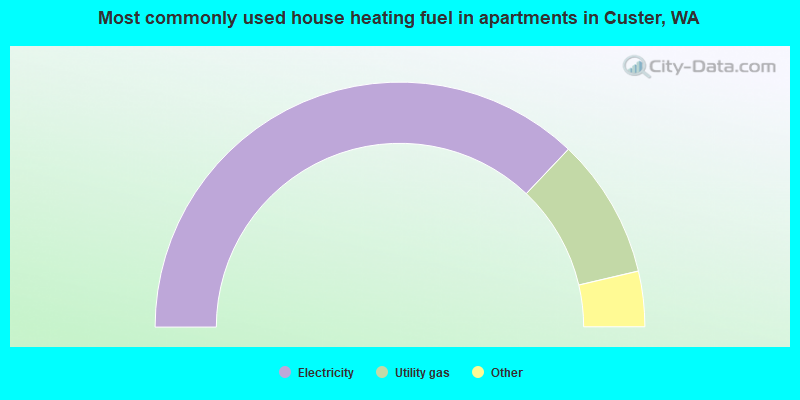
- 80.0%Electricity
- 20.0%Utility gas
Private vs. public school enrollment:
| Here: | 100.0% |
| Washington: | 12.4% |


