Housing density: 870 houses/condos per square mile
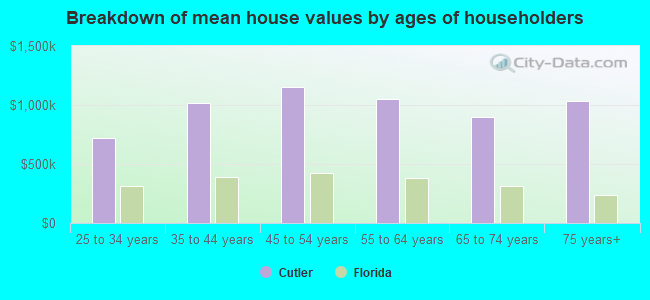
Median price asked for vacant for-sale houses and condos in 2022 in this county: $886,894.
Median contract rent in 2022: $1,559 (lower quartile is $1,294, upper quartile is over $2,000)
Median rent asked for vacant for-rent units in 2022: $3,003
Median gross rent in Cutler, FL in 2022: $1,734
Housing units in Cutler with a mortgage: 3,692 (551 second mortgage, 449 home equity loan, 0 both second mortgage and home equity loan) Houses without a mortgage: 1,120
In family households: 2,110,320 (364,641 male householders, 238,270 female householders)
380,241 spouses, 721,944 children (670,830 natural, 12,263 adopted, 38,851 stepchildren), 77,135 grandchildren, 45,441 brothers or sisters, 59,104 parents, foster children, 82,017 other relatives, 102,016 non-relatives
In nonfamily households: 346,058 (129,381 male householders (94,284 living alone)), 135,060 female householders (109,939 living alone)), 81,617 nonrelatives
In group quarters: 40,057 (20,640 institutionalized population)
319,467 married couples with children.
152,668 single-parent households (27,448 men, 125,220 women).
63.5% of residents of Cutler speak English at home.
27.8% of residents speak Spanish at home (76% speak English very well, 15% speak English well, 7% speak English not well, 3% don't speak English at all).
5.7% of residents speak other Indo-European language at home (78% speak English very well, 16% speak English well, 5% speak English not well).
2.4% of residents speak Asian or Pacific Island language at home (61% speak English very well, 22% speak English well, 17% speak English not well, 1% don't speak English at all).
0.5% of residents speak other language at home (81% speak English very well, 13% speak English well, 6% speak English not well).
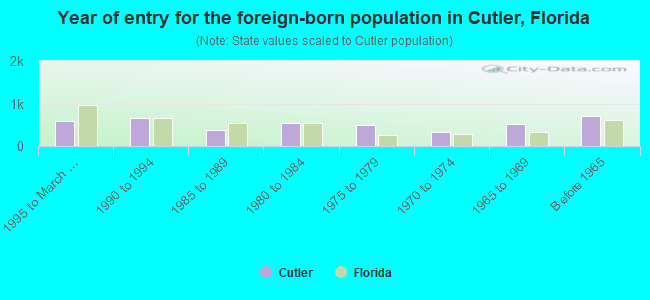
Foreign born population: 5,302 (25.3%)
(74.6% of them are naturalized citizens)
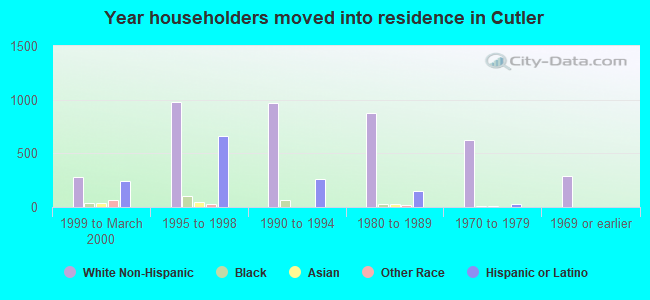
Year of entry for the foreign-born population in Cutler, Florida
5771995 to March 2000
6591990 to 1994
3691985 to 1989
5521980 to 1984
4881975 to 1979
3271970 to 1974
5101965 to 1969
710Before 1965
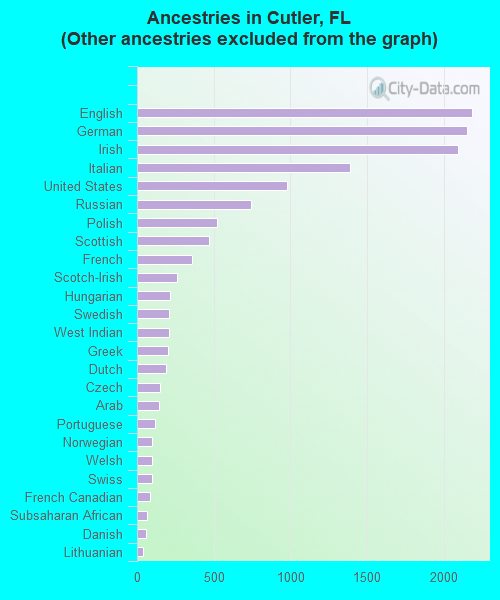
First ancestries reported:
Other: 7,759 (37.0%)
English: 2,187 (10.4%)
German: 2,152 (10.3%)
Irish: 2,091 (10.0%)
Italian: 1,390 (6.6%)
United States: 978 (4.7%)
Russian: 745 (3.6%)
Polish: 524 (2.5%)
Scottish: 472 (2.3%)
French: 360 (1.7%)
Scotch-Irish: 260 (1.2%)
Hungarian: 217 (1.0%)
Swedish: 212 (1.0%)
West Indian: 211 (1.0%)
Greek: 204 (1.0%)
Dutch: 189 (0.9%)
Czech: 148 (0.7%)
Arab: 144 (0.7%)
Portuguese: 119 (0.6%)
Norwegian: 100 (0.5%)
Welsh: 99 (0.5%)
Swiss: 96 (0.5%)
French Canadian: 87 (0.4%)
Subsaharan African: 63 (0.3%)
Danish: 60 (0.3%)
Lithuanian: 36 (0.2%)
Ukrainian: 34 (0.2%)
Slovak: 6 (0.03%)
Most common places of birth for foreign-born residents (%):
Cuba
Cutler:
25.4% (1,066)
Florida:
24.1% (642,951)
Colombia
Cutler:
8.1% (340)
Florida:
5.9% (157,371)
Argentina
Cutler:
5.5% (232)
Florida:
1.0% (28,022)
Nicaragua
Cutler:
5.4% (226)
Florida:
3.7% (98,022)
Mexico
Cutler:
5.1% (214)
Florida:
7.1% (189,119)
Brazil
Cutler:
4.9% (204)
Florida:
1.7% (44,536)
Jamaica
Cutler:
3.5% (148)
Florida:
5.3% (141,182)
Italy
Cutler:
2.7% (113)
Florida:
1.2% (31,508)
Japan
Cutler:
2.4% (102)
Florida:
0.4% (9,678)
Venezuela
Cutler:
2.3% (95)
Florida:
1.8% (47,351)
Chile
Cutler:
2.1% (90)
Florida:
0.6% (15,919)
Philippines
Cutler:
2.1% (88)
Florida:
1.6% (43,422)
United Kingdom
Cutler:
2.0% (84)
Florida:
2.6% (70,384)
Iran
Cutler:
1.8% (77)
Florida:
0.2% (6,651)
Canada
Cutler:
1.8% (74)
Florida:
3.7% (99,139)
Peru
Cutler:
1.6% (66)
Florida:
2.0% (53,939)
Trinidad and Tobago
Cutler:
1.5% (64)
Florida:
1.1% (28,788)
Place of birth for U.S.-born residents:
This state: 6,711
Other state: 6,237
Northeast: 2,709
Midwest: 1,385
South: 1,431
West: 712
59% of Cutler residents lived in the same house 5 years ago. Out of people who lived in different houses, 78% lived in this county. Out of people who lived in different counties, 13% lived in Florida.
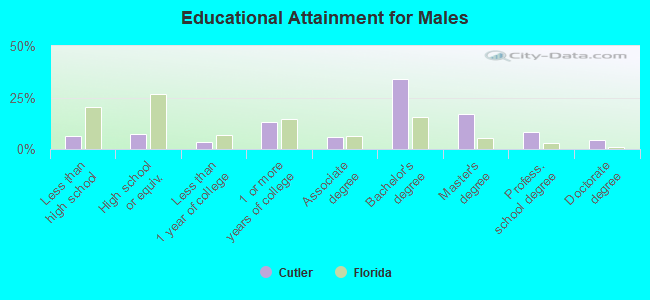
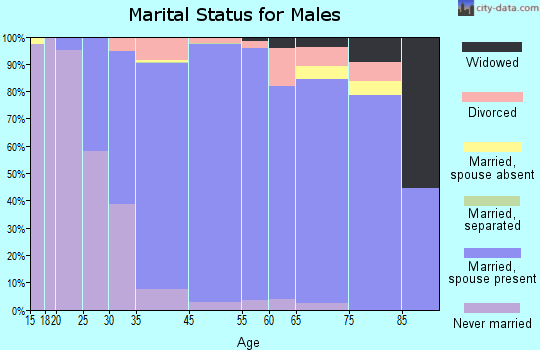
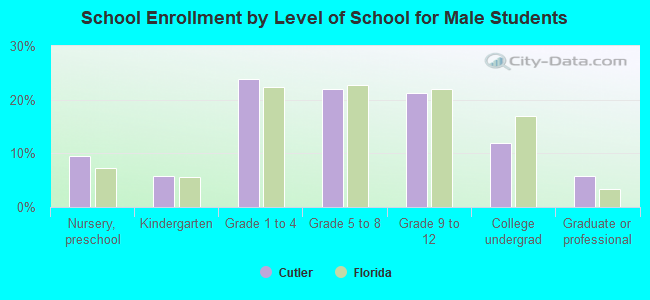
Education attainment for males 25 years and older:
No schooling: 24
Nursery to 4th grade: 0
5th and 6th grade: 26
7th and 8th grade: 25
9th grade: 27
10th grade: 42
11th grade: 38
12th grade, no diploma: 166
High school graduate (or equivalency): 409
Less than 1 year of college: 183
Some college more than 1 year, no degree: 715
Associate degree: 328
Bachelor's degree: 1,876
Master's degree: 943
Professional school degree: 467
Doctorate degree: 240
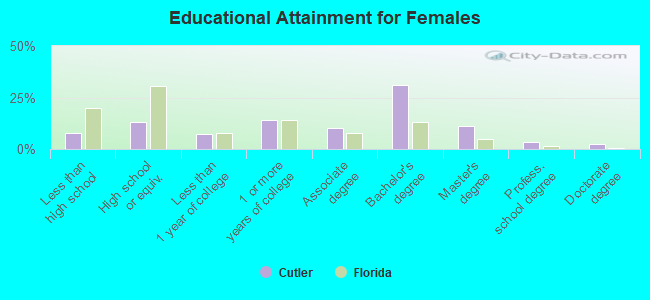
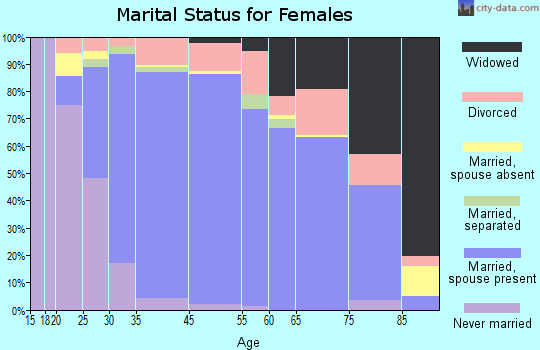
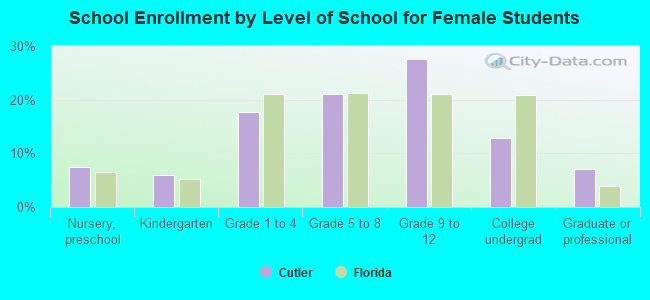
Education attainment for females 25 years and older:
No schooling: 40
Nursery to 4th grade: 21
5th and 6th grade: 25
7th and 8th grade: 53
9th grade: 47
10th grade: 84
11th grade: 79
12th grade, no diploma: 111
High school graduate (or equivalency): 785
Less than 1 year of college: 421
Some college more than 1 year, no degree: 835
Associate degree: 600
Bachelor's degree: 1,866
Master's degree: 675
Professional school degree: 198
Doctorate degree: 140
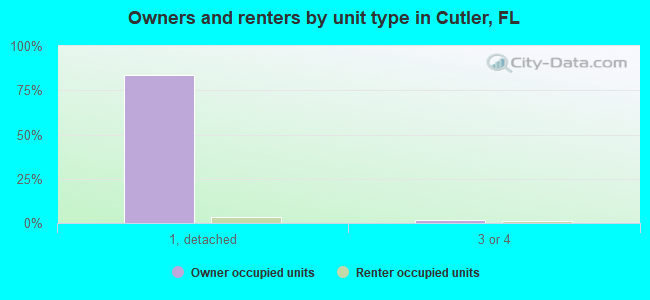
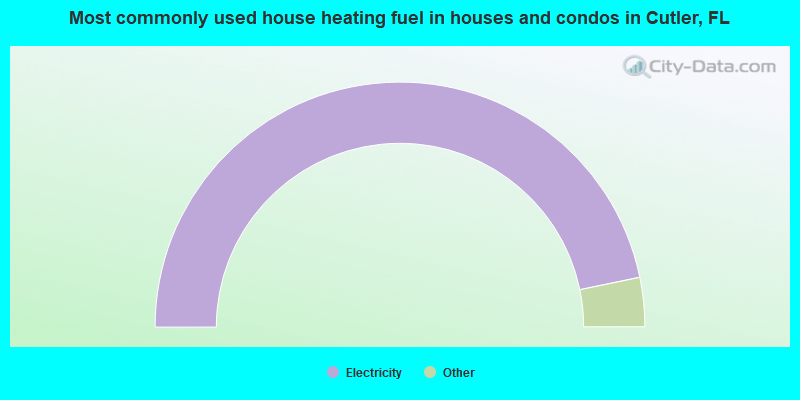
Housing units in structures:
One, detached: 5,089
One, attached: 181
Two: 34
3 or 4: 142
5 to 9: 68
10 to 19: 21
20 to 49: 90
50 or more: 226
Housing units lacking complete plumbing facilities: 0.3%
Housing units lacking complete kitchen facilities: 0.3%