Cuyahoga Falls, OH (Ohio) Houses and Residents
| Cuyahoga Falls: | $171,914 |
| Ohio: | $204,100 |
Mean price in 2022:
Detached houses: $215,973
Here: $215,973 State: $254,366 Townhouses or other attached units: $489,602
Here: $489,602 State: $225,733 In 2-unit structures: $107,228
Here: $107,228 State: $144,384 In 3-to-4-unit structures: $234,097
Here: $234,097 State: $203,002 In 5-or-more-unit structures: $183,750
Here: $183,750 State: $211,593 Mobile homes: $48,154
Here: $48,154 State: $62,719
Total population: 49,210 (Urban population: 46,947, Rural population: 2,411 (38 farm, 2,373 nonfarm))
Houses: 24,655 (23,197 occupied: 14,490 owner occupied, 8,843 renter occupied)
| % of renters here: | 38% |
| State: | 33% |
Housing density: 965 houses/condos per square mile
Median price asked for vacant for-sale houses and condos in 2022: $134,652.
Median contract rent in 2022: $824 (lower quartile is $686, upper quartile is $1,000)
Median rent asked for vacant for-rent units in 2022: $1,341
Median gross rent in Cuyahoga Falls, OH in 2022: $959
Housing units in Cuyahoga Falls with a mortgage: 9,966 (1,066 second mortgage, 176 home equity loan, 741 both second mortgage and home equity loan)
Houses without a mortgage: 406
Median household income for houses/condos with a mortgage: $88,715
Median household income for apartments without a mortgage: $59,664
Median monthly housing costs: $1,010
Compare current foreclosures in Cuyahoga Falls, OH:
| Photo | Address | Area | Beds / Baths | Price | Details |
|---|---|---|---|---|---|

|
#1
Bailey Rd
Cuyahoga Falls, OH 44221
|
960 sq. feet
|
1 baths 2 beds |
$164,900
|
show details |

|
#2
11th St
Cuyahoga Falls, OH 44221
|
1,424 sq. feet
|
2 baths 3 beds |
show details | |

|
#3
12th St
Cuyahoga Falls, OH 44223
|
826 sq. feet
|
1 baths 2 beds |
show details | |

|
#4
Hanover St
Cuyahoga Falls, OH 44221
|
1,120 sq. feet
|
1 baths 3 beds |
show details | |

|
#5
Tyler Ave
Cuyahoga Falls, OH 44221
|
1,056 sq. feet
|
1 baths 3 beds |
show details | |

|
#6
Harding Rd
Cuyahoga Falls, OH 44223
|
1,008 sq. feet
|
1 baths 2 beds |
show details | |

|
#7
Tyler Ave
Cuyahoga Falls, OH 44221
|
1,056 sq. feet
|
1 baths 3 beds |
show details | |

|
#8
Madison Ave
Cuyahoga Falls, OH 44221
|
1,332 sq. feet
|
1 baths 3 beds |
show details | |

|
#9
Sutton Dr
Cuyahoga Falls, OH 44221
|
1,262 sq. feet
|
1 baths 4 beds |
show details | |

|
#10
Ridgecrest Dr
Cuyahoga Falls, OH 44221
|
1,440 sq. feet
|
2 baths 3 beds |
show details |
| Photo | Address | Area | Beds / Baths | Price | Details |
|---|---|---|---|---|---|

|
#11
15th St
Cuyahoga Falls, OH 44223
|
1,768 sq. feet
|
2 baths 3 beds |
show details | |

|
#12
Issaquah St
Cuyahoga Falls, OH 44221
|
1,404 sq. feet
|
1 baths 3 beds |
show details | |

|
#13
Oakwood Dr
Cuyahoga Falls, OH 44221
|
1,464 sq. feet
|
2 baths 4 beds |
show details | |

|
#14
Meredith Ln
Cuyahoga Falls, OH 44223
|
1,096 sq. feet
|
1 baths 2 beds |
show details | |

|
#15
Falls Ave
Cuyahoga Falls, OH 44221
|
1,954 sq. feet
|
1 baths 2 beds |
show details | |

|
#16
Berk St
Cuyahoga Falls, OH 44221
|
1,274 sq. feet
|
1 baths 3 beds |
show details | |

|
#17
Sutton Dr
Cuyahoga Falls, OH 44221
|
1,190 sq. feet
|
1 baths 4 beds |
show details | |

|
#18
Byrd Ave
Cuyahoga Falls, OH 44223
|
1,394 sq. feet
|
1 baths 3 beds |
show details | |

|
#19
Northland St
Cuyahoga Falls, OH 44221
|
1,109 sq. feet
|
1 baths 3 beds |
show details | |

|
#20
Christy Dr
Cuyahoga Falls, OH 44223
|
1,018 sq. feet
|
1 baths 2 beds |
show details |
| Photo | Address | Area | Beds / Baths | Price | Details |
|---|---|---|---|---|---|

|
#21
Hanover St
Cuyahoga Falls, OH 44221
|
1,190 sq. feet
|
1 baths 3 beds |
show details | |

|
#22
Sutton Dr
Cuyahoga Falls, OH 44221
|
1,670 sq. feet
|
1 baths 3 beds |
show details | |

|
#23
Kathron Ave
Cuyahoga Falls, OH 44221
|
1,104 sq. feet
|
1 baths 3 beds |
show details | |

|
#24
May Ave
Cuyahoga Falls, OH 44221
|
1,144 sq. feet
|
1 baths 3 beds |
show details | |

|
#25
17th St
Cuyahoga Falls, OH 44223
|
768 sq. feet
|
1 baths 2 beds |
show details | |

|
#26
Anderson Rd
Cuyahoga Falls, OH 44221
|
1,255 sq. feet
|
1 baths 4 beds |
show details | |

|
#27
7th St
Cuyahoga Falls, OH 44221
|
1,008 sq. feet
|
1 baths 3 beds |
show details | |

|
#28
Atterbury St
Cuyahoga Falls, OH 44221
|
1,275 sq. feet
|
1 baths 4 beds |
show details | |

|
#29
Wichert Dr
Cuyahoga Falls, OH 44221
|
1,190 sq. feet
|
1 baths 4 beds |
show details | |

|
#30
Marcia Blvd
Cuyahoga Falls, OH 44223
|
2,147 sq. feet
|
2 baths 3 beds |
show details |
| Photo | Address | Area | Beds / Baths | Price | Details |
|---|---|---|---|---|---|

|
#31
Tallmadge Rd
Cuyahoga Falls, OH 44221
|
1,498 sq. feet
|
2 baths 3 beds |
show details | |

|
#32
Whitelaw St
Cuyahoga Falls, OH 44221
|
1,404 sq. feet
|
1 baths 3 beds |
show details | |

|
#33
Kathron Ave
Cuyahoga Falls, OH 44221
|
1,596 sq. feet
|
1 baths 3 beds |
show details | |

|
#34
Meadow Ln
Cuyahoga Falls, OH 44221
|
1,014 sq. feet
|
1 baths 3 beds |
show details | |

|
#35
High Hampton Trl
Cuyahoga Falls, OH 44223
|
2,898 sq. feet
|
2 baths 4 beds |
show details | |

|
#36
Graham Rd
Cuyahoga Falls, OH 44223
|
1,275 sq. feet
|
1 baths 3 beds |
show details | |

|
#37
Valley Rd
Cuyahoga Falls, OH 44223
|
1,252 sq. feet
|
2 baths 3 beds |
show details | |

|
#38
W Prescott Cir
Cuyahoga Falls, OH 44223
|
1,561 sq. feet
|
2 baths 3 beds |
show details | |

|
#39
23rd St
Cuyahoga Falls, OH 44223
|
1,626 sq. feet
|
1 baths 3 beds |
show details | |

|
#40
Prior Dr
Cuyahoga Falls, OH 44223
|
1,837 sq. feet
|
1 baths 2 beds |
show details |
| Photo | Address | Area | Beds / Baths | Price | Details |
|---|---|---|---|---|---|

|
#41
Munroe Falls Ave
Cuyahoga Falls, OH 44221
|
960 sq. feet
|
1 baths 2 beds |
show details | |

|
#42
7th St
Cuyahoga Falls, OH 44221
|
1,892 sq. feet
|
2 baths 3 beds |
show details | |

|
#43
Oakwood Dr
Cuyahoga Falls, OH 44221
|
1,128 sq. feet
|
1 baths 2 beds |
show details | |

|
#44
16th St
Cuyahoga Falls, OH 44223
|
1,488 sq. feet
|
1 baths 3 beds |
show details | |

|
#45
Bailey Rd
Cuyahoga Falls, OH 44221
|
1,120 sq. feet
|
1 baths 4 beds |
show details | |

|
#46
Bailey Rd
Cuyahoga Falls, OH 44221
|
1,120 sq. feet
|
1 baths 2 beds |
show details | |

|
#47
E Prescott Cir
Cuyahoga Falls, OH 44223
|
1,449 sq. feet
|
2 baths 2 beds |
show details | |

|
#48
Richmond Rd
Cuyahoga Falls, OH 44221
|
1,600 sq. feet
|
1 baths 4 beds |
show details | |

|
#49
Bancroft St
Cuyahoga Falls, OH 44221
|
1,600 sq. feet
|
1 baths 3 beds |
show details | |

|
Check over 1 million property listings on Foreclosure.com!
|
browse all offers | |||


 | Nice townhomes or apartments around Stow, Ohio? (13 replies) |
| How/where to find [good clean/quality] rental homes? (3 replies) |
| Considering moving to Cuyahoga Falls and not sure where to look (7 replies) |
| possible move to Akron Ohio (5 replies) |
| Cuyahoga Falls ~ Apartments (3 replies) |
| Most New England-like communities b/t Akron and Cleveland (9 replies) |

Median year apartment built: 1972
Household type by relationship:
Households: 50,587- Male householders: 11,236 (3,717 living alone), Female householders: 11,762 (4,444 living alone)
9,820 spouses (9,708 opposite-sex spouses), 2,171 unmarried partners, (2,097 opposite-sex unmarried partners), 12,108 children (11,370 natural, 153 adopted, 585 stepchildren), 358 grandchildren, 462 brothers or sisters, 541 parents, 15 foster children, 320 other relatives, 1,250 non-relatives
- In group quarters: 538
Size of family households: 6,433 2-persons, 3,165 3-persons, 2,182 4-persons, 891 5-persons, 284 6-persons, 72 7-or-more-persons.
Size of nonfamily households: 8,264 1-person, 1,779 2-persons, 143 3-persons, 28 4-persons, 92 5-persons.
6,190 married couples with children.
2,304 single-parent households (646 men, 1,658 women).
89.4% of residents of Cuyahoga Falls speak English at home.
1.4% of residents speak Spanish at home (78% speak English very well, 8% speak English well, 13% speak English not well).
6.3% of residents speak other Indo-European language at home (39% speak English very well, 36% speak English well, 14% speak English not well, 11% don't speak English at all).
1.6% of residents speak Asian or Pacific Island language at home (51% speak English very well, 24% speak English well, 25% speak English not well, 1% don't speak English at all).
1.3% of residents speak other language at home (69% speak English very well, 22% speak English well, 4% speak English not well, 6% don't speak English at all).
Foreign born population: 3,978 (7.9%)
(61.7% of them are naturalized citizens)
| Here: | 6.6 |
| State: | 6.7 |
| Here: | 4.2 |
| State: | 4.4 |

- Bedrooms in owner-occupied houses and condos in Cuyahoga Falls, Ohio
- 6no bedroom
- 1951 bedroom
- 2,3332 bedrooms
- 7,9553 bedrooms
- 3,6894 bedrooms
- 3125+ bedrooms

- Bedrooms in renter-occupied apartments in Cuyahoga Falls, Ohio
- 411no bedroom
- 2,3251 bedroom
- 4,3712 bedrooms
- 1,2013 bedrooms
- 4384 bedrooms
- 985+ bedrooms

- Cars and other vehicles available in Cuyahoga Falls in owner-occupied houses/condos
- 316no vehicle
- 4,5581 vehicle
- 6,6752 vehicles
- 2,2773 vehicles
- 5014 vehicles
- 1635+ vehicles

- Cars and other vehicles available in Cuyahoga Falls in renter-occupied apartments
- 892no vehicle
- 4,6711 vehicle
- 2,6332 vehicles
- 5813 vehicles
- 464 vehicles
- 205+ vehicles

- Rooms in owner-occupied houses in Cuyahoga Falls, Ohio
- 01 room
- 232 rooms
- 2023 rooms
- 7094 rooms
- 2,2275 rooms
- 3,7976 rooms
- 3,3097 rooms
- 1,8338 rooms
- 2,3919+ rooms

- Rooms in renter-occupied apartments in Cuyahoga Falls, Ohio
- 3491 room
- 4142 rooms
- 2,2453 rooms
- 2,4694 rooms
- 1,5365 rooms
- 8496 rooms
- 5187 rooms
- 3138 rooms
- 1509+ rooms


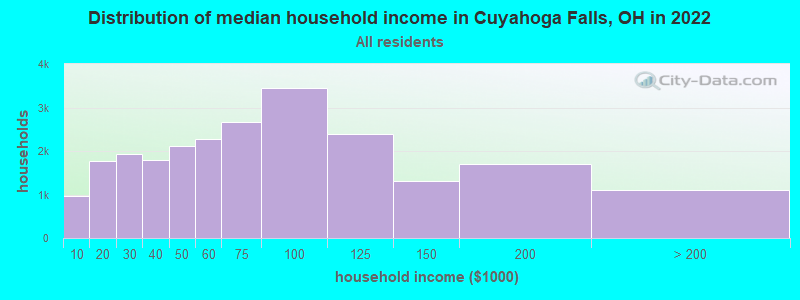
Cuyahoga Falls, OH household income distribution

- 961Less than $10,000
- 1,774$10,000 to $19,999
- 1,939$20,000 to $29,999
- 1,782$30,000 to $39,999
- 2,115$40,000 to $49,999
- 2,282$50,000 to $59,999
- 2,672$60,000 to $74,999
- 3,443$75,000 to $99,999
- 2,381$100,000 to $124,999
- 1,300$125,000 to $149,999
- 1,694$150,000 to $199,999
- 1,098$200,000 or more
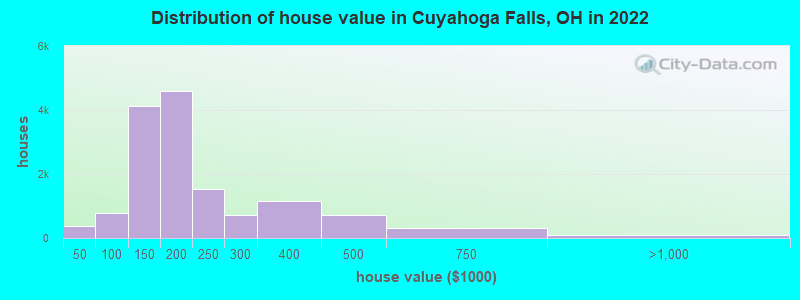
Home value of owner - occupied houses in 2022 in Cuyahoga Falls, OH
-
- 84Less than $10,000
- 78$10,000 to $14,999
- 90$15,000 to $19,999
- 72$20,000 to $24,999
- 10$25,000 to $29,999
- 8$30,000 to $34,999
- 5$35,000 to $39,999
- 29$40,000 to $49,999
- 97$50,000 to $59,999
- 93$60,000 to $69,999
- 199$70,000 to $79,999
- 124$80,000 to $89,999
- 236$90,000 to $99,999
- 2,060$100,000 to $124,999
- 2,068$125,000 to $149,999
- 3,273$150,000 to $174,999
- 1,332$175,000 to $199,999
- 1,543$200,000 to $249,999
- 706$250,000 to $299,999
- 1,142$300,000 to $399,999
- 729$400,000 to $499,999
- 310$500,000 to $749,999
- 37$750,000 to $999,999
- 39$1,000,000 to $1,499,999
- 31$2,000,000 or more
Rent paid by renters in 2022 in Cuyahoga Falls, OH
-
- 41Less than $100
- 146$100 to $149
- 41$150 to $199
- 190$200 to $249
- 224$250 to $299
- 23$300 to $349
- 91$350 to $399
- 46$400 to $449
- 130$450 to $499
- 144$500 to $549
- 227$550 to $599
- 586$600 to $649
- 436$650 to $699
- 790$700 to $749
- 928$750 to $799
- 875$800 to $899
- 1,550$900 to $999
- 1,343$1,000 to $1,249
- 513$1,250 to $1,499
- 122$1,500 to $1,999
- 99$2,000 to $2,499
- 18$2,500 to $2,999
- 146No cash rent

Percentage of workers working in this county: 76.9%
Number of people working at home: 3,884 (14.1% of all workers)
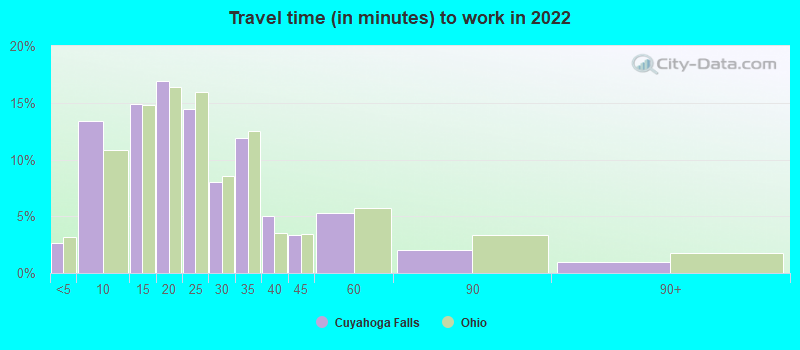
Travel time to work (commute)
- Less than 5 minutes: 630
- 5 to 9 minutes: 2,617
- 10 to 14 minutes: 3,124
- 15 to 19 minutes: 4,288
- 20 to 24 minutes: 3,522
- 25 to 29 minutes: 2,510
- 30 to 34 minutes: 2,876
- 35 to 39 minutes: 1,124
- 40 to 44 minutes: 903
- 45 to 59 minutes: 1,474
- 60 to 89 minutes: 329
- 90 or more minutes: 237
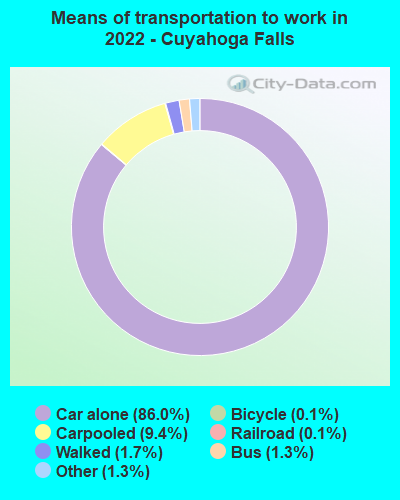
Means of transportation to work:
- Drove a car alone: 15,923 (71.3%)
- Carpooled: 1,949 (8.7%)
- Bus: 171 (0.8%)
- Light rail, streetcar or trolley: 29 (0.1%)
- Taxi: 328 (1.5%)
- Bicycle: 29 (0.1%)
- Walked: 281 (1.3%)
- Worked at home: 3,884 (17.4%)
- Unemployment by race in 2022
- Unemployment rate for White non-Hispanic residents
- 2.3%Males
- 3.3%Females
- Unemployment rate for Black residents
- 12.6%Males
- 0.4%Females
- Unemployment rate for American Indian and Alaska Native residents
- 73.9%Females
- Unemployment rate for Asian residents
- 1.6%Males
- Unemployment rate for two or more race residents
- 8.2%Males
- 1.8%Females
- Unemployment rate for Hispanic or Latino residents
- 6.8%Males
- 1.5%Females

- Year of entry for the foreign-born population in Cuyahoga Falls, Ohio
- 2,1132010 or later
- 1,2372000 to 2009
- 3911990 to 1999
- 1181980 to 1989
- 1391970 to 1979
- 692Before 1970

First ancestries reported:
- German: 4,004 (17.8%)
- Italian: 2,164 (9.6%)
- American: 1,967 (8.8%)
- English: 1,944 (8.7%)
- Irish: 1,377 (6.1%)
- European: 609 (2.7%)
- Hungarian: 453 (2.0%)
- Polish: 449 (2.0%)
- Russian: 327 (1.5%)
- Scottish: 280 (1.2%)
- Scotch-Irish: 252 (1.1%)
- Romanian: 223 (1.0%)
- Arab: 200 (0.9%)
- Ghanaian: 152 (0.7%)
- Croatian: 138 (0.6%)
- Ukrainian: 126 (0.6%)
- Greek: 123 (0.5%)
- African: 115 (0.5%)
- Czech: 113 (0.5%)
- Macedonian: 107 (0.5%)
- Slovak: 104 (0.5%)
- French Canadian: 87 (0.4%)
- Slavic: 80 (0.4%)
- Serbian: 72 (0.3%)
- Dutch: 70 (0.3%)
- French: 67 (0.3%)
- British: 61 (0.3%)
- Pennsylvania German: 47 (0.2%)
- Norwegian: 46 (0.2%)
- Eastern European: 44 (0.2%)
- Slovene: 42 (0.2%)
- Nigerian: 38 (0.2%)
- Lebanese: 36 (0.2%)
- Swedish: 35 (0.2%)
- Northern European: 30 (0.1%)
- Scandinavian: 30 (0.1%)
- Swiss: 30 (0.1%)
- Austrian: 29 (0.1%)
- Yugoslavian: 27 (0.1%)
- Syrian: 25 (0.1%)
- Jamaican: 25 (0.1%)
- Welsh: 23 (0.1%)
- Belgian: 22 (0.10%)
- Czechoslovakian: 15 (0.07%)
- Carpatho Rusyn: 13 (0.06%)
- Finnish: 12 (0.05%)
- Lithuanian: 11 (0.05%)
- Ethiopian: 8 (0.04%)
- South African: 5 (0.02%)
Most common places of birth for foreign-born residents (%):
| Cuyahoga Falls: | 23.4% (936) |
| Ohio: | 2.4% (13,773) |
| Cuyahoga Falls: | 12.2% (487) |
| Ohio: | 1.9% (10,777) |
| Cuyahoga Falls: | 7.8% (313) |
| Ohio: | 6.2% (35,703) |
| Cuyahoga Falls: | 6.4% (254) |
| Ohio: | 1.4% (7,947) |
| Cuyahoga Falls: | 6.2% (247) |
| Ohio: | 0.6% (3,669) |
| Cuyahoga Falls: | 5.4% (214) |
| Ohio: | 1.1% (6,346) |
| Cuyahoga Falls: | 4.7% (186) |
| Ohio: | 0.7% (3,864) |
| Cuyahoga Falls: | 3.3% (132) |
| Ohio: | 1.8% (10,561) |
| Cuyahoga Falls: | 3.1% (123) |
| Ohio: | 11.6% (66,525) |
| Cuyahoga Falls: | 1.8% (73) |
| Ohio: | 1.2% (7,029) |
| Cuyahoga Falls: | 1.6% (64) |
| Ohio: | 2.2% (12,846) |
Place of birth for U.S.-born residents:
- This state: 37,697
- Other state: 8,597
- Northeast: 3,049
- Midwest: 1,614
- South: 2,825
- West: 1,090
85.1% of Cuyahoga Falls residents lived in the same house 1 years ago.
Out of people who lived in different houses, 35.0% lived in this county.
Out of people who lived in different counties, 76.1% lived in Ohio.
| Cuyahoga Falls: | 85.1% |
| State average: | 87.8% |
Education attainment for males 25 years and older:
- No schooling: 394
- Nursery to 4th grade: 13
- 5th and 6th grade: 41
- 7th and 8th grade: 53
- 9th grade: 150
- 10th grade: 83
- 11th grade: 59
- 12th grade, no diploma: 308
- High school graduate (or equivalency): 5,067
- Less than 1 year of college: 1,422
- Some college more than 1 year, no degree: 2,241
- Associate degree: 1,483
- Bachelor's degree: 4,461
- Master's degree: 1,733
- Professional school degree: 393
- Doctorate degree: 131

Education attainment for females 25 years and older:
- No schooling: 420
- Nursery to 4th grade: 9
- 5th and 6th grade: 28
- 7th and 8th grade: 115
- 9th grade: 87
- 10th grade: 59
- 11th grade: 202
- 12th grade, no diploma: 168
- High school graduate (or equivalency): 5,214
- Less than 1 year of college: 1,332
- Some college more than 1 year, no degree: 1,944
- Associate degree: 2,144
- Bachelor's degree: 4,830
- Master's degree: 1,978
- Professional school degree: 221
- Doctorate degree: 391


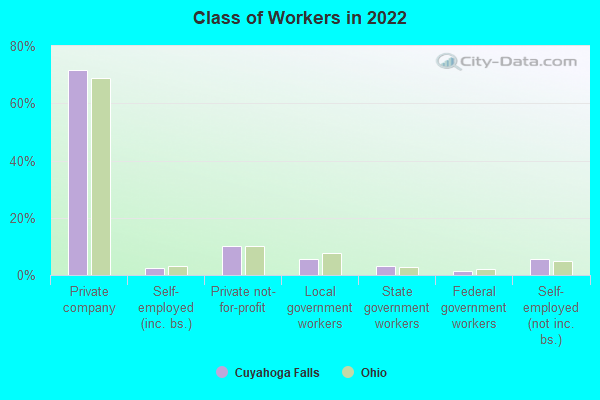
Housing units in structures:
- One, detached: 15,774
- One, attached: 1,420
- Two: 1,252
- 3 or 4: 1,015
- 5 to 9: 1,037
- 10 to 19: 1,090
- 20 to 49: 1,000
- 50 or more: 1,878
- Mobile homes: 160
- Boats, RVs, vans, etc.: 26
Median worth of mobile homes: $52,600
Housing units lacking complete kitchen facilities in 2022: 1.1%
House/condo owner moved in on average 13 years ago
Renter moved in on average 3 years ago

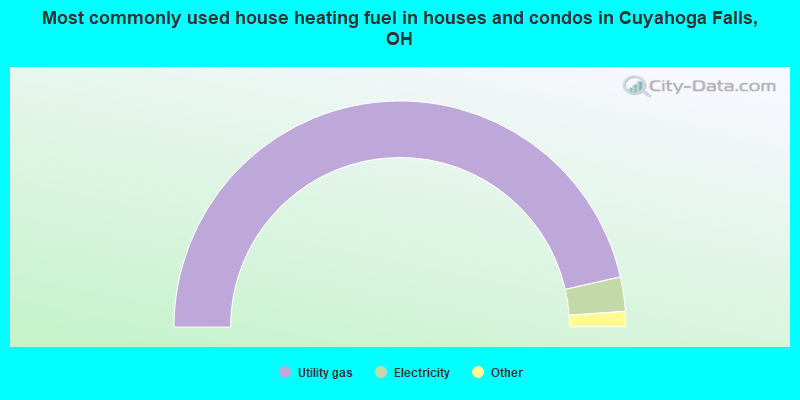
- 92.9%Utility gas
- 4.9%Electricity
- 1.3%Bottled, tank, or LP gas
- 0.4%Fuel oil, kerosene, etc.
- 0.3%Other fuel
- 0.1%Wood
- 0.1%No fuel used
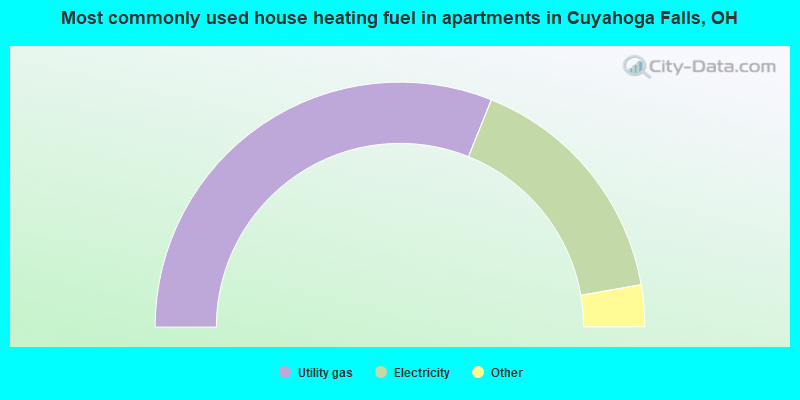
- 62.2%Utility gas
- 32.3%Electricity
- 3.9%Bottled, tank, or LP gas
- 0.9%No fuel used
- 0.4%Wood
- 0.1%Other fuel
- 0.1%Fuel oil, kerosene, etc.
Private vs. public school enrollment:
| Here: | 21.3% |
| Ohio: | 16.0% |
| Here: | 15.7% |
| Ohio: | 13.1% |
| Here: | 10.3% |
| Ohio: | 22.3% |


