Cypress, CA (California) Houses and Residents
| Cypress: | $900,446 |
| California: | $715,900 |
Mean price in 2022:
Detached houses: $1,097,816
Here: $1,097,816 State: $988,808 Townhouses or other attached units: $746,714
Here: $746,714 State: $838,546 In 3-to-4-unit structures: $773,673
Here: $773,673 State: $824,253 In 5-or-more-unit structures: $566,149
Here: $566,149 State: $730,996 Mobile homes: $136,501
Here: $136,501 State: $184,506
Total population: 49,240 (Urban population: 46,534, Rural population: 0)
Houses: 16,818 (16,247 occupied: 10,951 owner occupied, 5,358 renter occupied)
| % of renters here: | 33% |
| State: | 44% |
Housing density: 2,543 houses/condos per square mile
Median price asked for vacant for-sale houses and condos in 2022: $713,754.
Median contract rent in 2022: over $2,000 (lower quartile is $1,753, upper quartile is over $2,000)
Median rent asked for vacant for-rent units in 2022: $2,296
Median gross rent in Cypress, CA in 2022: over $2,000
Housing units in Cypress with a mortgage: 7,135 (807 second mortgage, 30 home equity loan, 644 both second mortgage and home equity loan)
Houses without a mortgage: 200
Median household income for houses/condos with a mortgage: $156,192
Median household income for apartments without a mortgage: $101,935
Median monthly housing costs: $2,300
Compare current foreclosures near Cypress, CA:
| Photo | Address | Area | Beds / Baths | Price | Details |
|---|---|---|---|---|---|

|
#1
Karen Ave
Cypress, CA 90630
|
1,108 sq. feet
|
1 baths 3 beds |
show details | |

|
#2
Orangewood Ave
Cypress, CA 90630
|
1,392 sq. feet
|
2 baths 2 beds |
show details | |

|
#3
Saint George Cir
Cypress, CA 90630
|
1,202 sq. feet
|
2 baths 4 beds |
show details | |

|
#4
Dina Ct
Cypress, CA 90630
|
1,404 sq. feet
|
2 baths 3 beds |
show details | |

|
#5
Bloomfield Ave
Cypress, CA 90630
|
1,426 sq. feet
|
2 baths 3 beds |
show details | |

|
#6
Garnet Ave
Cypress, CA 90630
|
1,820 sq. feet
|
2 baths 5 beds |
show details | |

|
#7
Jeffrey Mark St
Cypress, CA 90630
|
1,964 sq. feet
|
2 baths 4 beds |
show details | |

|
#8
Villa Way
Cypress, CA 90630
|
1,336 sq. feet
|
3 baths 3 beds |
show details | |

|
#9
Charles Cir
Cypress, CA 90630
|
1,040 sq. feet
|
1 baths 3 beds |
show details | |

|
#10
Saint George Cir
Cypress, CA 90630
|
1,202 sq. feet
|
2 baths 4 beds |
show details |
| Photo | Address | Area | Beds / Baths | Price | Details |
|---|---|---|---|---|---|

|
#11
Graham St Apt 8
Cypress, CA 90630
|
- sq. feet
|
- baths - beds |
show details | |

|
#12
Lime Ave
Cypress, CA 90630
|
- sq. feet
|
- baths - beds |
show details | |

|
#13
Juanita St Apt 149
Cypress, CA 90630
|
- sq. feet
|
- baths - beds |
show details | |

|
#14
Lincoln Ave # 304
Cypress, CA 90630
|
- sq. feet
|
- baths - beds |
show details | |

|
#15
Casa Grande Cir Apt 119
Cypress, CA 90630
|
- sq. feet
|
- baths - beds |
show details | |

|
#16
Berwick Ct
Cypress, CA 90630
|
- sq. feet
|
- baths - beds |
show details | |

|
#17
Casa Grande Cir Apt 354
Cypress, CA 90630
|
- sq. feet
|
- baths - beds |
show details | |

|
#18
Barbados Ave
Cypress, CA 90630
|
- sq. feet
|
- baths - beds |
show details | |

|
#19
Larwin Ave
Cypress, CA 90630
|
- sq. feet
|
- baths - beds |
show details | |

|
#20
Juanita St Apt 158
Cypress, CA 90630
|
- sq. feet
|
- baths - beds |
show details |
| Photo | Address | Area | Beds / Baths | Price | Details |
|---|---|---|---|---|---|

|
#21
Lime Ave Apt A
Cypress, CA 90630
|
- sq. feet
|
- baths - beds |
show details | |

|
#22
Walker St Apt 1
Cypress, CA 90630
|
- sq. feet
|
- baths - beds |
show details | |

|
#23
Leucadia
Irvine, CA 92602
|
- sq. feet
|
2 baths 3 beds |
$950,000
|
show details |

|
#24
Norwalk Blvd Apt
Hawaiian Gardens, CA 90716
|
800 sq. feet
|
2 baths 1 beds |
show details | |

|
#25
E 60th St
Los Angeles, CA 90001
|
1,883 sq. feet
|
3 baths 5 beds |
show details | |

|
#26
Elburg St Unit A
Paramount, CA 90723
|
1,131 sq. feet
|
2 baths 3 beds |
show details | |

|
#27
E Jackson Ave Unit C
Anaheim, CA 92806
|
1,266 sq. feet
|
2 baths 3 beds |
show details | |

|
#28
N Magnolia Ave Apt D
Anaheim, CA 92801
|
1,292 sq. feet
|
2 baths 3 beds |
show details | |

|
#29
W Arbor St # 57
Long Beach, CA 90805
|
1,585 sq. feet
|
2 baths 3 beds |
show details | |

|
#30
And 6111 Northside Drive
Los Angeles, CA 90022
|
1,329 sq. feet
|
4 baths 3 beds |
show details |
| Photo | Address | Area | Beds / Baths | Price | Details |
|---|---|---|---|---|---|

|
#31
Starburst Ct # 8
Newport Beach, CA 92663
|
1,157 sq. feet
|
2 baths 2 beds |
show details | |

|
#32
Redondo Avenue, Units 5-8
Long Beach, CA 90804
|
3,360 sq. feet
|
4 baths 8 beds |
show details | |

|
#33
Arlee Ave
Norwalk, CA 90650
|
872 sq. feet
|
1 baths 2 beds |
show details | |

|
#34
Cliff Dr
Newport Beach, CA 92663
|
5,630 sq. feet
|
7 baths 6 beds |
show details | |

|
#35
E Victoria Ave
Montebello, CA 90640
|
1,025 sq. feet
|
1 baths 2 beds |
show details | |

|
#36
N Malena Dr
Orange, CA 92869
|
1,941 sq. feet
|
2 baths 3 beds |
show details | |

|
#37
Santa Fe Ave
Lynwood, CA 90262
|
1,124 sq. feet
|
2 baths 3 beds |
show details | |

|
#38
Topaz Ave
La Habra, CA 90631
|
2,481 sq. feet
|
3 baths 5 beds |
show details | |

|
#39
Gettysburg Dr
Norwalk, CA 90650
|
1,136 sq. feet
|
1 baths 3 beds |
show details | |

|
#40
Windspun Dr
Huntington Beach, CA 92649
|
1,872 sq. feet
|
3 baths 3 beds |
show details |
| Photo | Address | Area | Beds / Baths | Price | Details |
|---|---|---|---|---|---|

|
#41
Faust Ave
Long Beach, CA 90808
|
1,434 sq. feet
|
2 baths 3 beds |
show details | |

|
#42
Maine St
West Covina, CA 91792
|
710 sq. feet
|
1 baths 1 beds |
show details | |

|
#43
Walnut Ave
Long Beach, CA 90807
|
1,912 sq. feet
|
3 baths 2 beds |
show details | |

|
#44
N Riddle Ave
Los Angeles, CA 90059
|
1,238 sq. feet
|
2 baths 2 beds |
show details | |

|
#45
Ibex Ave
Cerritos, CA 90703
|
2,424 sq. feet
|
3 baths 4 beds |
show details | |

|
#46
Johnson Ave
Long Beach, CA 90805
|
1,252 sq. feet
|
2 baths 3 beds |
show details | |

|
#47
Simon St
Fullerton, CA 92833
|
3,202 sq. feet
|
2 baths 5 beds |
show details | |

|
#48
Mossford Dr
Huntington Beach, CA 92646
|
1,540 sq. feet
|
2 baths 4 beds |
show details | |

|
#49
Fernbank Ave
Monterey Park, CA 91754
|
1,310 sq. feet
|
2 baths 3 beds |
show details | |

|
Check over 1 million property listings on Foreclosure.com!
|
browse all offers | |||

Latest news about housing in Cypress, CA collected exclusively by city-data.com from local newspapers, TV, and radio stations

 | Renting our home in Cypress - latest advice on renting? (13 replies) |
| looking for indian community apartments in cypress/la palma (4 replies) |
| The Los Angeles Homeless Containment Thread (9136 replies) |
| Moving to OC in a couple months.. should I buy a home? (10 replies) |
| Anyone moved to Texas and moved back to LA? (220 replies) |
| Coronado vs Carlsbad vs Del Mar (25 replies) |

Median year apartment built: 1974
Household type by relationship:
Households: 49,576- Male householders: 8,891 (1,179 living alone), Female householders: 7,012 (1,216 living alone)
9,574 spouses (9,540 opposite-sex spouses), 564 unmarried partners, (555 opposite-sex unmarried partners), 16,835 children (16,027 natural, 395 adopted, 411 stepchildren), 972 grandchildren, 854 brothers or sisters, 1,703 parents, 140 foster children, 1,318 other relatives, 1,480 non-relatives
- In group quarters: 227
Size of family households: 3,938 2-persons, 3,416 3-persons, 3,278 4-persons, 1,368 5-persons, 491 6-persons, 322 7-or-more-persons.
Size of nonfamily households: 2,496 1-person, 696 2-persons, 148 3-persons, 62 4-persons, 9 5-persons, 12 6-persons.
7,979 married couples with children.
1,722 single-parent households (232 men, 1,490 women).
56.0% of residents of Cypress speak English at home.
11.4% of residents speak Spanish at home (72% speak English very well, 17% speak English well, 9% speak English not well, 2% don't speak English at all).
5.0% of residents speak other Indo-European language at home (81% speak English very well, 14% speak English well, 5% speak English not well).
26.0% of residents speak Asian or Pacific Island language at home (56% speak English very well, 24% speak English well, 17% speak English not well, 3% don't speak English at all).
1.3% of residents speak other language at home (89% speak English very well, 6% speak English well, 5% speak English not well).
Foreign born population: 15,198 (30.7%)
(65.8% of them are naturalized citizens)
| Here: | 6.3 |
| State: | 6.0 |
| Here: | 4.2 |
| State: | 3.9 |

- Bedrooms in owner-occupied houses and condos in Cypress, California
- 19no bedroom
- 661 bedroom
- 1,0742 bedrooms
- 4,2163 bedrooms
- 4,5374 bedrooms
- 1,0395+ bedrooms

- Bedrooms in renter-occupied apartments in Cypress, California
- 219no bedroom
- 9661 bedroom
- 2,1922 bedrooms
- 1,3003 bedrooms
- 6204 bedrooms
- 625+ bedrooms

- Cars and other vehicles available in Cypress in owner-occupied houses/condos
- 232no vehicle
- 1,4931 vehicle
- 4,8762 vehicles
- 2,8273 vehicles
- 1,0914 vehicles
- 4325+ vehicles

- Cars and other vehicles available in Cypress in renter-occupied apartments
- 448no vehicle
- 1,6981 vehicle
- 2,1132 vehicles
- 6083 vehicles
- 3414 vehicles
- 1525+ vehicles

- Rooms in owner-occupied houses in Cypress, California
- 191 room
- 262 rooms
- 3183 rooms
- 1,0504 rooms
- 1,7285 rooms
- 3,0716 rooms
- 1,7987 rooms
- 1,6868 rooms
- 1,2549+ rooms

- Rooms in renter-occupied apartments in Cypress, California
- 2191 room
- 2002 rooms
- 9703 rooms
- 1,9404 rooms
- 8475 rooms
- 5596 rooms
- 1677 rooms
- 2908 rooms
- 1679+ rooms


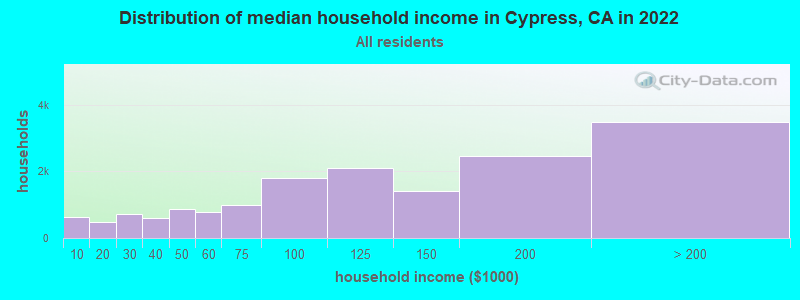
Cypress, CA household income distribution

- 630Less than $10,000
- 470$10,000 to $19,999
- 720$20,000 to $29,999
- 597$30,000 to $39,999
- 863$40,000 to $49,999
- 767$50,000 to $59,999
- 977$60,000 to $74,999
- 1,789$75,000 to $99,999
- 2,098$100,000 to $124,999
- 1,407$125,000 to $149,999
- 2,445$150,000 to $199,999
- 3,479$200,000 or more
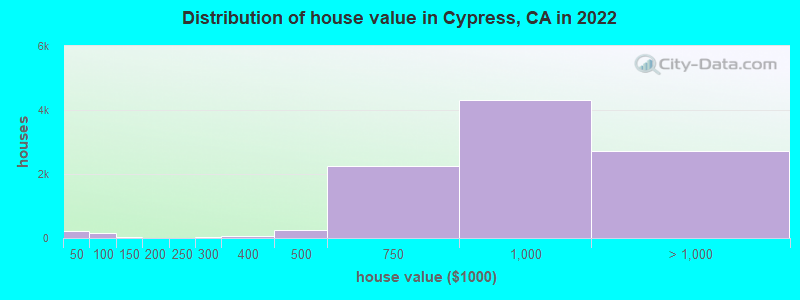
Home value of owner - occupied houses in 2022 in Cypress, CA
-
- 136Less than $10,000
- 16$10,000 to $14,999
- 21$20,000 to $24,999
- 12$25,000 to $29,999
- 4$35,000 to $39,999
- 18$40,000 to $49,999
- 47$50,000 to $59,999
- 5$60,000 to $69,999
- 54$70,000 to $79,999
- 5$80,000 to $89,999
- 9$90,000 to $99,999
- 25$100,000 to $124,999
- 15$200,000 to $249,999
- 27$250,000 to $299,999
- 71$300,000 to $399,999
- 261$400,000 to $499,999
- 2,246$500,000 to $749,999
- 4,298$750,000 to $999,999
- 2,369$1,000,000 to $1,499,999
- 137$1,500,000 to $1,999,999
- 207$2,000,000 or more
Rent paid by renters in 2022 in Cypress, CA
-
- 15Less than $100
- 6$250 to $299
- 55$300 to $349
- 12$400 to $449
- 7$450 to $499
- 28$500 to $549
- 15$750 to $799
- 27$800 to $899
- 93$900 to $999
- 73$1,000 to $1,249
- 167$1,250 to $1,499
- 1,616$1,500 to $1,999
- 1,662$2,000 to $2,499
- 780$2,500 to $2,999
- 411$3,000 to $3,499
- 202$3,500 or more
- 230No cash rent


Percentage of workers working in this county: 68.4%
Number of people working at home: 4,663 (19.6% of all workers)
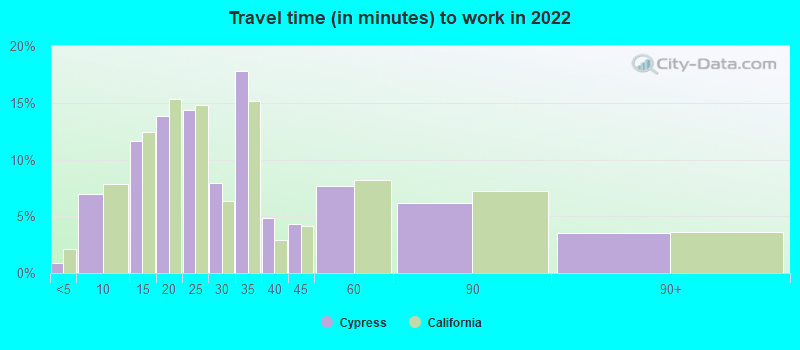
Travel time to work (commute)
- Less than 5 minutes: 177
- 5 to 9 minutes: 1,234
- 10 to 14 minutes: 1,981
- 15 to 19 minutes: 2,399
- 20 to 24 minutes: 2,718
- 25 to 29 minutes: 1,409
- 30 to 34 minutes: 3,223
- 35 to 39 minutes: 782
- 40 to 44 minutes: 970
- 45 to 59 minutes: 1,987
- 60 to 89 minutes: 1,566
- 90 or more minutes: 644
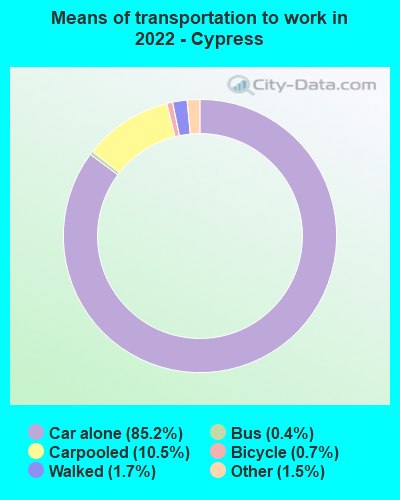
Means of transportation to work:
- Drove a car alone: 19,031 (69.9%)
- Carpooled: 2,540 (9.3%)
- Bus: 89 (0.3%)
- Taxi: 388 (1.4%)
- Bicycle: 157 (0.6%)
- Walked: 379 (1.4%)
- Worked at home: 4,663 (17.1%)

- Unemployment by race in 2022
- Unemployment rate for White non-Hispanic residents
- 3.5%Males
- 4.4%Females
- Unemployment rate for Black residents
- 5.4%Males
- 8.8%Females
- Unemployment rate for Asian residents
- 6.1%Males
- 1.5%Females
- Unemployment rate for other race residents
- 0.9%Males
- 5.1%Females
- Unemployment rate for two or more race residents
- 4.8%Males
- 4.4%Females
- Unemployment rate for Hispanic or Latino residents
- 3.0%Males
- 3.3%Females

- Year of entry for the foreign-born population in Cypress, California
- 2,9732010 or later
- 3,7592000 to 2009
- 3,0171990 to 1999
- 2,8801980 to 1989
- 2,4691970 to 1979
- 1,803Before 1970

First ancestries reported:
- American: 1,607 (5.7%)
- English: 1,039 (3.7%)
- European: 837 (3.0%)
- German: 656 (2.3%)
- Irish: 467 (1.6%)
- Italian: 274 (1.0%)
- Egyptian: 233 (0.8%)
- Dutch: 208 (0.7%)
- Greek: 198 (0.7%)
- Scottish: 178 (0.6%)
- Lebanese: 172 (0.6%)
- Iranian: 146 (0.5%)
- Scotch-Irish: 120 (0.4%)
- Palestinian: 119 (0.4%)
- Nigerian: 112 (0.4%)
- Polish: 110 (0.4%)
- Swedish: 93 (0.3%)
- French: 80 (0.3%)
- Russian: 80 (0.3%)
- Jamaican: 71 (0.3%)
- African: 61 (0.2%)
- Norwegian: 56 (0.2%)
- Belizean: 54 (0.2%)
- Australian: 52 (0.2%)
- Ukrainian: 51 (0.2%)
- Northern European: 45 (0.2%)
- British: 43 (0.2%)
- Portuguese: 42 (0.1%)
- Kenyan: 41 (0.1%)
- Ethiopian: 37 (0.1%)
- Hungarian: 30 (0.1%)
- Canadian: 24 (0.08%)
- Welsh: 22 (0.08%)
- Syrian: 19 (0.07%)
- Eastern European: 18 (0.06%)
- Armenian: 17 (0.06%)
- Afghan: 16 (0.06%)
- French Canadian: 13 (0.05%)
- Danish: 11 (0.04%)
- Moroccan: 8 (0.03%)
- Austrian: 8 (0.03%)
- Brazilian: 5 (0.02%)
- Pennsylvania German: 4 (0.01%)
- Scandinavian: 4 (0.01%)
- Belgian: 3 (0.01%)
- Czechoslovakian: 2 (0.01%)
Most common places of birth for foreign-born residents (%):
| Cypress: | 27.1% (4,124) |
| California: | 3.0% (315,248) |
| Cypress: | 12.1% (1,833) |
| California: | 5.2% (539,184) |
| Cypress: | 10.5% (1,589) |
| California: | 7.8% (818,297) |
| Cypress: | 10.1% (1,532) |
| California: | 37.2% (3,881,193) |
| Cypress: | 8.3% (1,265) |
| California: | 4.9% (512,335) |
| Cypress: | 5.1% (782) |
| California: | 6.6% (684,672) |
| Cypress: | 3.4% (520) |
| California: | 1.7% (176,274) |
| Cypress: | 1.9% (292) |
| California: | 0.5% (51,974) |
| Cypress: | 1.7% (251) |
| California: | 1.0% (103,575) |
Place of birth for U.S.-born residents:
- This state: 27,862
- Other state: 5,809
- Northeast: 1,174
- Midwest: 1,942
- South: 1,363
- West: 1,326
93.7% of Cypress residents lived in the same house 1 years ago.
Out of people who lived in different houses, 31.0% lived in this county.
Out of people who lived in different counties, 78.7% lived in California.
| Cypress: | 93.7% |
| State average: | 88.9% |
Education attainment for males 25 years and older:
- No schooling: 589
- Nursery to 4th grade: 33
- 5th and 6th grade: 137
- 7th and 8th grade: 264
- 9th grade: 48
- 10th grade: 148
- 11th grade: 13
- 12th grade, no diploma: 332
- High school graduate (or equivalency): 2,443
- Less than 1 year of college: 1,190
- Some college more than 1 year, no degree: 2,178
- Associate degree: 1,061
- Bachelor's degree: 5,126
- Master's degree: 2,349
- Professional school degree: 369
- Doctorate degree: 408

Education attainment for females 25 years and older:
- No schooling: 699
- Nursery to 4th grade: 186
- 5th and 6th grade: 148
- 7th and 8th grade: 94
- 9th grade: 100
- 10th grade: 83
- 11th grade: 81
- 12th grade, no diploma: 461
- High school graduate (or equivalency): 2,597
- Less than 1 year of college: 1,134
- Some college more than 1 year, no degree: 1,710
- Associate degree: 1,700
- Bachelor's degree: 5,826
- Master's degree: 2,167
- Professional school degree: 472
- Doctorate degree: 327


Housing units in structures:
- One, detached: 10,253
- One, attached: 2,768
- Two: 76
- 3 or 4: 470
- 5 to 9: 639
- 10 to 19: 307
- 20 to 49: 672
- 50 or more: 1,307
- Mobile homes: 304
- Boats, RVs, vans, etc.: 18
Median worth of mobile homes: $60,200
Housing units lacking complete kitchen facilities in 2022: 2.6%
House/condo owner moved in on average 16 years ago
Renter moved in on average 5 years ago

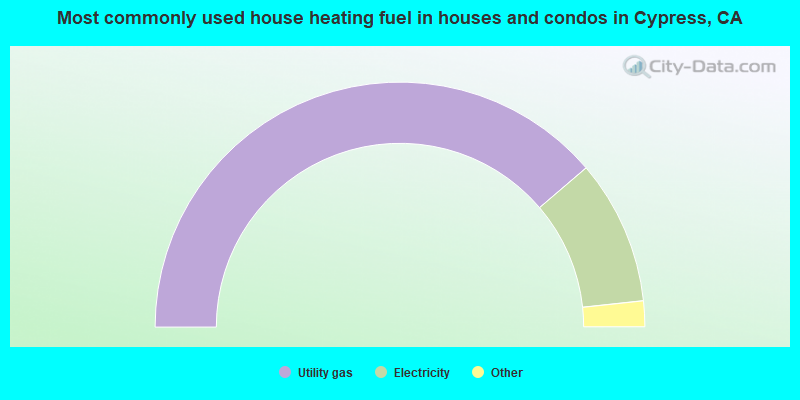
- 77.5%Utility gas
- 19.1%Electricity
- 1.4%Bottled, tank, or LP gas
- 1.1%No fuel used
- 0.9%Solar energy
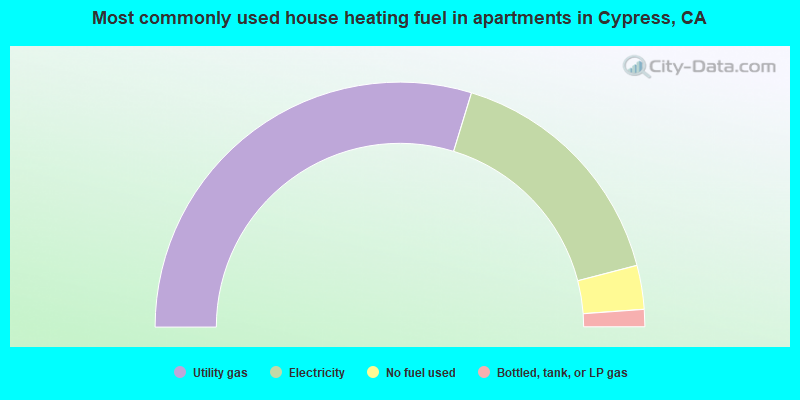
- 59.5%Utility gas
- 32.5%Electricity
- 5.8%No fuel used
- 2.3%Bottled, tank, or LP gas
Private vs. public school enrollment:
| Here: | 12.7% |
| California: | 10.5% |
| Here: | 2.7% |
| California: | 8.5% |
| Here: | 12.7% |
| California: | 15.9% |


