Daleville, IN (Indiana) Houses and Residents
| Daleville: | $109,316 |
| Indiana: | $208,700 |
Mean price in 2022:
Detached houses: $146,050
Here: $146,050 State: $257,916
Total population: 1,615 (Urban population: 1,523, Rural population: 69 (all nonfarm))
Houses: 691 (623 occupied: 462 owner occupied, 177 renter occupied)
| % of renters here: | 28% |
| State: | 29% |
Housing density: 347 houses/condos per square mile
Median price asked for vacant for-sale houses and condos in 2022 in this county: $74,604.
Median contract rent in 2022: $611 (lower quartile is $492, upper quartile is $799)
Median rent asked for vacant for-rent units in 2022: $447
Median gross rent in Daleville, IN in 2022: $798
Housing units in Daleville with a mortgage: 284 (43 second mortgage, 0 home equity loan, 24 both second mortgage and home equity loan)
Houses without a mortgage: 4
Median household income for houses/condos with a mortgage: $80,298
Median household income for apartments without a mortgage: $53,136
Median monthly housing costs: $789
Compare current foreclosures near Daleville, IN:
| Photo | Address | Area | Beds / Baths | Price | Details |
|---|---|---|---|---|---|

|
#1
S County Road 900 W
Daleville, IN 47334
|
2,828 sq. feet
|
2 baths 3 beds |
show details | |

|
#2
S County Road 900 W
Daleville, IN 47334
|
1,332 sq. feet
|
1 baths 2 beds |
show details | |

|
#3
W Main St
Daleville, IN 47334
|
1,300 sq. feet
|
2 baths 3 beds |
show details | |

|
#4
W 4th St
Daleville, IN 47334
|
1,048 sq. feet
|
1 baths 3 beds |
show details | |

|
#5
S May St
Daleville, IN 47334
|
1,560 sq. feet
|
2 baths 3 beds |
show details | |

|
#6
S County Road 900 W
Daleville, IN 47334
|
2,754 sq. feet
|
2 baths - beds |
show details | |

|
#7
W County Road 400 S
Daleville, IN 47334
|
- sq. feet
|
2 baths 4 beds |
show details | |

|
#8
Katriene Dr
Daleville, IN 47334
|
- sq. feet
|
- baths - beds |
show details | |

|
#9
S Greenway Dr
Daleville, IN 47334
|
- sq. feet
|
- baths - beds |
show details | |

|
#10
W Division Rd # 203
Daleville, IN 47334
|
- sq. feet
|
- baths - beds |
show details |
| Photo | Address | Area | Beds / Baths | Price | Details |
|---|---|---|---|---|---|

|
#11
W Main St
Daleville, IN 47334
|
- sq. feet
|
- baths - beds |
show details | |

|
#12
County Rd 300 S
Muncie, IN 47302
|
1,365 sq. feet
|
1 baths 3 beds |
$189,000
|
show details |

|
#13
W 10th St
Muncie, IN 47302
|
1,608 sq. feet
|
1 baths 2 beds |
$91,500
|
show details |

|
#14
S Whitney Rd
Selma, IN 47383
|
1,952 sq. feet
|
2 baths 3 beds |
$69,000
|
show details |

|
#15
N County Road 400 W
Middletown, IN 47356
|
2,338 sq. feet
|
2 baths 4 beds |
$307,000
|
show details |

|
#16
E Cr 800s
Muncie, IN 47302
|
1,648 sq. feet
|
1 baths 3 beds |
$260,000
|
show details |

|
#17
West 500 North
Gaston, IN 47342
|
1,736 sq. feet
|
1 baths 3 beds |
$214,900
|
show details |

|
#18
E 31st St
Anderson, IN 46016
|
1,053 sq. feet
|
1 baths 2 beds |
$7,900
|
show details |

|
#19
E New York St
Summitville, IN 46070
|
- sq. feet
|
1 baths 2 beds |
$1
|
show details |

|
#20
W County Rd 700 N
Middletown, IN 47356
|
- sq. feet
|
1 baths 3 beds |
$98,250
|
show details |
| Photo | Address | Area | Beds / Baths | Price | Details |
|---|---|---|---|---|---|

|
#21
W Skyway Dr
Muncie, IN 47303
|
1,548 sq. feet
|
1 baths 3 beds |
show details | |

|
#22
W 12th St
Anderson, IN 46016
|
3,208 sq. feet
|
3 baths 3 beds |
show details | |

|
#23
Oakwood Dr
Anderson, IN 46011
|
1,600 sq. feet
|
2 baths 3 beds |
show details | |

|
#24
E Fairlawn Way
Anderson, IN 46011
|
925 sq. feet
|
1 baths 3 beds |
show details | |

|
#25
Pearl St
Anderson, IN 46016
|
1,036 sq. feet
|
1 baths 2 beds |
show details | |

|
#26
Dewey St
Anderson, IN 46016
|
835 sq. feet
|
1 baths 2 beds |
show details | |

|
#27
S Walling Ave
Muncie, IN 47302
|
1,354 sq. feet
|
1 baths 3 beds |
show details | |

|
#28
Ivy Dr
Anderson, IN 46011
|
1,766 sq. feet
|
2 baths 3 beds |
show details | |

|
#29
Pearl St
Anderson, IN 46016
|
1,246 sq. feet
|
1 baths 3 beds |
show details | |

|
#30
S Chippewa Ln
Muncie, IN 47302
|
1,008 sq. feet
|
1 baths 3 beds |
show details |
| Photo | Address | Area | Beds / Baths | Price | Details |
|---|---|---|---|---|---|

|
#31
Chippewa Dr
Anderson, IN 46012
|
900 sq. feet
|
1 baths 3 beds |
show details | |

|
#32
W Woodway Dr
Muncie, IN 47304
|
2,152 sq. feet
|
2 baths 3 beds |
show details | |

|
#33
Nelle St
Anderson, IN 46016
|
1,266 sq. feet
|
2 baths 3 beds |
show details | |

|
#34
E 29th St
Anderson, IN 46016
|
1,408 sq. feet
|
1 baths 3 beds |
show details | |

|
#35
Kingsley Dr
Anderson, IN 46011
|
2,740 sq. feet
|
3 baths 4 beds |
show details | |

|
#36
Wildwood Ave
Anderson, IN 46011
|
1,133 sq. feet
|
1 baths 3 beds |
show details | |

|
#37
Briar Rd
Anderson, IN 46011
|
2,146 sq. feet
|
1 baths 3 beds |
show details | |

|
#38
S Manhattan Ave
Muncie, IN 47302
|
728 sq. feet
|
1 baths 2 beds |
show details | |

|
#39
Winding Dr
Alexandria, IN 46001
|
1,388 sq. feet
|
2 baths 2 beds |
show details | |

|
#40
S Stradling Rd
Muncie, IN 47304
|
3,096 sq. feet
|
2 baths 2 beds |
show details |
| Photo | Address | Area | Beds / Baths | Price | Details |
|---|---|---|---|---|---|

|
#41
Village Pkwy
Pendleton, IN 46064
|
1,320 sq. feet
|
2 baths 4 beds |
show details | |

|
#42
Yorkshire Rd
Anderson, IN 46012
|
2,120 sq. feet
|
2 baths 3 beds |
show details | |

|
#43
Raible Ave
Anderson, IN 46011
|
2,050 sq. feet
|
2 baths 4 beds |
show details | |

|
#44
W Coventry Dr
Muncie, IN 47304
|
2,153 sq. feet
|
3 baths 4 beds |
show details | |

|
#45
W Tree Ln
Muncie, IN 47302
|
1,924 sq. feet
|
4 baths 4 beds |
show details | |

|
#46
Alexandria Pike
Anderson, IN 46012
|
961 sq. feet
|
1 baths 2 beds |
show details | |

|
#47
N Saybrook Ln
Muncie, IN 47304
|
1,644 sq. feet
|
2 baths 2 beds |
show details | |

|
#48
Maplewood Ave
Anderson, IN 46012
|
1,823 sq. feet
|
2 baths 3 beds |
show details | |

|
#49
Manor Ct
Anderson, IN 46016
|
912 sq. feet
|
1 baths 2 beds |
show details | |

|
Check over 1 million property listings on Foreclosure.com!
|
browse all offers | |||

Latest news about housing in Daleville, IN collected exclusively by city-data.com from local newspapers, TV, and radio stations

 | What's with the cheap housing in Indianapolis? (30 replies) |
| Best Small Towns (20 replies) |
| Living in north suburbs and commute to Muncie? (21 replies) |
| Yorktown to Indy Commute? (10 replies) |
| Let's talk Daleville/New Castle (22 replies) |
| Question about Muncie schools (6 replies) |

Median year apartment built: 1974
Household type by relationship:
Households: 1,424- Male householders: 298 (77 living alone), Female householders: 323 (114 living alone)
279 spouses (279 opposite-sex spouses), 57 unmarried partners, (53 opposite-sex unmarried partners), 405 children (363 natural, 6 adopted, 34 stepchildren), 26 grandchildren, 8 brothers or sisters, 2 parents, 1 foster children, 9 other relatives, 7 non-relatives
Size of family households: 179 2-persons, 110 3-persons, 89 4-persons, 23 5-persons, 4 6-persons, 2 7-or-more-persons.
Size of nonfamily households: 202 1-person, 26 2-persons.
166 married couples with children.
116 single-parent households (13 men, 103 women).
97.6% of residents of Daleville speak English at home.
1.6% of residents speak Spanish at home (59% speak English very well, 41% speak English not well).
0.1% of residents speak Asian or Pacific Island language at home (100% speak English well).
Foreign born population: 19 (1.3%)
(15.8% of them are naturalized citizens)
| Here: | 6.3 |
| State: | 6.6 |
| Here: | 4.8 |
| State: | 4.3 |

- Bedrooms in owner-occupied houses and condos in Daleville, Indiana
- 0no bedroom
- 91 bedroom
- 922 bedrooms
- 3013 bedrooms
- 614 bedrooms
- 05+ bedrooms

- Bedrooms in renter-occupied apartments in Daleville, Indiana
- 0no bedroom
- 741 bedroom
- 382 bedrooms
- 573 bedrooms
- 34 bedrooms
- 65+ bedrooms

- Cars and other vehicles available in Daleville in owner-occupied houses/condos
- 12no vehicle
- 1461 vehicle
- 1902 vehicles
- 843 vehicles
- 124 vehicles
- 175+ vehicles

- Cars and other vehicles available in Daleville in renter-occupied apartments
- 7no vehicle
- 951 vehicle
- 712 vehicles
- 23 vehicles
- 04 vehicles
- 35+ vehicles

- Rooms in owner-occupied houses in Daleville, Indiana
- 01 room
- 02 rooms
- 23 rooms
- 234 rooms
- 1065 rooms
- 1186 rooms
- 1217 rooms
- 558 rooms
- 389+ rooms

- Rooms in renter-occupied apartments in Daleville, Indiana
- 01 room
- 02 rooms
- 473 rooms
- 284 rooms
- 495 rooms
- 116 rooms
- 167 rooms
- 168 rooms
- 99+ rooms


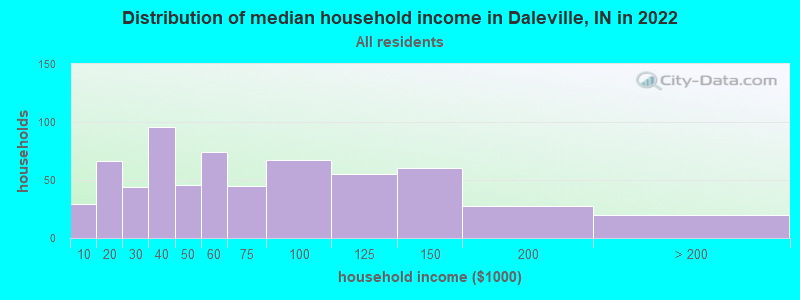
Daleville, IN household income distribution

- 29Less than $10,000
- 66$10,000 to $19,999
- 44$20,000 to $29,999
- 96$30,000 to $39,999
- 46$40,000 to $49,999
- 74$50,000 to $59,999
- 45$60,000 to $74,999
- 67$75,000 to $99,999
- 55$100,000 to $124,999
- 60$125,000 to $149,999
- 28$150,000 to $199,999
- 20$200,000 or more
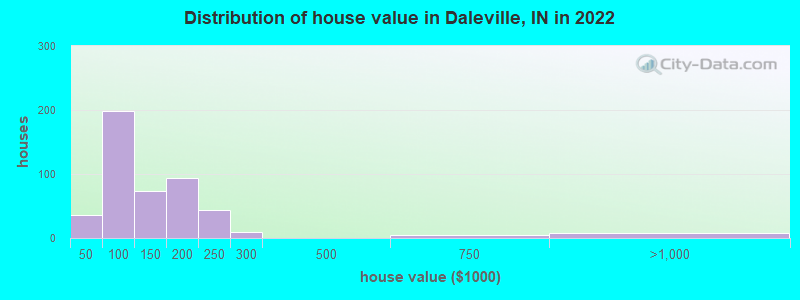
Home value of owner - occupied houses in 2022 in Daleville, IN
-
- 11$10,000 to $14,999
- 5$15,000 to $19,999
- 1$25,000 to $29,999
- 8$30,000 to $34,999
- 5$35,000 to $39,999
- 2$40,000 to $49,999
- 33$50,000 to $59,999
- 20$60,000 to $69,999
- 46$70,000 to $79,999
- 59$80,000 to $89,999
- 36$90,000 to $99,999
- 47$100,000 to $124,999
- 26$125,000 to $149,999
- 46$150,000 to $174,999
- 48$175,000 to $199,999
- 43$200,000 to $249,999
- 8$250,000 to $299,999
- 5$500,000 to $749,999
- 7$750,000 to $999,999
Rent paid by renters in 2022 in Daleville, IN
-
- 5$100 to $149
- 2$250 to $299
- 7$300 to $349
- 4$400 to $449
- 24$450 to $499
- 17$500 to $549
- 12$550 to $599
- 6$600 to $649
- 16$650 to $699
- 8$700 to $749
- 11$750 to $799
- 21$800 to $899
- 27$900 to $999
- 2$1,000 to $1,249
- 13No cash rent


Percentage of workers working in this county: 38.6%
Number of people working at home: 88 (13.1% of all workers)
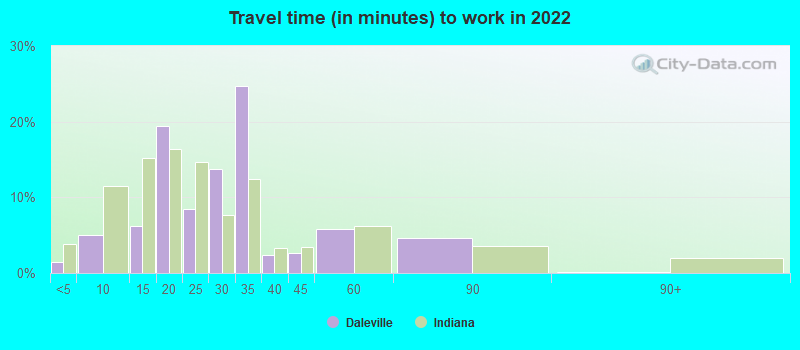
Travel time to work (commute)
- Less than 5 minutes: 24
- 5 to 9 minutes: 56
- 10 to 14 minutes: 43
- 15 to 19 minutes: 80
- 20 to 24 minutes: 96
- 25 to 29 minutes: 38
- 30 to 34 minutes: 40
- 35 to 39 minutes: 24
- 40 to 44 minutes: 14
- 45 to 59 minutes: 85
- 60 to 89 minutes: 69
- 90 or more minutes: 24
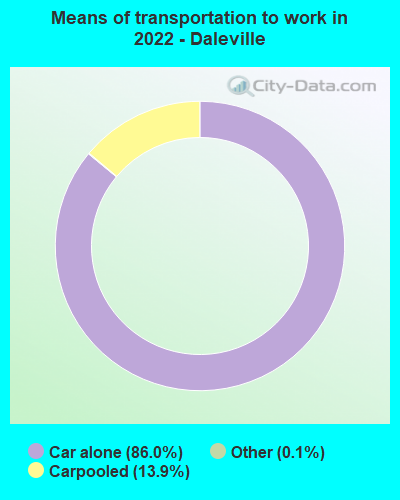
Means of transportation to work:
- Drove a car alone: 1,481 (79.7%)
- Carpooled: 263 (14.1%)
- Taxi: 2 (0.1%)
- Worked at home: 88 (4.7%)

- Unemployment by race in 2022
- Unemployment rate for White non-Hispanic residents
- 10.0%Males
- 4.7%Females

- Year of entry for the foreign-born population in Daleville, Indiana
- 02010 or later
- 152000 to 2009
- 01990 to 1999
- 31980 to 1989
- 11970 to 1979
- 1Before 1970

First ancestries reported:
- English: 125 (17.5%)
- American: 101 (14.1%)
- Irish: 87 (12.2%)
- German: 61 (8.5%)
- Swedish: 33 (4.6%)
- Scotch-Irish: 28 (3.9%)
- Cajun: 15 (2.1%)
- European: 15 (2.1%)
- French: 8 (1.1%)
- Welsh: 8 (1.1%)
- Norwegian: 7 (1.0%)
- Scottish: 7 (1.0%)
- Lithuanian: 4 (0.6%)
- British: 3 (0.4%)
- Pennsylvania German: 3 (0.4%)
- Romanian: 3 (0.4%)
- Italian: 2 (0.3%)
- Scandinavian: 2 (0.3%)
Most common places of birth for foreign-born residents (%):
| Daleville: | 77.8% (14) |
| Indiana: | 27.0% (101,996) |
| Daleville: | 5.6% (1) |
| Indiana: | 5.3% (19,877) |
Place of birth for U.S.-born residents:
- This state: 1,247
- Other state: 167
- Northeast: 3
- Midwest: 55
- South: 79
- West: 33
87.6% of Daleville residents lived in the same house 1 years ago.
Out of people who lived in different houses, 28.7% lived in this county.
Out of people who lived in different counties, 95.4% lived in Indiana.
| Daleville: | 87.6% |
| State average: | 87.1% |
Education attainment for males 25 years and older:
- No schooling: 0
- Nursery to 4th grade: 0
- 5th and 6th grade: 0
- 7th and 8th grade: 0
- 9th grade: 10
- 10th grade: 7
- 11th grade: 7
- 12th grade, no diploma: 2
- High school graduate (or equivalency): 155
- Less than 1 year of college: 30
- Some college more than 1 year, no degree: 74
- Associate degree: 67
- Bachelor's degree: 55
- Master's degree: 25
- Professional school degree: 6
- Doctorate degree: 1

Education attainment for females 25 years and older:
- No schooling: 0
- Nursery to 4th grade: 0
- 5th and 6th grade: 0
- 7th and 8th grade: 1
- 9th grade: 0
- 10th grade: 7
- 11th grade: 3
- 12th grade, no diploma: 5
- High school graduate (or equivalency): 218
- Less than 1 year of college: 42
- Some college more than 1 year, no degree: 44
- Associate degree: 51
- Bachelor's degree: 91
- Master's degree: 31
- Professional school degree: 4
- Doctorate degree: 47


Housing units in structures:
- One, detached: 563
- One, attached: 12
- Two: 44
- 3 or 4: 17
- 5 to 9: 38
- Mobile homes: 17
House/condo owner moved in on average 15 years ago
Renter moved in on average 1 years ago

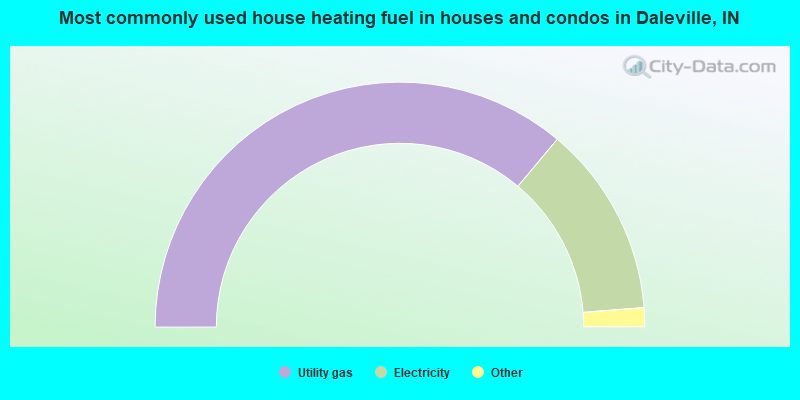
- 72.2%Utility gas
- 25.3%Electricity
- 1.1%Bottled, tank, or LP gas
- 0.9%Other fuel
- 0.4%Wood
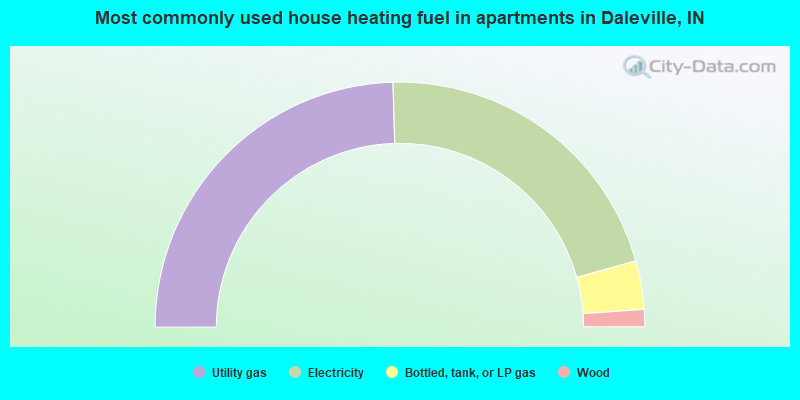
- 49.1%Utility gas
- 42.2%Electricity
- 6.4%Bottled, tank, or LP gas
- 2.3%Wood
Private vs. public school enrollment:
| Here: | 10.9% |
| Indiana: | 14.9% |
| Here: | 4.9% |
| Indiana: | 11.4% |
| Here: | 27.4% |
| Indiana: | 22.3% |


