Daleville, VA (Virginia) Houses and Residents
| Daleville: | $370,758 |
| Virginia: | $365,700 |
Total population: 2,557 (Urban population: 974, Rural population: 401 (all nonfarm))
Houses: 1,292 (1,211 occupied: 1,017 owner occupied, 207 renter occupied)
| % of renters here: | 17% |
| State: | 33% |
Housing density: 523 houses/condos per square mile
Median price asked for vacant for-sale houses and condos in 2022 in this county: $215,511.
Median contract rent in 2022: $1,588 (lower quartile is $1,332, upper quartile is $1,812)
Median rent asked for vacant for-rent units in 2022: $1,558
Median gross rent in Daleville, VA in 2022: $1,648
Housing units in Daleville with a mortgage: 682 (67 second mortgage, 0 home equity loan, 66 both second mortgage and home equity loan)
Houses without a mortgage: 59
Median household income for houses/condos with a mortgage: $100,214
Median household income for apartments without a mortgage: $108,824
Median monthly housing costs: $1,520
Compare current foreclosures near Daleville, VA:
| Photo | Address | Area | Beds / Baths | Price | Details |
|---|---|---|---|---|---|

|
#1
Camelia Dr
Daleville, VA 24083
|
1,092 sq. feet
|
- baths - beds |
show details | |

|
#2
Ashby Dr
Daleville, VA 24083
|
3,604 sq. feet
|
- baths - beds |
show details | |

|
#3
Town Center St Apt 106
Daleville, VA 24083
|
- sq. feet
|
- baths - beds |
show details | |

|
#4
Ridgecrest Dr
Vinton, VA 24179
|
1,182 sq. feet
|
2 baths 3 beds |
show details | |

|
#5
Chapman Ave SW
Roanoke, VA 24016
|
- sq. feet
|
3 baths 6 beds |
show details | |

|
#6
Eden Dr NW
Roanoke, VA 24012
|
945 sq. feet
|
2 baths 3 beds |
show details | |

|
#7
Victor Ave NE
Roanoke, VA 24012
|
913 sq. feet
|
1 baths 3 beds |
show details | |

|
#8
Cherokee Ln
Troutville, VA 24175
|
2,010 sq. feet
|
3 baths 4 beds |
show details | |

|
#9
Eveningwood Ln
Roanoke, VA 24019
|
1,000 sq. feet
|
2 baths 3 beds |
show details | |

|
#10
Maine Ave NW
Roanoke, VA 24017
|
889 sq. feet
|
1 baths 3 beds |
show details |
| Photo | Address | Area | Beds / Baths | Price | Details |
|---|---|---|---|---|---|

|
#11
Tinkerview Dr
Cloverdale, VA 24077
|
988 sq. feet
|
1 baths 2 beds |
show details | |

|
#12
Timberview Rd
Roanoke, VA 24019
|
1,344 sq. feet
|
2 baths 3 beds |
show details | |

|
#13
Eastgate Ave NE
Roanoke, VA 24012
|
960 sq. feet
|
3 baths 3 beds |
show details | |

|
#14
Lee Hwy
Buchanan, VA 24066
|
1,056 sq. feet
|
1 baths 3 beds |
show details | |

|
#15
Sunflower Dr
Vinton, VA 24179
|
2,310 sq. feet
|
2 baths 4 beds |
show details | |

|
#16
E Madison Ave
Vinton, VA 24179
|
1,531 sq. feet
|
1 baths 3 beds |
show details | |

|
#17
Catlett Dr
Salem, VA 24153
|
1,952 sq. feet
|
2 baths 3 beds |
show details | |

|
#18
Finney Dr
Vinton, VA 24179
|
1,734 sq. feet
|
1 baths 3 beds |
show details | |

|
#19
Lauderdale Ave
Vinton, VA 24179
|
1,188 sq. feet
|
2 baths 3 beds |
show details | |

|
#20
Norbourne Ave
Vinton, VA 24179
|
1,292 sq. feet
|
2 baths 3 beds |
show details |
| Photo | Address | Area | Beds / Baths | Price | Details |
|---|---|---|---|---|---|

|
#21
S Pacific Dr
Vinton, VA 24179
|
1,161 sq. feet
|
1 baths 3 beds |
show details | |

|
#22
Broadhill Dr
Vinton, VA 24179
|
1,943 sq. feet
|
2 baths 4 beds |
show details | |

|
#23
Red Lane Ext
Salem, VA 24153
|
1,100 sq. feet
|
1 baths 3 beds |
show details | |

|
#24
Newman Dr
Salem, VA 24153
|
2,188 sq. feet
|
2 baths 3 beds |
show details | |

|
#25
Sunflower Dr
Vinton, VA 24179
|
1,687 sq. feet
|
2 baths 4 beds |
show details | |

|
#26
Chestnut Mountain Dr
Vinton, VA 24179
|
1,574 sq. feet
|
2 baths 3 beds |
show details | |

|
#27
Olney Rd
Vinton, VA 24179
|
2,084 sq. feet
|
1 baths 4 beds |
show details | |

|
#28
E Augusta Ave
Vinton, VA 24179
|
1,105 sq. feet
|
2 baths 3 beds |
show details | |

|
#29
Wates Ln
Salem, VA 24153
|
1,091 sq. feet
|
1 baths 2 beds |
show details | |

|
#30
Governor Dr
Roanoke, VA 24019
|
1,913 sq. feet
|
2 baths 4 beds |
show details |
| Photo | Address | Area | Beds / Baths | Price | Details |
|---|---|---|---|---|---|

|
#31
Mason St
Salem, VA 24153
|
1,225 sq. feet
|
2 baths 4 beds |
show details | |

|
#32
Dominion Ln
Salem, VA 24153
|
976 sq. feet
|
1 baths 3 beds |
show details | |

|
#33
Poplar Grove Dr
Vinton, VA 24179
|
2,484 sq. feet
|
2 baths 3 beds |
show details | |

|
#34
Roanoke Blvd
Salem, VA 24153
|
1,665 sq. feet
|
2 baths 4 beds |
show details | |

|
#35
Howell Dr
Vinton, VA 24179
|
1,579 sq. feet
|
1 baths 3 beds |
show details | |

|
#36
Pitzer Rd
Roanoke, VA 24014
|
1,000 sq. feet
|
1 baths 3 beds |
show details | |

|
#37
Cherokee Hills Dr
Salem, VA 24153
|
1,827 sq. feet
|
4 baths 4 beds |
show details | |

|
#38
Branderwood Dr
Roanoke, VA 24018
|
2,100 sq. feet
|
2 baths 4 beds |
show details | |

|
#39
Branderwood Dr
Roanoke, VA 24018
|
2,100 sq. feet
|
2 baths 4 beds |
show details | |

|
#40
Merriman Rd
Roanoke, VA 24018
|
1,450 sq. feet
|
2 baths 3 beds |
show details |
| Photo | Address | Area | Beds / Baths | Price | Details |
|---|---|---|---|---|---|

|
#41
Crescent Blvd
Roanoke, VA 24018
|
1,152 sq. feet
|
2 baths 3 beds |
show details | |

|
#42
Overland Dr
Roanoke, VA 24018
|
1,080 sq. feet
|
2 baths 3 beds |
show details | |

|
#43
Fort Lewis Cir
Salem, VA 24153
|
1,312 sq. feet
|
2 baths 2 beds |
show details | |

|
#44
Galloway Cir
Roanoke, VA 24018
|
1,606 sq. feet
|
2 baths 3 beds |
show details | |

|
#45
Hammond Ln
Roanoke, VA 24018
|
1,583 sq. feet
|
2 baths 3 beds |
show details | |

|
#46
Martinell Ave
Roanoke, VA 24018
|
1,000 sq. feet
|
1 baths 3 beds |
show details | |

|
#47
Timberline Trl
Roanoke, VA 24018
|
772 sq. feet
|
1 baths 1 beds |
show details | |

|
#48
Millstream Dr
Salem, VA 24153
|
2,288 sq. feet
|
2 baths 4 beds |
show details | |

|
#49
Wyndale Ave
Roanoke, VA 24018
|
1,196 sq. feet
|
2 baths 3 beds |
show details | |

|
Check over 1 million property listings on Foreclosure.com!
|
browse all offers | |||

Latest news about housing in Daleville, VA collected exclusively by city-data.com from local newspapers, TV, and radio stations

 | apartment recommendations? Costs to build house? (12 replies) |
| Daleville in Botetourt County getting a Hampton Inn? (4 replies) |
| New Homes in Roanoke Area? (12 replies) |
| After 4 Years, My Impression of Roanoke (61 replies) |
| New apartment construction in Roanoke area (5 replies) |
| Need Advice : Relocating to Roanoke, Virginia (8 replies) |

Median year apartment built: 2010
Household type by relationship:
Households: 3,190- Male householders: 715 (186 living alone), Female householders: 484 (175 living alone)
648 spouses (648 opposite-sex spouses), 23 unmarried partners, (23 opposite-sex unmarried partners), 816 children (744 natural, 72 adopted, 0 stepchildren), 78 grandchildren, 68 brothers or sisters, 56 parents, 0 foster children, 91 other relatives, 25 non-relatives
- In group quarters: 182
Size of family households: 519 2-persons, 79 3-persons, 108 4-persons, 45 5-persons, 52 6-persons, 30 7-or-more-persons.
Size of nonfamily households: 371 1-person, 24 2-persons.
408 married couples with children.
57 single-parent households (0 men, 57 women).
97.5% of residents of Daleville speak English at home.
1.9% of residents speak Spanish at home (71% speak English very well, 29% speak English not well).
1.0% of residents speak Asian or Pacific Island language at home (100% speak English very well).
Foreign born population: 16 (0.5%)
(100.0% of them are naturalized citizens)
| Here: | 7.1 |
| State: | 7.0 |
| Here: | 3.7 |
| State: | 4.3 |

- Bedrooms in owner-occupied houses and condos in Daleville, Virginia
- 0no bedroom
- 161 bedroom
- 552 bedrooms
- 5463 bedrooms
- 2524 bedrooms
- 1485+ bedrooms

- Bedrooms in renter-occupied apartments in Daleville, Virginia
- 0no bedroom
- 571 bedroom
- 1422 bedrooms
- 93 bedrooms
- 04 bedrooms
- 05+ bedrooms

- Cars and other vehicles available in Daleville in owner-occupied houses/condos
- 0no vehicle
- 1931 vehicle
- 4922 vehicles
- 2083 vehicles
- 704 vehicles
- 545+ vehicles

- Cars and other vehicles available in Daleville in renter-occupied apartments
- 54no vehicle
- 951 vehicle
- 592 vehicles
- 03 vehicles
- 04 vehicles
- 05+ vehicles

- Rooms in owner-occupied houses in Daleville, Virginia
- 01 room
- 02 rooms
- 143 rooms
- 764 rooms
- 735 rooms
- 2066 rooms
- 2167 rooms
- 1838 rooms
- 2509+ rooms

- Rooms in renter-occupied apartments in Daleville, Virginia
- 01 room
- 02 rooms
- 763 rooms
- 1094 rooms
- 235 rooms
- 06 rooms
- 07 rooms
- 08 rooms
- 09+ rooms


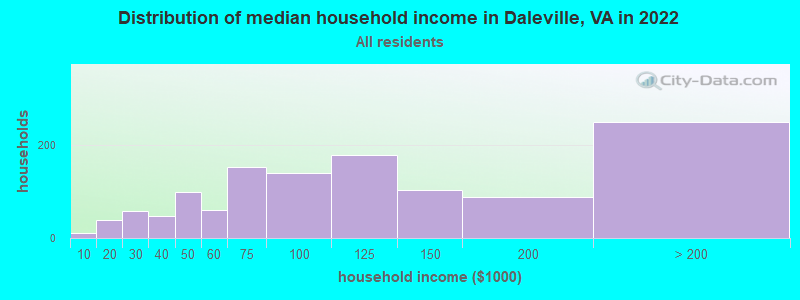
Daleville, VA household income distribution

- 10Less than $10,000
- 38$10,000 to $19,999
- 58$20,000 to $29,999
- 47$30,000 to $39,999
- 98$40,000 to $49,999
- 61$50,000 to $59,999
- 152$60,000 to $74,999
- 139$75,000 to $99,999
- 178$100,000 to $124,999
- 103$125,000 to $149,999
- 88$150,000 to $199,999
- 249$200,000 or more
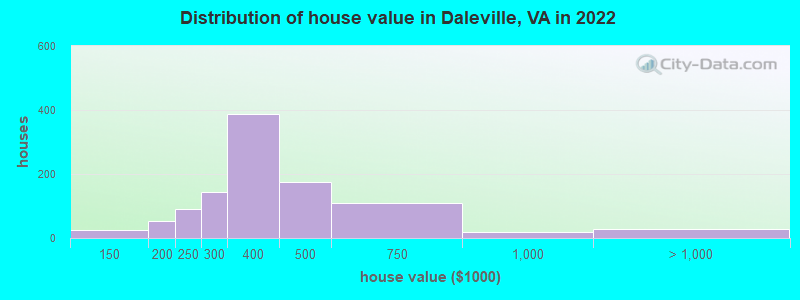
Home value of owner - occupied houses in 2022 in Daleville, VA
-
- 18$100,000 to $124,999
- 7$125,000 to $149,999
- 12$150,000 to $174,999
- 40$175,000 to $199,999
- 90$200,000 to $249,999
- 143$250,000 to $299,999
- 388$300,000 to $399,999
- 175$400,000 to $499,999
- 108$500,000 to $749,999
- 18$750,000 to $999,999
- 29$1,000,000 to $1,499,999
Rent paid by renters in 2022 in Daleville, VA
-
- 19$600 to $649
- 15$1,000 to $1,249
- 55$1,250 to $1,499
- 112$1,500 to $1,999
- 10$3,500 or more


Percentage of workers working in this county: 50.8%
Number of people working at home: 84 (6.9% of all workers)

Travel time to work (commute)
- Less than 5 minutes: 51
- 5 to 9 minutes: 76
- 10 to 14 minutes: 322
- 15 to 19 minutes: 71
- 20 to 24 minutes: 172
- 25 to 29 minutes: 148
- 30 to 34 minutes: 246
- 35 to 39 minutes: 25
- 40 to 44 minutes: 0
- 45 to 59 minutes: 0
- 60 to 89 minutes: 5
- 90 or more minutes: 9
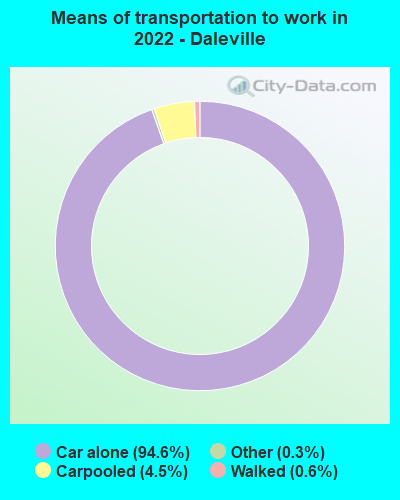
Means of transportation to work:
- Drove a car alone: 2,304 (87.9%)
- Carpooled: 111 (4.2%)
- Taxi: 9 (0.3%)
- Walked: 14 (0.5%)
- Worked at home: 84 (3.2%)

- Unemployment by race in 2022
- Unemployment rate for White non-Hispanic residents
- 7.2%Males
- 8.0%Females

- Year of entry for the foreign-born population in Daleville, Virginia
- 182010 or later
- 02000 to 2009
- 01990 to 1999
- 01980 to 1989
- 01970 to 1979
- 17Before 1970
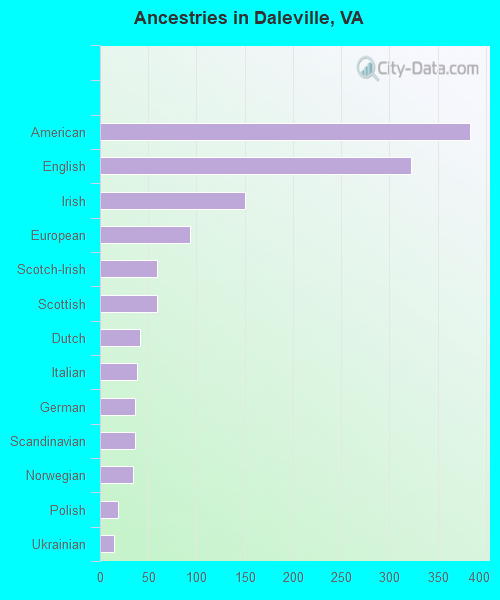
First ancestries reported:
- American: 384 (24.3%)
- English: 322 (20.4%)
- Irish: 150 (9.5%)
- European: 93 (5.9%)
- Scotch-Irish: 59 (3.7%)
- Scottish: 59 (3.7%)
- Dutch: 41 (2.6%)
- Italian: 38 (2.4%)
- German: 36 (2.3%)
- Scandinavian: 36 (2.3%)
- Norwegian: 34 (2.2%)
- Polish: 19 (1.2%)
- Ukrainian: 15 (1.0%)
Most common places of birth for foreign-born residents (%):
| Daleville: | 93.8% (15) |
| Virginia: | 0.4% (4,301) |
Place of birth for U.S.-born residents:
- This state: 2,118
- Other state: 1,043
- Northeast: 229
- Midwest: 326
- South: 451
- West: 27
96.0% of Daleville residents lived in the same house 1 years ago.
Out of people who lived in different houses, 31.0% lived in this county.
Out of people who lived in different counties, 85.1% lived in Virginia.
| Daleville: | 96.0% |
| State average: | 86.6% |
Education attainment for males 25 years and older:
- No schooling: 32
- Nursery to 4th grade: 0
- 5th and 6th grade: 0
- 7th and 8th grade: 5
- 9th grade: 39
- 10th grade: 0
- 11th grade: 14
- 12th grade, no diploma: 0
- High school graduate (or equivalency): 424
- Less than 1 year of college: 21
- Some college more than 1 year, no degree: 55
- Associate degree: 159
- Bachelor's degree: 284
- Master's degree: 105
- Professional school degree: 84
- Doctorate degree: 35

Education attainment for females 25 years and older:
- No schooling: 24
- Nursery to 4th grade: 0
- 5th and 6th grade: 23
- 7th and 8th grade: 48
- 9th grade: 42
- 10th grade: 0
- 11th grade: 13
- 12th grade, no diploma: 0
- High school graduate (or equivalency): 234
- Less than 1 year of college: 116
- Some college more than 1 year, no degree: 110
- Associate degree: 219
- Bachelor's degree: 270
- Master's degree: 150
- Professional school degree: 9
- Doctorate degree: 0


Housing units in structures:
- One, detached: 889
- One, attached: 105
- 20 to 49: 150
- 50 or more: 146
House/condo owner moved in on average 8 years ago
Renter moved in on average 0 years ago

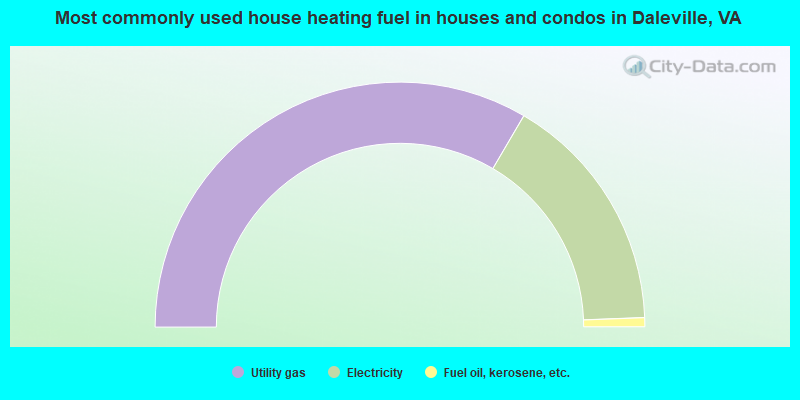
- 66.9%Utility gas
- 31.9%Electricity
- 1.2%Fuel oil, kerosene, etc.
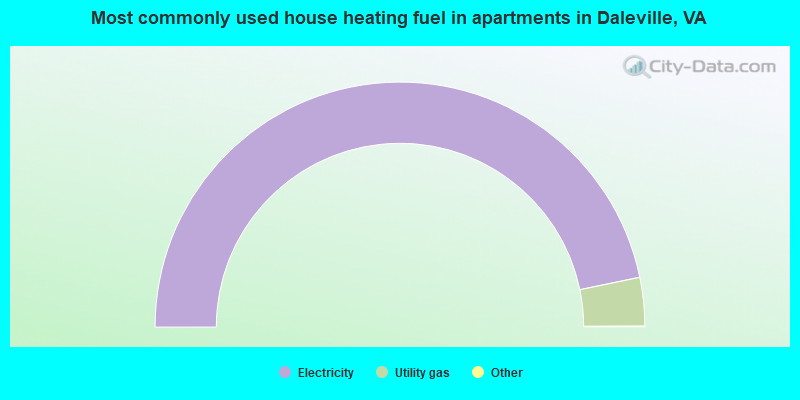
- 93.6%Electricity
- 6.4%Utility gas
Private vs. public school enrollment:
| Here: | 0.0% |
| Virginia: | 13.2% |
| Here: | 18.2% |
| Virginia: | 10.2% |
| Here: | 0.0% |
| Virginia: | 18.7% |


