Daly City, CA (California) Houses and Residents
| Daly City: | $1,121,600 |
| California: | $715,900 |
Mean price in 2022:
Detached houses: $1,171,949
Here: $1,171,949 State: $988,808 Townhouses or other attached units: $1,081,239
Here: $1,081,239 State: $838,546 In 2-unit structures: $1,220,593
Here: $1,220,593 State: $1,138,100 In 3-to-4-unit structures: $1,006,533
Here: $1,006,533 State: $824,253 In 5-or-more-unit structures: $749,912
Here: $749,912 State: $730,996 Mobile homes: $277,298
Here: $277,298 State: $184,506
Total population: 106,094 (Urban population: 103,549, Rural population: 0)
Houses: 36,493 (31,836 occupied: 18,921 owner occupied, 12,915 renter occupied)
| % of renters here: | 41% |
| State: | 44% |
Housing density: 4,826 houses/condos per square mile
Median price asked for vacant for-sale houses and condos in 2022: $1,000,033.
Median contract rent in 2022: over $2,000 (lower quartile is $1,740, upper quartile is over $2,000)
Median rent asked for vacant for-rent units in 2022: $5,265
Median gross rent in Daly City, CA in 2022: over $2,000
Housing units in Daly City with a mortgage: 11,545 (1,887 second mortgage, 97 home equity loan, 1,725 both second mortgage and home equity loan)
Houses without a mortgage: 256
Median household income for houses/condos with a mortgage: $161,608
Median household income for apartments without a mortgage: $103,783
Median monthly housing costs: $2,471
Compare current foreclosures in Daly City, CA:
| Photo | Address | Area | Beds / Baths | Price | Details |
|---|---|---|---|---|---|

|
#1
Cedar Ct
Daly City, CA 94014
|
1,200 sq. feet
|
2 baths 3 beds |
show details | |

|
#2
Crestline Ave
Daly City, CA 94015
|
1,060 sq. feet
|
1 baths 2 beds |
show details | |

|
#3
Callan Blvd
Daly City, CA 94015
|
1,380 sq. feet
|
2 baths 3 beds |
show details | |

|
#4
El Dorado Dr
Daly City, CA 94015
|
2,390 sq. feet
|
2 baths 3 beds |
show details | |

|
#5
Mateo Ave
Daly City, CA 94014
|
1,370 sq. feet
|
2 baths 3 beds |
show details | |

|
#6
Perita Dr
Daly City, CA 94015
|
1,270 sq. feet
|
2 baths 3 beds |
show details | |

|
#7
Verducci Dr
Daly City, CA 94015
|
2,130 sq. feet
|
2 baths 5 beds |
show details | |

|
#8
1st Ave
Daly City, CA 94014
|
1,460 sq. feet
|
2 baths 3 beds |
show details | |

|
#9
Lakeshire Dr
Daly City, CA 94015
|
2,010 sq. feet
|
3 baths 4 beds |
show details | |

|
#10
Accacia St
Daly City, CA 94014
|
1,950 sq. feet
|
3 baths 3 beds |
show details |
| Photo | Address | Area | Beds / Baths | Price | Details |
|---|---|---|---|---|---|

|
#11
Wildwood Ave
Daly City, CA 94015
|
1,120 sq. feet
|
1 baths 3 beds |
show details | |

|
#12
Wildwood Ave
Daly City, CA 94015
|
1,120 sq. feet
|
1 baths 3 beds |
show details | |

|
#13
Mandarin Dr Apt 311
Daly City, CA 94015
|
717 sq. feet
|
1 baths 1 beds |
show details | |

|
#14
Wakefield Ave
Daly City, CA 94015
|
1,800 sq. feet
|
2 baths 3 beds |
show details | |

|
#15
Brunswick St
Daly City, CA 94014
|
1,560 sq. feet
|
1 baths 3 beds |
show details | |

|
#16
Sweetwood Dr
Daly City, CA 94015
|
1,140 sq. feet
|
1 baths 3 beds |
show details | |

|
#17
Plymouth Cir
Daly City, CA 94015
|
1,340 sq. feet
|
2 baths 3 beds |
show details | |

|
#18
Crestline Ave
Daly City, CA 94015
|
1,060 sq. feet
|
1 baths 2 beds |
show details | |

|
#19
Hanover St
Daly City, CA 94014
|
1,170 sq. feet
|
1 baths 2 beds |
show details | |

|
#20
Bellevue Ave
Daly City, CA 94014
|
880 sq. feet
|
1 baths 2 beds |
show details |
| Photo | Address | Area | Beds / Baths | Price | Details |
|---|---|---|---|---|---|

|
#21
Wyandotte Ave
Daly City, CA 94014
|
1,680 sq. feet
|
2 baths 3 beds |
show details | |

|
#22
Ford St
Daly City, CA 94014
|
1,770 sq. feet
|
1 baths 3 beds |
show details | |

|
#23
Alexander Ave
Daly City, CA 94014
|
970 sq. feet
|
1 baths 2 beds |
show details | |

|
#24
2nd Ave
Daly City, CA 94014
|
1,620 sq. feet
|
2 baths 3 beds |
show details | |

|
#25
Village Ln
Daly City, CA 94015
|
1,420 sq. feet
|
1 baths 2 beds |
show details | |

|
#26
Higate Dr
Daly City, CA 94015
|
2,230 sq. feet
|
3 baths 4 beds |
show details | |

|
#27
Geneva Ave
Daly City, CA 94014
|
1,010 sq. feet
|
2 baths 3 beds |
show details | |

|
#28
Melissa Cir
Daly City, CA 94014
|
1,790 sq. feet
|
3 baths 4 beds |
show details | |

|
#29
Irvington St
Daly City, CA 94014
|
1,390 sq. feet
|
1 baths 2 beds |
show details | |

|
#30
Half Moon Ln Apt 313
Daly City, CA 94015
|
717 sq. feet
|
1 baths 1 beds |
show details |
| Photo | Address | Area | Beds / Baths | Price | Details |
|---|---|---|---|---|---|

|
#31
Irvington St
Daly City, CA 94014
|
1,720 sq. feet
|
2 baths 4 beds |
show details | |

|
#32
Irvington St
Daly City, CA 94014
|
1,230 sq. feet
|
1 baths 2 beds |
show details | |

|
#33
Hillside Blvd
Daly City, CA 94014
|
2,250 sq. feet
|
3 baths 3 beds |
show details | |

|
#34
Victoria St
Daly City, CA 94015
|
1,200 sq. feet
|
2 baths 3 beds |
show details | |

|
#35
Southgate Ave
Daly City, CA 94015
|
1,200 sq. feet
|
1 baths 2 beds |
show details | |

|
#36
Northaven Dr
Daly City, CA 94015
|
1,380 sq. feet
|
2 baths 4 beds |
show details | |

|
#37
Park Manor Dr
Daly City, CA 94015
|
1,770 sq. feet
|
2 baths 3 beds |
show details | |

|
#38
Bellevue Ave
Daly City, CA 94014
|
- sq. feet
|
2 baths 4 beds |
show details | |

|
#39
Tallwood Dr # 1
Daly City, CA 94014
|
- sq. feet
|
3 baths 4 beds |
show details | |

|
#40
Lausanne Ave Apt 2
Daly City, CA 94014
|
- sq. feet
|
- baths - beds |
show details |
| Photo | Address | Area | Beds / Baths | Price | Details |
|---|---|---|---|---|---|

|
#41
Clarinada Ave Apt 12
Daly City, CA 94015
|
- sq. feet
|
- baths - beds |
show details | |

|
#42
Oliver St
Daly City, CA 94014
|
- sq. feet
|
- baths - beds |
show details | |

|
#43
El Camino Real
Daly City, CA 94014
|
- sq. feet
|
- baths - beds |
show details | |

|
#44
Northridge Dr
Daly City, CA 94015
|
- sq. feet
|
- baths - beds |
show details | |

|
#45
Sylvan St Apt 4
Daly City, CA 94014
|
- sq. feet
|
- baths - beds |
show details | |

|
#46
Escuela Dr Apt 7
Daly City, CA 94015
|
- sq. feet
|
- baths - beds |
show details | |

|
#47
Crestwood Dr Apt 9
Daly City, CA 94015
|
- sq. feet
|
- baths - beds |
show details | |

|
#48
Partridge Ln
Daly City, CA 94014
|
- sq. feet
|
- baths - beds |
show details | |

|
#49
School St Apt 2
Daly City, CA 94014
|
- sq. feet
|
- baths - beds |
show details | |

|
Check over 1 million property listings on Foreclosure.com!
|
browse all offers | |||


Median year apartment built: 1970
Household type by relationship:
Households: 99,990- Male householders: 17,587 (3,301 living alone), Female householders: 14,249 (3,080 living alone)
15,976 spouses (15,889 opposite-sex spouses), 1,942 unmarried partners, (1,766 opposite-sex unmarried partners), 24,889 children (23,746 natural, 279 adopted, 864 stepchildren), 2,223 grandchildren, 3,723 brothers or sisters, 5,435 parents, 0 foster children, 6,566 other relatives, 6,569 non-relatives
- In group quarters: 831
Size of family households: 7,856 2-persons, 6,588 3-persons, 4,165 4-persons, 2,347 5-persons, 1,248 6-persons, 838 7-or-more-persons.
Size of nonfamily households: 6,381 1-person, 1,373 2-persons, 674 3-persons, 279 4-persons, 87 5-persons.
8,984 married couples with children.
2,975 single-parent households (840 men, 2,135 women).
38.5% of residents of Daly City speak English at home.
14.6% of residents speak Spanish at home (51% speak English very well, 22% speak English well, 21% speak English not well, 6% don't speak English at all).
3.0% of residents speak other Indo-European language at home (68% speak English very well, 22% speak English well, 10% speak English not well).
43.8% of residents speak Asian or Pacific Island language at home (54% speak English very well, 29% speak English well, 12% speak English not well, 5% don't speak English at all).
1.0% of residents speak other language at home (61% speak English very well, 19% speak English well, 15% speak English not well, 5% don't speak English at all).
Foreign born population: 52,002 (52.0%)
(68.7% of them are naturalized citizens)
| Here: | 5.6 |
| State: | 6.0 |
| Here: | 3.4 |
| State: | 3.9 |

- Bedrooms in owner-occupied houses and condos in Daly City, California
- 256no bedroom
- 5411 bedroom
- 3,9432 bedrooms
- 8,8333 bedrooms
- 4,3264 bedrooms
- 1,0225+ bedrooms

- Bedrooms in renter-occupied apartments in Daly City, California
- 1,191no bedroom
- 5,1891 bedroom
- 3,3552 bedrooms
- 2,0173 bedrooms
- 8674 bedrooms
- 2965+ bedrooms

- Cars and other vehicles available in Daly City in owner-occupied houses/condos
- 798no vehicle
- 4,1811 vehicle
- 8,6912 vehicles
- 3,3313 vehicles
- 1,5484 vehicles
- 3725+ vehicles

- Cars and other vehicles available in Daly City in renter-occupied apartments
- 1,447no vehicle
- 5,0711 vehicle
- 4,4492 vehicles
- 1,3583 vehicles
- 4474 vehicles
- 1435+ vehicles

- Rooms in owner-occupied houses in Daly City, California
- 2561 room
- 4892 rooms
- 9853 rooms
- 3,2504 rooms
- 3,9425 rooms
- 4,0946 rooms
- 2,2607 rooms
- 2,1178 rooms
- 1,5289+ rooms

- Rooms in renter-occupied apartments in Daly City, California
- 1,1671 room
- 1,3282 rooms
- 4,6423 rooms
- 2,4664 rooms
- 1,1385 rooms
- 1,0396 rooms
- 7707 rooms
- 1648 rooms
- 2019+ rooms


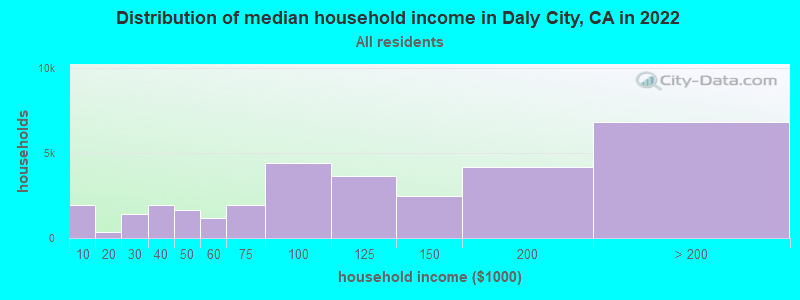
Daly City, CA household income distribution

- 1,912Less than $10,000
- 368$10,000 to $19,999
- 1,413$20,000 to $29,999
- 1,924$30,000 to $39,999
- 1,630$40,000 to $49,999
- 1,168$50,000 to $59,999
- 1,911$60,000 to $74,999
- 4,402$75,000 to $99,999
- 3,656$100,000 to $124,999
- 2,485$125,000 to $149,999
- 4,160$150,000 to $199,999
- 6,807$200,000 or more
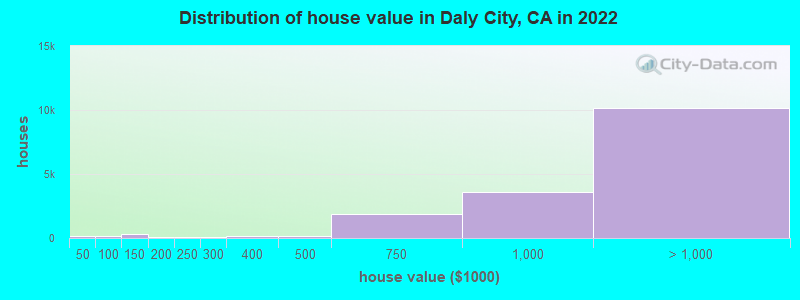
Home value of owner - occupied houses in 2022 in Daly City, CA
-
- 80Less than $10,000
- 48$10,000 to $14,999
- 6$30,000 to $34,999
- 4$40,000 to $49,999
- 21$50,000 to $59,999
- 51$60,000 to $69,999
- 12$70,000 to $79,999
- 24$80,000 to $89,999
- 39$90,000 to $99,999
- 273$100,000 to $124,999
- 19$125,000 to $149,999
- 46$150,000 to $174,999
- 66$175,000 to $199,999
- 42$200,000 to $249,999
- 95$250,000 to $299,999
- 156$300,000 to $399,999
- 162$400,000 to $499,999
- 1,875$500,000 to $749,999
- 3,593$750,000 to $999,999
- 7,990$1,000,000 to $1,499,999
- 1,713$1,500,000 to $1,999,999
- 433$2,000,000 or more
Rent paid by renters in 2022 in Daly City, CA
-
- 15$100 to $149
- 108$150 to $199
- 78$250 to $299
- 6$300 to $349
- 40$350 to $399
- 22$500 to $549
- 207$650 to $699
- 45$700 to $749
- 43$750 to $799
- 302$800 to $899
- 236$900 to $999
- 433$1,000 to $1,249
- 630$1,250 to $1,499
- 2,160$1,500 to $1,999
- 2,858$2,000 to $2,499
- 2,946$2,500 to $2,999
- 1,317$3,000 to $3,499
- 1,287$3,500 or more
- 804No cash rent


Percentage of workers working in this county: 61.5%
Number of people working at home: 9,942 (18.1% of all workers)
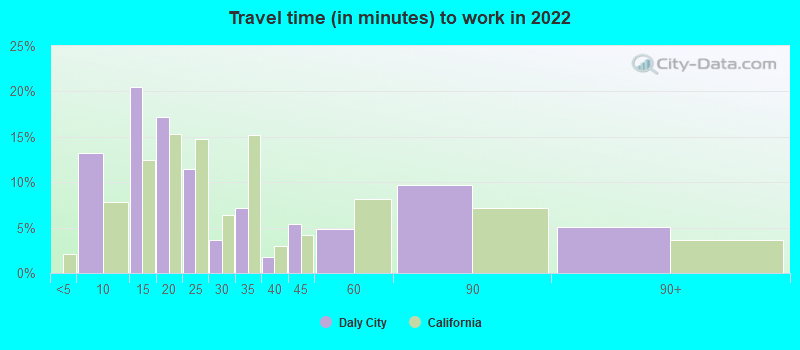
Travel time to work (commute)
- Less than 5 minutes: 191
- 5 to 9 minutes: 2,938
- 10 to 14 minutes: 4,859
- 15 to 19 minutes: 7,228
- 20 to 24 minutes: 8,643
- 25 to 29 minutes: 2,348
- 30 to 34 minutes: 8,006
- 35 to 39 minutes: 1,749
- 40 to 44 minutes: 3,309
- 45 to 59 minutes: 3,225
- 60 to 89 minutes: 1,421
- 90 or more minutes: 1,058
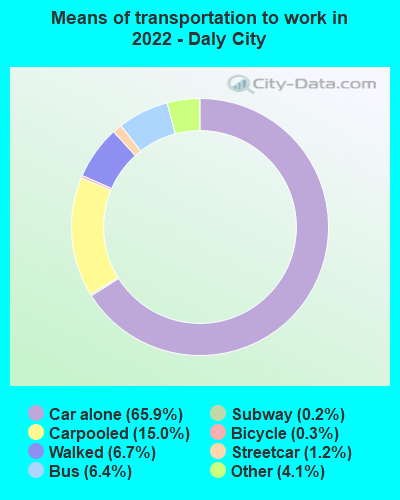
Means of transportation to work:
- Drove a car alone: 9,828 (45.3%)
- Carpooled: 2,440 (11.3%)
- Bus: 856 (3.9%)
- Subway or elevated rail: 144 (0.7%)
- Long-distance train or commuter rail: 27 (0.1%)
- Light rail, streetcar or trolley: 9 (0.0%)
- Ferryboat: 16 (0.1%)
- Taxi: 499 (2.3%)
- Bicycle: 54 (0.2%)
- Walked: 1,125 (5.2%)
- Worked at home: 7,320 (33.8%)

- Unemployment by race in 2022
- Unemployment rate for White non-Hispanic residents
- 5.4%Males
- 5.3%Females
- Unemployment rate for Black residents
- 3.2%Males
- 7.7%Females
- Unemployment rate for American Indian and Alaska Native residents
- 16.0%Males
- Unemployment rate for Asian residents
- 2.4%Males
- 7.8%Females
- Unemployment rate for other race residents
- 7.5%Females
- Unemployment rate for two or more race residents
- 3.7%Males
- 2.4%Females
- Unemployment rate for Hispanic or Latino residents
- 4.1%Females

- Year of entry for the foreign-born population in Daly City, California
- 12,2292010 or later
- 9,9712000 to 2009
- 8,4641990 to 1999
- 18,3251980 to 1989
- 10,6691970 to 1979
- 6,639Before 1970

First ancestries reported:
- American: 1,225 (1.7%)
- Italian: 748 (1.0%)
- European: 459 (0.6%)
- German: 446 (0.6%)
- Brazilian: 441 (0.6%)
- Russian: 415 (0.6%)
- Irish: 402 (0.6%)
- Jordanian: 352 (0.5%)
- Arab: 285 (0.4%)
- Iranian: 282 (0.4%)
- English: 277 (0.4%)
- Palestinian: 194 (0.3%)
- Polish: 135 (0.2%)
- Greek: 127 (0.2%)
- Armenian: 126 (0.2%)
- Iraqi: 102 (0.1%)
- Bulgarian: 98 (0.1%)
- Dutch: 97 (0.1%)
- African: 97 (0.1%)
- Egyptian: 71 (0.10%)
- French: 63 (0.09%)
- Kenyan: 63 (0.09%)
- Norwegian: 58 (0.08%)
- Ethiopian: 50 (0.07%)
- Swedish: 49 (0.07%)
- Ukrainian: 47 (0.07%)
- Nigerian: 40 (0.06%)
- French Canadian: 37 (0.05%)
- British: 36 (0.05%)
- Scottish: 36 (0.05%)
- Northern European: 32 (0.04%)
- Canadian: 28 (0.04%)
- Eastern European: 25 (0.03%)
- Scotch-Irish: 25 (0.03%)
- Basque: 24 (0.03%)
- Maltese: 24 (0.03%)
- Portuguese: 23 (0.03%)
- Lebanese: 17 (0.02%)
- Belgian: 14 (0.02%)
- Czech: 13 (0.02%)
- Belizean: 13 (0.02%)
- Hungarian: 11 (0.02%)
- Danish: 9 (0.01%)
- Scandinavian: 9 (0.01%)
- Welsh: 8 (0.01%)
- Sudanese: 8 (0.01%)
- Croatian: 6 (0.01%)
Most common places of birth for foreign-born residents (%):
| Daly City: | 39.2% (20,548) |
| California: | 7.8% (818,297) |
| Daly City: | 14.9% (7,789) |
| California: | 6.6% (684,672) |
| Daly City: | 7.4% (3,872) |
| California: | 4.2% (440,287) |
| Daly City: | 5.8% (3,040) |
| California: | 1.0% (105,215) |
| Daly City: | 4.1% (2,165) |
| California: | 0.3% (28,176) |
| Daly City: | 4.1% (2,160) |
| California: | 37.2% (3,881,193) |
| Daly City: | 3.4% (1,777) |
| California: | 0.6% (58,161) |
| Daly City: | 2.4% (1,235) |
| California: | 4.9% (512,335) |
| Daly City: | 2.1% (1,082) |
| California: | 2.8% (290,436) |
| Daly City: | 1.6% (844) |
| California: | 0.6% (66,590) |
Place of birth for U.S.-born residents:
- This state: 41,104
- Other state: 5,118
- Northeast: 971
- Midwest: 838
- South: 1,659
- West: 1,650
90.5% of Daly City residents lived in the same house 1 years ago.
Out of people who lived in different houses, 31.0% lived in this county.
Out of people who lived in different counties, 85.3% lived in California.
| Daly City: | 90.5% |
| State average: | 88.9% |
Education attainment for males 25 years and older:
- No schooling: 1,249
- Nursery to 4th grade: 148
- 5th and 6th grade: 623
- 7th and 8th grade: 901
- 9th grade: 403
- 10th grade: 441
- 11th grade: 272
- 12th grade, no diploma: 1,190
- High school graduate (or equivalency): 9,487
- Less than 1 year of college: 3,577
- Some college more than 1 year, no degree: 5,752
- Associate degree: 2,899
- Bachelor's degree: 9,237
- Master's degree: 2,421
- Professional school degree: 691
- Doctorate degree: 202

Education attainment for females 25 years and older:
- No schooling: 1,473
- Nursery to 4th grade: 563
- 5th and 6th grade: 1,186
- 7th and 8th grade: 522
- 9th grade: 47
- 10th grade: 206
- 11th grade: 59
- 12th grade, no diploma: 1,320
- High school graduate (or equivalency): 7,470
- Less than 1 year of college: 2,681
- Some college more than 1 year, no degree: 4,301
- Associate degree: 2,729
- Bachelor's degree: 11,515
- Master's degree: 2,599
- Professional school degree: 808
- Doctorate degree: 235


Housing units in structures:
- One, detached: 17,262
- One, attached: 4,779
- Two: 1,522
- 3 or 4: 1,836
- 5 to 9: 1,258
- 10 to 19: 2,804
- 20 to 49: 3,674
- 50 or more: 2,710
- Mobile homes: 603
- Boats, RVs, vans, etc.: 45
Median worth of mobile homes: $193,000
Housing units lacking complete kitchen facilities in 2022: 0.6%
House/condo owner moved in on average 19 years ago
Renter moved in on average 3 years ago

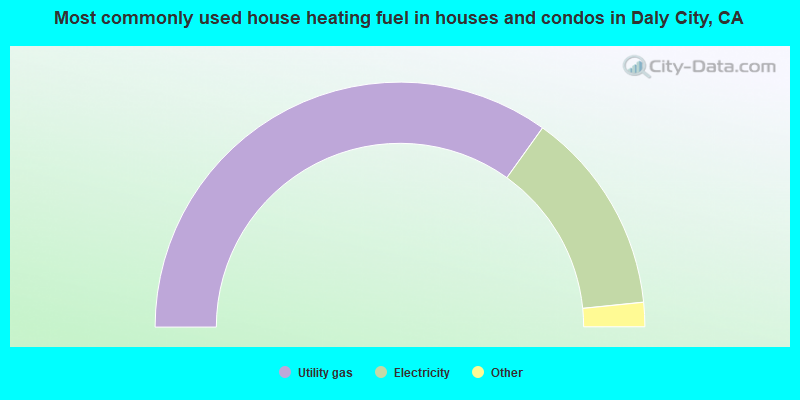
- 69.8%Utility gas
- 27.0%Electricity
- 1.4%Bottled, tank, or LP gas
- 1.2%No fuel used
- 0.5%Solar energy
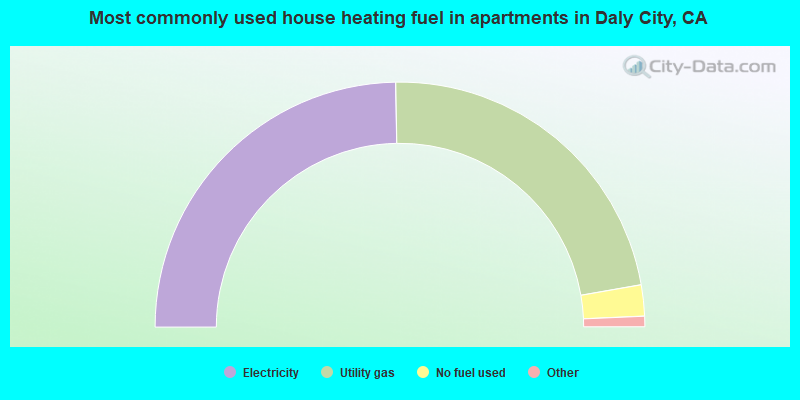
- 49.5%Electricity
- 45.1%Utility gas
- 4.1%No fuel used
- 1.2%Bottled, tank, or LP gas
- 0.2%Other fuel
Private vs. public school enrollment:
| Here: | 24.7% |
| California: | 10.5% |
| Here: | 7.5% |
| California: | 8.5% |
| Here: | 13.3% |
| California: | 15.9% |


