Danbury, CT (Connecticut) Houses and Residents
| Danbury: | $417,100 |
| Connecticut: | $347,200 |
Mean price in 2022:
Detached houses: $442,058
Here: $442,058 State: $503,946 Townhouses or other attached units: $384,742
Here: $384,742 State: $304,959 In 2-unit structures: $360,137
Here: $360,137 State: $304,133 In 3-to-4-unit structures: $238,738
Here: $238,738 State: $272,970 In 5-or-more-unit structures: $315,255
Here: $315,255 State: $249,308 Mobile homes: $51,020
Here: $51,020 State: $151,361
Total population: 83,784 (Urban population: 72,068, Rural population: 2,780 (all nonfarm))
Houses: 31,578 (30,238 occupied: 17,725 owner occupied, 12,513 renter occupied)
| % of renters here: | 41% |
| State: | 34% |
Housing density: 750 houses/condos per square mile
Median price asked for vacant for-sale houses and condos in 2022: $319,725.
Median contract rent in 2022: $1,546 (lower quartile is $1,108, upper quartile is $1,852)
Median rent asked for vacant for-rent units in 2022: $1,477
Median gross rent in Danbury, CT in 2022: $1,788
Housing units in Danbury with a mortgage: 12,781 (1,674 second mortgage, 218 home equity loan, 1,246 both second mortgage and home equity loan)
Houses without a mortgage: 664
Median household income for houses/condos with a mortgage: $120,096
Median household income for apartments without a mortgage: $108,432
Median monthly housing costs: $1,883
Compare current foreclosures in Danbury, CT:
| Photo | Address | Area | Beds / Baths | Price | Details |
|---|---|---|---|---|---|

|
#1
Highland Park Dr
Danbury, CT 06811
|
875 sq. feet
|
2 baths 2 beds |
$460,000
|
show details |

|
#2
Abbott Ave
Danbury, CT 06810
|
1,401 sq. feet
|
1 baths 3 beds |
$499,900
|
show details |

|
#3
Hospital Ave
Danbury, CT 06810
|
1,589 sq. feet
|
2 baths 3 beds |
show details | |

|
#4
Kevin Dr
Danbury, CT 06811
|
1,854 sq. feet
|
3 baths 3 beds |
show details | |

|
#5
Deer Park Rd
Danbury, CT 06811
|
3,885 sq. feet
|
4 baths 4 beds |
show details | |

|
#6
Rose Ln Apt 22-14
Danbury, CT 06811
|
1,025 sq. feet
|
1 baths 2 beds |
show details | |

|
#7
Patricia Ln
Danbury, CT 06811
|
1,515 sq. feet
|
1 baths 3 beds |
show details | |

|
#8
James St
Danbury, CT 06810
|
1,464 sq. feet
|
1 baths 4 beds |
show details | |

|
#9
E Pearl St
Danbury, CT 06810
|
1,428 sq. feet
|
1 baths 4 beds |
show details | |

|
#10
Benedict Ave # B
Danbury, CT 06810
|
1,680 sq. feet
|
2 baths 3 beds |
show details |
| Photo | Address | Area | Beds / Baths | Price | Details |
|---|---|---|---|---|---|

|
#11
Benedict Ave
Danbury, CT Array
|
1,680 sq. feet
|
2 baths 3 beds |
show details | |

|
#12
Carla Dr
Danbury, CT 06811
|
3,333 sq. feet
|
3 baths 4 beds |
show details | |

|
#13
Abbott Ave # A2
Danbury, CT 06810
|
1,802 sq. feet
|
2 baths 3 beds |
show details | |

|
#14
Ball Pond Rd
Danbury, CT 06811
|
1,735 sq. feet
|
1 baths 3 beds |
show details | |

|
#15
Prospect St
Danbury, CT 06810
|
2,202 sq. feet
|
2 baths 6 beds |
show details | |

|
#16
East Dr
Danbury, CT 06810
|
1,639 sq. feet
|
1 baths 3 beds |
show details | |

|
#17
Beech St
Danbury, CT 06810
|
1,613 sq. feet
|
1 baths 3 beds |
show details | |

|
#18
Michaud Rd
Danbury, CT 06810
|
1,416 sq. feet
|
1 baths 3 beds |
show details | |

|
#19
Hayestown Rd
Danbury, CT 06811
|
1,336 sq. feet
|
1 baths 4 beds |
show details | |

|
#20
Golden Heights Rd
Danbury, CT 06811
|
2,608 sq. feet
|
2 baths 4 beds |
show details |
| Photo | Address | Area | Beds / Baths | Price | Details |
|---|---|---|---|---|---|

|
#21
Juniper Ridge Dr
Danbury, CT 06811
|
1,488 sq. feet
|
1 baths 3 beds |
show details | |

|
#22
Briar Woods Ln
Danbury, CT 06810
|
1,749 sq. feet
|
2 baths 2 beds |
show details | |

|
#23
Oak Ridge Ave
Danbury, CT 06810
|
2,504 sq. feet
|
3 baths 5 beds |
show details | |

|
#24
Pearl St
Danbury, CT 06810
|
2,790 sq. feet
|
2 baths 6 beds |
show details | |

|
#25
Rowan St
Danbury, CT 06810
|
1,843 sq. feet
|
2 baths 4 beds |
show details | |

|
#26
Sheridan St Unit 305
Danbury, CT 06810
|
1,445 sq. feet
|
2 baths 2 beds |
show details | |

|
#27
Fairmount Dr
Danbury, CT 06811
|
3,439 sq. feet
|
3 baths 5 beds |
show details | |

|
#28
Victor St
Danbury, CT 06810
|
3,332 sq. feet
|
4 baths 7 beds |
show details | |

|
#29
Highland Ave
Danbury, CT 06810
|
2,592 sq. feet
|
2 baths 6 beds |
show details | |

|
#30
Spruce Mountain Rd
Danbury, CT 06810
|
2,289 sq. feet
|
2 baths 4 beds |
show details |
| Photo | Address | Area | Beds / Baths | Price | Details |
|---|---|---|---|---|---|

|
#31
Starr Ave
Danbury, CT 06810
|
1,928 sq. feet
|
2 baths 7 beds |
show details | |

|
#32
Newtown Rd
Danbury, CT 06810
|
- sq. feet
|
- baths - beds |
show details | |

|
#33
Tamarack Ave Apt 121
Danbury, CT 06811
|
- sq. feet
|
- baths - beds |
show details | |

|
#34
Dean St Unit 304
Danbury, CT 06810
|
- sq. feet
|
- baths - beds |
show details | |

|
#35
Clapboard Ridge Rd Apt 32l
Danbury, CT 06811
|
- sq. feet
|
- baths - beds |
show details | |

|
#36
Rose Ln # 10
Danbury, CT 06811
|
- sq. feet
|
- baths - beds |
show details | |

|
#37
Main St Apt 416
Danbury, CT 06810
|
- sq. feet
|
- baths - beds |
show details | |

|
#38
Grand St # A
Danbury, CT 06810
|
- sq. feet
|
- baths - beds |
show details | |

|
#39
Main St # 507
Danbury, CT 06810
|
- sq. feet
|
- baths - beds |
show details | |

|
#40
Liberty St
Danbury, CT 06810
|
- sq. feet
|
- baths - beds |
show details |
| Photo | Address | Area | Beds / Baths | Price | Details |
|---|---|---|---|---|---|

|
#41
Bayberry Ln
Danbury, CT 06811
|
- sq. feet
|
- baths - beds |
show details | |

|
#42
Memorial Dr
Danbury, CT 06810
|
- sq. feet
|
- baths - beds |
show details | |

|
#43
1/2 Pembroke Rd, # 84470510
Danbury, CT 06811
|
- sq. feet
|
- baths - beds |
show details | |

|
#44
Newtown Rd
Danbury, CT 06810
|
- sq. feet
|
- baths - beds |
show details | |

|
Check over 1 million property listings on Foreclosure.com!
|
browse all offers | |||

Latest news about housing in Danbury, CT collected exclusively by city-data.com from local newspapers, TV, and radio stations


Median year apartment built: 1981
Household type by relationship:
Households: 86,971- Male householders: 14,295 (3,319 living alone), Female householders: 15,943 (3,525 living alone)
14,804 spouses (14,657 opposite-sex spouses), 2,013 unmarried partners, (1,915 opposite-sex unmarried partners), 27,501 children (26,420 natural, 106 adopted, 975 stepchildren), 2,755 grandchildren, 936 brothers or sisters, 1,014 parents, 149 foster children, 1,654 other relatives, 2,964 non-relatives
- In group quarters: 2,943
Size of family households: 8,258 2-persons, 4,476 3-persons, 4,936 4-persons, 2,146 5-persons, 922 6-persons, 699 7-or-more-persons.
Size of nonfamily households: 6,844 1-person, 1,308 2-persons, 577 3-persons, 72 5-persons.
9,902 married couples with children.
4,784 single-parent households (1,201 men, 3,583 women).
54.8% of residents of Danbury speak English at home.
27.2% of residents speak Spanish at home (47% speak English very well, 25% speak English well, 17% speak English not well, 11% don't speak English at all).
14.1% of residents speak other Indo-European language at home (58% speak English very well, 22% speak English well, 11% speak English not well, 8% don't speak English at all).
2.6% of residents speak Asian or Pacific Island language at home (65% speak English very well, 19% speak English well, 14% speak English not well, 2% don't speak English at all).
1.8% of residents speak other language at home (92% speak English very well, 7% speak English well, 1% speak English not well).
Foreign born population: 28,371 (32.6%)
(42.5% of them are naturalized citizens)
| Here: | 6.7 |
| State: | 6.5 |
| Here: | 4.3 |
| State: | 4.0 |

- Bedrooms in owner-occupied houses and condos in Danbury, Connecticut
- 454no bedroom
- 3901 bedroom
- 4,3712 bedrooms
- 7,5893 bedrooms
- 3,4684 bedrooms
- 1,4535+ bedrooms

- Bedrooms in renter-occupied apartments in Danbury, Connecticut
- 392no bedroom
- 2,7691 bedroom
- 5,7492 bedrooms
- 3,0543 bedrooms
- 5494 bedrooms
- 05+ bedrooms

- Cars and other vehicles available in Danbury in owner-occupied houses/condos
- 326no vehicle
- 3,8501 vehicle
- 7,5672 vehicles
- 3,3393 vehicles
- 2,3274 vehicles
- 3165+ vehicles

- Cars and other vehicles available in Danbury in renter-occupied apartments
- 2,490no vehicle
- 3,9321 vehicle
- 4,7982 vehicles
- 1,2233 vehicles
- 04 vehicles
- 705+ vehicles

- Rooms in owner-occupied houses in Danbury, Connecticut
- 821 room
- 662 rooms
- 1,0683 rooms
- 2,4004 rooms
- 1,8825 rooms
- 2,9316 rooms
- 2,6527 rooms
- 2,9498 rooms
- 3,6959+ rooms

- Rooms in renter-occupied apartments in Danbury, Connecticut
- 3921 room
- 7352 rooms
- 2,7153 rooms
- 2,9904 rooms
- 3,1095 rooms
- 1,4186 rooms
- 8407 rooms
- 08 rooms
- 3149+ rooms


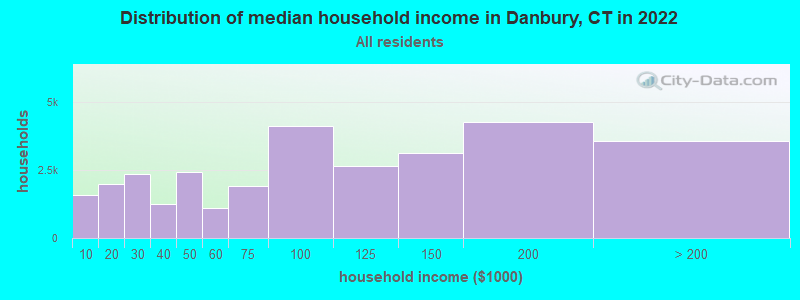
Danbury, CT household income distribution

- 1,566Less than $10,000
- 1,979$10,000 to $19,999
- 2,355$20,000 to $29,999
- 1,228$30,000 to $39,999
- 2,404$40,000 to $49,999
- 1,103$50,000 to $59,999
- 1,908$60,000 to $74,999
- 4,121$75,000 to $99,999
- 2,656$100,000 to $124,999
- 3,103$125,000 to $149,999
- 4,252$150,000 to $199,999
- 3,563$200,000 or more
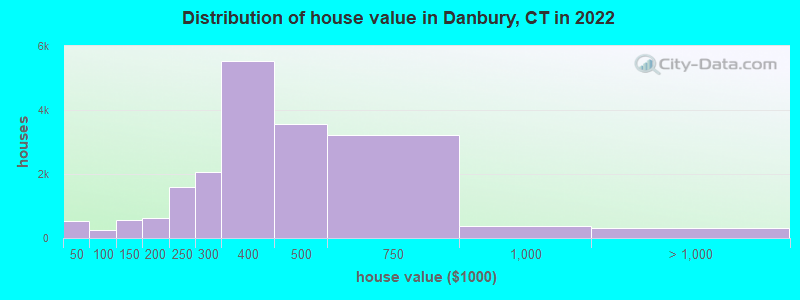
Home value of owner - occupied houses in 2022 in Danbury, CT
-
- 253Less than $10,000
- 99$10,000 to $14,999
- 18$15,000 to $19,999
- 36$20,000 to $24,999
- 41$25,000 to $29,999
- 26$30,000 to $34,999
- 42$35,000 to $39,999
- 10$40,000 to $49,999
- 37$50,000 to $59,999
- 39$60,000 to $69,999
- 26$70,000 to $79,999
- 76$80,000 to $89,999
- 65$90,000 to $99,999
- 426$100,000 to $124,999
- 141$125,000 to $149,999
- 303$150,000 to $174,999
- 333$175,000 to $199,999
- 1,608$200,000 to $249,999
- 2,062$250,000 to $299,999
- 5,528$300,000 to $399,999
- 3,564$400,000 to $499,999
- 3,224$500,000 to $749,999
- 374$750,000 to $999,999
- 219$1,000,000 to $1,499,999
- 62$1,500,000 to $1,999,999
- 45$2,000,000 or more
Rent paid by renters in 2022 in Danbury, CT
-
- 62Less than $100
- 82$100 to $149
- 151$150 to $199
- 27$200 to $249
- 79$250 to $299
- 285$300 to $349
- 67$350 to $399
- 290$400 to $449
- 198$450 to $499
- 93$500 to $549
- 59$550 to $599
- 177$600 to $649
- 86$650 to $699
- 272$700 to $749
- 213$750 to $799
- 506$800 to $899
- 355$900 to $999
- 1,958$1,000 to $1,249
- 2,161$1,250 to $1,499
- 4,242$1,500 to $1,999
- 1,374$2,000 to $2,499
- 600$2,500 to $2,999
- 84$3,000 to $3,499
- 124$3,500 or more
- 537No cash rent

Percentage of workers working in this county: 77.5%
Number of people working at home: 5,920 (12.9% of all workers)
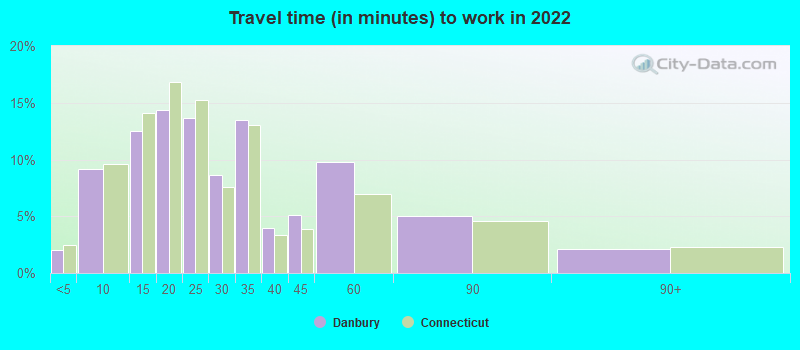
Travel time to work (commute)
- Less than 5 minutes: 696
- 5 to 9 minutes: 3,278
- 10 to 14 minutes: 6,367
- 15 to 19 minutes: 6,590
- 20 to 24 minutes: 3,685
- 25 to 29 minutes: 2,830
- 30 to 34 minutes: 5,275
- 35 to 39 minutes: 491
- 40 to 44 minutes: 2,582
- 45 to 59 minutes: 3,152
- 60 to 89 minutes: 2,986
- 90 or more minutes: 1,235
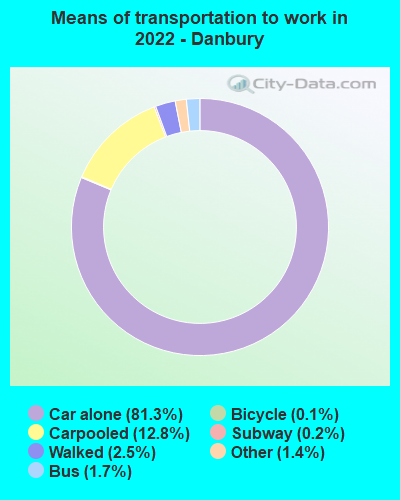
Means of transportation to work:
- Drove a car alone: 36,228 (73.0%)
- Carpooled: 5,705 (11.5%)
- Bus: 769 (1.6%)
- Long-distance train or commuter rail: 69 (0.1%)
- Taxi: 619 (1.2%)
- Bicycle: 65 (0.1%)
- Walked: 1,127 (2.3%)
- Worked at home: 5,018 (10.1%)
- Unemployment by race in 2022
- Unemployment rate for White non-Hispanic residents
- 2.6%Males
- 3.7%Females
- Unemployment rate for Black residents
- 16.6%Males
- 3.5%Females
- Unemployment rate for American Indian and Alaska Native residents
- 8.1%Males
- Unemployment rate for Asian residents
- 5.7%Males
- Unemployment rate for other race residents
- 3.1%Males
- 2.0%Females
- Unemployment rate for two or more race residents
- 4.6%Males
- 13.5%Females
- Unemployment rate for Hispanic or Latino residents
- 4.3%Males
- 4.3%Females

- Year of entry for the foreign-born population in Danbury, Connecticut
- 10,3832010 or later
- 8,9682000 to 2009
- 5,7021990 to 1999
- 5,0061980 to 1989
- 2,0461970 to 1979
- 2,216Before 1970

First ancestries reported:
- Brazilian: 3,949 (8.6%)
- Italian: 3,573 (7.8%)
- Irish: 1,936 (4.2%)
- Portuguese: 1,739 (3.8%)
- German: 1,472 (3.2%)
- American: 1,361 (3.0%)
- Jamaican: 1,176 (2.6%)
- English: 677 (1.5%)
- Polish: 672 (1.5%)
- Ghanaian: 601 (1.3%)
- Lebanese: 555 (1.2%)
- Ugandan: 491 (1.1%)
- European: 461 (1.0%)
- Russian: 321 (0.7%)
- Guyanese: 270 (0.6%)
- Czechoslovakian: 246 (0.5%)
- Macedonian: 240 (0.5%)
- Scottish: 235 (0.5%)
- Hungarian: 226 (0.5%)
- African: 219 (0.5%)
- Latvian: 208 (0.5%)
- Greek: 187 (0.4%)
- French Canadian: 173 (0.4%)
- Haitian: 153 (0.3%)
- Slovak: 148 (0.3%)
- Ukrainian: 146 (0.3%)
- West Indian: 122 (0.3%)
- Swedish: 118 (0.3%)
- South African: 109 (0.2%)
- Norwegian: 99 (0.2%)
- Armenian: 98 (0.2%)
- Eastern European: 93 (0.2%)
- Syrian: 72 (0.2%)
- Slavic: 71 (0.2%)
- Welsh: 67 (0.1%)
- Cape Verdean: 61 (0.1%)
- Austrian: 61 (0.1%)
- British: 57 (0.1%)
- Scotch-Irish: 54 (0.1%)
- Barbadian: 54 (0.1%)
- Croatian: 53 (0.1%)
- French: 52 (0.1%)
- Bulgarian: 48 (0.1%)
- Australian: 46 (0.1%)
- Danish: 33 (0.07%)
- Palestinian: 33 (0.07%)
- Canadian: 32 (0.07%)
- Lithuanian: 29 (0.06%)
- Nigerian: 26 (0.06%)
- Swiss: 23 (0.05%)
- Serbian: 20 (0.04%)
- British West Indian: 20 (0.04%)
- Northern European: 18 (0.04%)
- Dutch: 18 (0.04%)
- Trinidadian and Tobagonian: 16 (0.03%)
- Scandinavian: 14 (0.03%)
- Pennsylvania German: 12 (0.03%)
- Czech: 11 (0.02%)
- Belizean: 10 (0.02%)
- Romanian: 9 (0.02%)
- Arab: 5 (0.01%)
- Carpatho Rusyn: 5 (0.01%)
- Iranian: 3 (0.01%)
- Afghan: 3 (0.01%)
Most common places of birth for foreign-born residents (%):
| Danbury: | 23.0% (6,809) |
| Connecticut: | 4.4% (24,026) |
| Danbury: | 17.5% (5,170) |
| Connecticut: | 4.7% (25,461) |
| Danbury: | 14.0% (4,146) |
| Connecticut: | 5.0% (27,361) |
| Danbury: | 6.7% (1,983) |
| Connecticut: | 4.8% (25,802) |
| Danbury: | 4.1% (1,199) |
| Connecticut: | 3.2% (17,617) |
| Danbury: | 3.8% (1,111) |
| Connecticut: | 7.5% (40,568) |
| Danbury: | 3.4% (1,011) |
| Connecticut: | 1.7% (9,214) |
| Danbury: | 2.9% (851) |
| Connecticut: | 7.3% (39,879) |
| Danbury: | 1.8% (532) |
| Connecticut: | 1.9% (10,545) |
| Danbury: | 1.6% (473) |
| Connecticut: | 2.5% (13,591) |
Place of birth for U.S.-born residents:
- This state: 34,589
- Other state: 21,612
- Northeast: 17,276
- Midwest: 856
- South: 2,071
- West: 1,409
85.2% of Danbury residents lived in the same house 1 years ago.
Out of people who lived in different houses, 35.1% lived in this county.
Out of people who lived in different counties, 26.6% lived in Connecticut.
| Danbury: | 85.2% |
| State average: | 88.4% |
Education attainment for males 25 years and older:
- No schooling: 1,301
- Nursery to 4th grade: 674
- 5th and 6th grade: 671
- 7th and 8th grade: 218
- 9th grade: 131
- 10th grade: 425
- 11th grade: 1,285
- 12th grade, no diploma: 870
- High school graduate (or equivalency): 8,080
- Less than 1 year of college: 1,631
- Some college more than 1 year, no degree: 2,306
- Associate degree: 1,620
- Bachelor's degree: 6,955
- Master's degree: 1,711
- Professional school degree: 697
- Doctorate degree: 55

Education attainment for females 25 years and older:
- No schooling: 661
- Nursery to 4th grade: 988
- 5th and 6th grade: 555
- 7th and 8th grade: 189
- 9th grade: 428
- 10th grade: 310
- 11th grade: 1,155
- 12th grade, no diploma: 722
- High school graduate (or equivalency): 5,129
- Less than 1 year of college: 1,543
- Some college more than 1 year, no degree: 1,940
- Associate degree: 3,302
- Bachelor's degree: 7,176
- Master's degree: 3,643
- Professional school degree: 922
- Doctorate degree: 298


Housing units in structures:
- One, detached: 14,296
- One, attached: 4,054
- Two: 2,649
- 3 or 4: 2,938
- 5 to 9: 1,281
- 10 to 19: 1,043
- 20 to 49: 2,491
- 50 or more: 2,327
- Mobile homes: 499
Median worth of mobile homes: $46,200
Housing units lacking complete kitchen facilities in 2022: 0.2%
House/condo owner moved in on average 14 years ago
Renter moved in on average 4 years ago

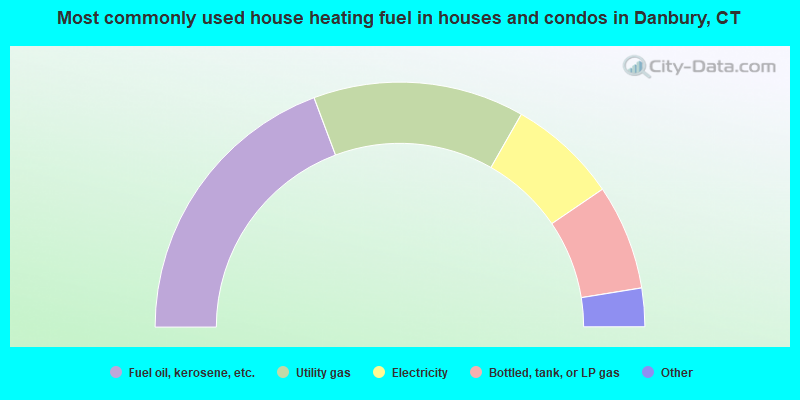
- 38.6%Fuel oil, kerosene, etc.
- 27.9%Utility gas
- 14.5%Electricity
- 13.9%Bottled, tank, or LP gas
- 2.4%Wood
- 1.5%Other fuel
- 0.5%Coal or coke
- 0.4%No fuel used
- 0.3%Solar energy
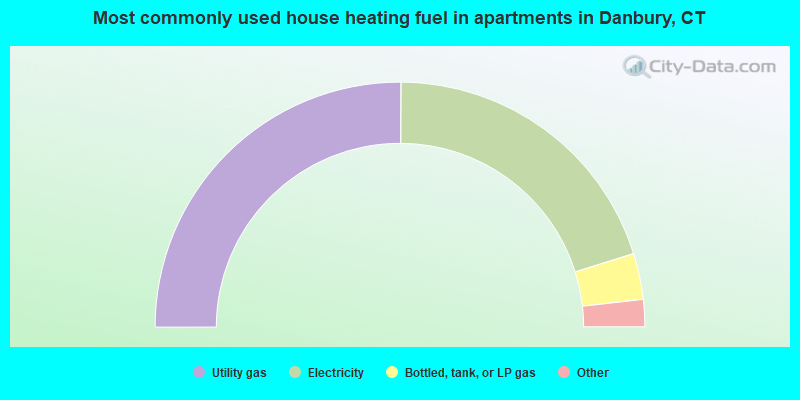
- 50.2%Utility gas
- 40.2%Electricity
- 6.1%Bottled, tank, or LP gas
- 3.0%Fuel oil, kerosene, etc.
- 0.6%Other fuel
Private vs. public school enrollment:
| Here: | 7.2% |
| Connecticut: | 9.5% |
| Here: | 3.0% |
| Connecticut: | 12.9% |
| Here: | 21.8% |
| Connecticut: | 35.5% |


