Jump to a detailed profile or search site with Google Custom Search

Danville, CA (California) Houses and Residents

Estimated median house or condo value in 2022: $1,622,729 (it was $537,000 in 2000)
Danville:

$1,622,729
California:

$715,900
Lower value quartile - upper value quartile: $1,210,691 - $2,103,904

Total population: 43,909 (Urban population: 42,046, Rural population: 81 (all nonfarm))

Houses: 16,454 (15,948 occupied: 13,881 owner occupied, 2,100 renter occupied)

% of renters here:

13%
State:

44%

Housing density: 909 houses/condos per square mile

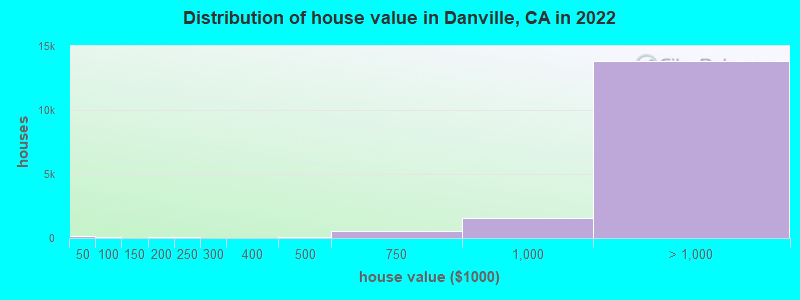
Median price asked for vacant for-sale houses and condos in 2022: $477,275.

Median contract rent in 2022: over $2,000 (lower quartile is over $2,000, upper quartile is over $2,000)


Median rent asked for vacant for-rent units in 2022: $2,927


Median gross rent in Danville, CA in 2022: over $2,000

Housing units in Danville with a mortgage: 11,151 (2,032 second mortgage, 140 home equity loan, 1,772 both second mortgage and home equity loan)
Houses without a mortgage: 150

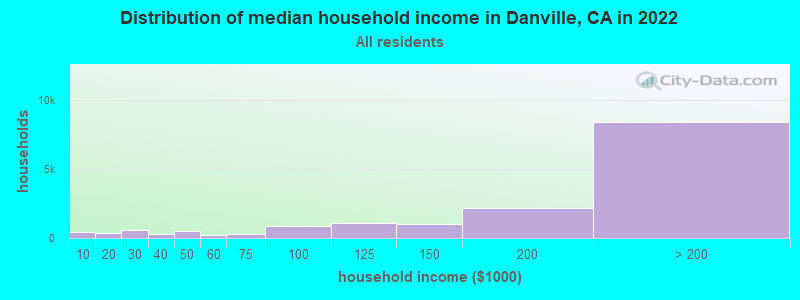
Median household income for houses/condos with a mortgage: $252,501

Median household income for apartments without a mortgage: $138,636

Median monthly housing costs: $3,944

Compare current foreclosures in Danville, CA:

Check out more offers in Danville, CA.
Powered by Foreclosure.com

Settings
X
Data:
Loading data...
Based on 2000-2022 data
Loading data...

123
Hide US histogram

Latest news about housing in Danville, CA collected exclusively by city-data.com from local newspapers, TV, and radio stations

Danville, California Age and Sex of Residents
Median year house/condo built: 1979

Median year apartment built: 1980

Household type by relationship:

Households: 43,236
  • Male householders: 8,470 (1,398 living alone), Female householders: 7,178 (1,481 living alone)
  • 10,525 spouses (10,488 opposite-sex spouses), 545 unmarried partners, (545 opposite-sex unmarried partners), 14,453 children (14,135 natural, 233 adopted, 83 stepchildren), 153 grandchildren, 145 brothers or sisters, 428 parents, 0 foster children, 253 other relatives, 817 non-relatives
  • In group quarters: 264

Size of family households: 5,164 2-persons, 2,484 3-persons, 3,047 4-persons, 1,279 5-persons, 289 6-persons, 68 7-or-more-persons.

Size of nonfamily households: 2,913 1-person, 588 2-persons, 38 3-persons, 66 4-persons.

8,961 married couples with children.
1,395 single-parent households (184 men, 1,211 women).

80.1% of residents of Danville speak English at home.
2.6% of residents speak Spanish at home (84% speak English very well, 14% speak English well, 2% speak English not well).
6.7% of residents speak other Indo-European language at home (80% speak English very well, 15% speak English well, 5% speak English not well).
9.6% of residents speak Asian or Pacific Island language at home (66% speak English very well, 24% speak English well, 9% speak English not well, 1% don't speak English at all).
0.2% of residents speak other language at home (100% speak English very well).

Foreign born population: 7,888 (18.2%)
(72.1% of them are naturalized citizens)

Median number of rooms in houses and condos:
Here:

7.4
State:

6.0

Median number of rooms in apartments
Here:

5.2
State:

3.9

Owner-occupied Renter-occupied
Bedrooms in owner-occupied houses and condos in Danville, California
  • Bedrooms in owner-occupied houses and condos in Danville, California
  • 7no bedroom
  • 151 bedroom
  • 1,2412 bedrooms
  • 4,0303 bedrooms
  • 6,4644 bedrooms
  • 2,1255+ bedrooms
Bedrooms in renter-occupied apartments in Danville, California
  • Bedrooms in renter-occupied apartments in Danville, California
  • 131no bedroom
  • 2341 bedroom
  • 5282 bedrooms
  • 7853 bedrooms
  • 3874 bedrooms
  • 365+ bedrooms
Owner-occupied Renter-occupied
Cars and other vehicles available in Danville in owner-occupied houses/condos
  • Cars and other vehicles available in Danville in owner-occupied houses/condos
  • 192no vehicle
  • 2,4971 vehicle
  • 6,3002 vehicles
  • 3,4443 vehicles
  • 1,0864 vehicles
  • 3625+ vehicles
Cars and other vehicles available in Danville in renter-occupied apartments
  • Cars and other vehicles available in Danville in renter-occupied apartments
  • 212no vehicle
  • 6941 vehicle
  • 9352 vehicles
  • 1983 vehicles
  • 614 vehicles
  • 05+ vehicles
Owner-occupied Renter-occupied
Rooms in owner-occupied houses in Danville, California
  • Rooms in owner-occupied houses in Danville, California
  • 01 room
  • 02 rooms
  • 2743 rooms
  • 7104 rooms
  • 1,6005 rooms
  • 2,0996 rooms
  • 2,4807 rooms
  • 2,6468 rooms
  • 4,0729+ rooms
Rooms in renter-occupied apartments in Danville, California
  • Rooms in renter-occupied apartments in Danville, California
  • 1311 room
  • 792 rooms
  • 2153 rooms
  • 3884 rooms
  • 3315 rooms
  • 4486 rooms
  • 1787 rooms
  • 2008 rooms
  • 1299+ rooms
Year house built
Median 2022 house/condo value by year built
Median house/condo value by year householder moved into unit
Breakdown of mean house values by ages of householders
Owners and renters by unit type in Danville, CA
  • Danville, CA household income distribution

  • Distribution of median household income in Danville, CA in 2022
  • 426Less than $10,000
  • 336$10,000 to $19,999
  • 588$20,000 to $29,999
  • 287$30,000 to $39,999
  • 494$40,000 to $49,999
  • 198$50,000 to $59,999
  • 291$60,000 to $74,999
  • 896$75,000 to $99,999
  • 1,077$100,000 to $124,999
  • 994$125,000 to $149,999
  • 2,148$150,000 to $199,999
  • 8,385$200,000 or more
  • Home value of owner - occupied houses in 2022 in Danville, CA

  • Distribution of house value in Danville, CA in 2022
  • 128Less than $10,000
  • 9$15,000 to $19,999
  • 12$20,000 to $24,999
  • 30$80,000 to $89,999
  • 17$90,000 to $99,999
  • 15$100,000 to $124,999
  • 52$150,000 to $174,999
  • 5$175,000 to $199,999
  • 77$200,000 to $249,999
  • 7$250,000 to $299,999
  • 34$300,000 to $399,999
  • 49$400,000 to $499,999
  • 554$500,000 to $749,999
  • 1,579$750,000 to $999,999
  • 4,737$1,000,000 to $1,499,999
  • 4,043$1,500,000 to $1,999,999
  • 5,063$2,000,000 or more
  • Rent paid by renters in 2022 in Danville, CA

  • Distribution of rent paid by renters in Danville, CA in 2022
  • 92$1,000 to $1,249
  • 45$1,250 to $1,499
  • 115$1,500 to $1,999
  • 242$2,000 to $2,499
  • 272$2,500 to $2,999
  • 203$3,000 to $3,499
  • 928$3,500 or more
  • 132No cash rent
Time Leaving Home To Go To Work in 2022

Percentage of workers working in this county: 74.6%
Number of people working at home: 7,483 (37.3% of all workers)

Travel time (in minutes) to work in 2022

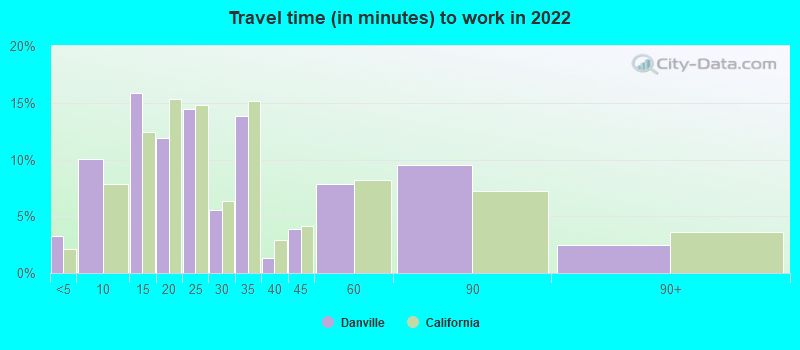
Travel time to work (commute)

  • Less than 5 minutes: 289
  • 5 to 9 minutes: 1,371
  • 10 to 14 minutes: 1,798
  • 15 to 19 minutes: 1,907
  • 20 to 24 minutes: 1,686
  • 25 to 29 minutes: 900
  • 30 to 34 minutes: 1,482
  • 35 to 39 minutes: 241
  • 40 to 44 minutes: 501
  • 45 to 59 minutes: 1,600
  • 60 to 89 minutes: 1,052
  • 90 or more minutes: 606
Means of transportation to work in 2022 - Danville

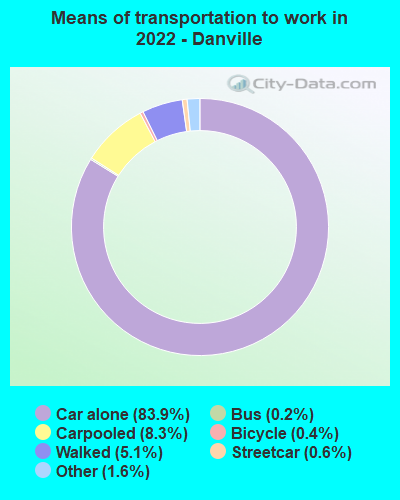
Means of transportation to work:

  • Drove a car alone: 9,339 (51.0%)
  • Carpooled: 1,035 (5.7%)
  • Bus: 13 (0.1%)
  • Subway or elevated rail: 41 (0.2%)
  • Taxi: 187 (1.0%)
  • Bicycle: 34 (0.2%)
  • Walked: 810 (4.4%)
  • Worked at home: 7,483 (40.9%)
Class of Workers in 2022
  • Unemployment by race in 2022
  • Unemployment rate for White non-Hispanic residents
  • 3.7%Males
  • 4.0%Females
  • Unemployment rate for Black residents
  • 3.2%Males
  • 1.0%Females
  • Unemployment rate for Asian residents
  • 0.6%Males
  • 10.7%Females
  • Unemployment rate for two or more race residents
  • 12.9%Females
  • Unemployment rate for Hispanic or Latino residents
  • 2.0%Females
Year of entry for the foreign-born population in Danville, California
  • Year of entry for the foreign-born population in Danville, California
  • 1,9212010 or later
  • 1,4192000 to 2009
  • 1,4241990 to 1999
  • 1,1131980 to 1989
  • 9491970 to 1979
  • 1,324Before 1970
Ancestries in Danville, CA

First ancestries reported:

  • German: 1,569 (7.3%)
  • Italian: 1,535 (7.1%)
  • English: 1,391 (6.4%)
  • Irish: 1,328 (6.2%)
  • American: 1,101 (5.1%)
  • European: 818 (3.8%)
  • Polish: 814 (3.8%)
  • Scottish: 526 (2.4%)
  • Iranian: 371 (1.7%)
  • French: 283 (1.3%)
  • Scotch-Irish: 275 (1.3%)
  • Portuguese: 220 (1.0%)
  • French Canadian: 208 (1.0%)
  • Norwegian: 178 (0.8%)
  • Dutch: 164 (0.8%)
  • British: 164 (0.8%)
  • Scandinavian: 151 (0.7%)
  • Russian: 145 (0.7%)
  • Brazilian: 144 (0.7%)
  • Israeli: 143 (0.7%)
  • Swedish: 125 (0.6%)
  • Austrian: 88 (0.4%)
  • Danish: 83 (0.4%)
  • Greek: 75 (0.3%)
  • Swiss: 74 (0.3%)
  • Ukrainian: 74 (0.3%)
  • Czech: 67 (0.3%)
  • Belgian: 58 (0.3%)
  • Northern European: 57 (0.3%)
  • Eastern European: 54 (0.3%)
  • Bulgarian: 42 (0.2%)
  • Armenian: 36 (0.2%)
  • Jamaican: 35 (0.2%)
  • Basque: 34 (0.2%)
  • Finnish: 30 (0.1%)
  • Turkish: 28 (0.1%)
  • Nigerian: 26 (0.1%)
  • Lebanese: 25 (0.1%)
  • Hungarian: 23 (0.1%)
  • Slovak: 16 (0.07%)
  • Lithuanian: 15 (0.07%)
  • Assyrian: 13 (0.06%)
  • Canadian: 13 (0.06%)
  • Egyptian: 9 (0.04%)
  • Celtic: 9 (0.04%)
  • Romanian: 8 (0.04%)
  • Australian: 5 (0.02%)

Most common places of birth for foreign-born residents (%):

India
Danville:

13.9% (1,033)
California:

5.2% (539,184)

China, excluding Hong Kong and Taiwan
Danville:

11.7% (872)
California:

6.6% (684,672)

Korea
Danville:

9.8% (728)
California:

3.0% (315,248)

Philippines
Danville:

9.5% (709)
California:

7.8% (818,297)

Taiwan
Danville:

5.7% (428)
California:

1.7% (176,274)

United Kingdom, excluding England and Scotland
Danville:

5.2% (389)
California:

0.6% (60,582)

Canada
Danville:

4.3% (319)
California:

1.2% (127,477)

Poland
Danville:

4.0% (297)
California:

0.2% (20,997)

Iran
Danville:

3.8% (284)
California:

2.0% (206,004)

Mexico
Danville:

3.3% (245)
California:

37.2% (3,881,193)

Pakistan
Danville:

2.3% (174)
California:

0.5% (49,399)

Brazil
Danville:

2.2% (164)
California:

0.5% (53,222)

Germany
Danville:

2.1% (156)
California:

0.7% (73,304)

Hong Kong
Danville:

2.0% (151)
California:

1.0% (105,215)

Place of birth for U.S.-born residents:

  • This state: 24,122
  • Other state: 10,063
  • Northeast: 3,242
  • Midwest: 2,922
  • South: 2,066
  • West: 1,850

89.0% of Danville residents lived in the same house 1 years ago.
   Out of people who lived in different houses, 32.2% lived in this county.
   Out of people who lived in different counties, 73.1% lived in California.


Danville:

89.0%
State average:

88.9%

Education attainment for males 25 years and older:

  • No schooling: 87
  • Nursery to 4th grade: 0
  • 5th and 6th grade: 3
  • 7th and 8th grade: 0
  • 9th grade: 0
  • 10th grade: 26
  • 11th grade: 30
  • 12th grade, no diploma: 116
  • High school graduate (or equivalency): 1,079
  • Less than 1 year of college: 409
  • Some college more than 1 year, no degree: 1,047
  • Associate degree: 758
  • Bachelor's degree: 6,121
  • Master's degree: 3,235
  • Professional school degree: 866
  • Doctorate degree: 740
Educational Attainment for Males

Education attainment for females 25 years and older:

  • No schooling: 52
  • Nursery to 4th grade: 8
  • 5th and 6th grade: 0
  • 7th and 8th grade: 19
  • 9th grade: 13
  • 10th grade: 12
  • 11th grade: 0
  • 12th grade, no diploma: 95
  • High school graduate (or equivalency): 795
  • Less than 1 year of college: 561
  • Some college more than 1 year, no degree: 1,512
  • Associate degree: 1,213
  • Bachelor's degree: 6,842
  • Master's degree: 2,818
  • Professional school degree: 776
  • Doctorate degree: 373
Educational Attainment for Females
Danville marital status for males
Danville marital status for females

Housing units in structures:

  • One, detached: 12,496
  • One, attached: 2,567
  • Two: 31
  • 3 or 4: 189
  • 5 to 9: 245
  • 10 to 19: 315
  • 20 to 49: 201
  • 50 or more: 406
Housing units lacking complete plumbing facilities in 2022: 0.2%

Housing units lacking complete kitchen facilities in 2022: 1.8%

House/condo owner moved in on average 14 years ago

Renter moved in on average 2 years ago

Year householders moved into residence in Danville
Houses and condos Apartments
Most commonly used house heating fuel in houses and condos in Danville, CA
  • 79.2%Utility gas
  • 16.1%Electricity
  • 2.9%Bottled, tank, or LP gas
  • 1.1%Solar energy
  • 0.4%No fuel used
  • 0.2%Wood
  • 0.2%Other fuel
Most commonly used house heating fuel in apartments in Danville, CA
  • 64.5%Utility gas
  • 31.8%Electricity
  • 2.8%Solar energy
  • 0.8%Bottled, tank, or LP gas

Private vs. public school enrollment:

Students in private schools in grades 1 to 8 (elementary and middle school): 756
Here:

14.9%
California:

10.5%

Students in private schools in grades 9 to 12 (high school): 372
Here:

10.0%
California:

8.5%

Students in private undergraduate colleges: 348
Here:

18.2%
California:

15.9%
School Enrollment by Level of School for Male Students
School Enrollment by Level of School for Female Students
Age and Sex of Sensory-Disabled Noninstitutionalized Residents
Age and Sex of Physically-Disabled Noninstitutionalized Residents
Age and Sex of Mentally-Disabled Noninstitutionalized Residents
Age and Sex of Self-Care Disabled Noninstitutionalized Residents
Age and Sex of Go-Outside-Home Disabled Noninstitutionalized Residents
Age and Sex of Noninstitutionalized Residents with Employment Disability