Danville, GA (Georgia) Houses and Residents
| Danville: | $95,303 |
| Georgia: | $297,400 |
Mean price in 2022:
Detached houses: $137,530
Here: $137,530 State: $376,364 Mobile homes: $41,737
Here: $41,737 State: $102,413
Total population: 219 (Urban population: 0, Rural population: 395 (all nonfarm))
Houses: 142 (64 occupied: 41 owner occupied, 23 renter occupied)
| % of renters here: | 36% |
| State: | 34% |
Housing density: 178 houses/condos per square mile
Median price asked for vacant for-sale houses and condos in 2022: $354,604.
Median contract rent in 2022: $447 (lower quartile is $389, upper quartile is $659)
Median gross rent in Danville, GA in 2022: $709
Housing units in Danville with a mortgage: 3 (1 second mortgage, 0 home equity loan, 0 both second mortgage and home equity loan)
Houses without a mortgage: 0
Median household income for apartments without a mortgage: $72,452
Median monthly housing costs: $493
Compare current foreclosures near Danville, GA:
| Photo | Address | Area | Beds / Baths | Price | Details |
|---|---|---|---|---|---|

|
#1
Fowler Rd
Danville, GA 31017
|
1,768 sq. feet
|
1 baths 3 beds |
show details | |

|
#2
Willis Howell Rd
Danville, GA 31017
|
2,160 sq. feet
|
2 baths - beds |
show details | |

|
#3
Mccue Rd
Danville, GA 31017
|
- sq. feet
|
- baths - beds |
show details | |

|
#4
Maulk Thompson Rd
Jeffersonville, GA 31044
|
1,614 sq. feet
|
3 baths 3 beds |
show details | |

|
#5
Ga Highway 126
Cochran, GA 31014
|
1,612 sq. feet
|
2 baths 3 beds |
show details | |

|
#6
Ga Highway 96 W
Jeffersonville, GA 31044
|
1,264 sq. feet
|
2 baths 3 beds |
show details | |

|
#7
New Bullard Rd
Dry Branch, GA 31020
|
1,088 sq. feet
|
1 baths 3 beds |
show details | |

|
#8
Barrington Dr
Dublin, GA 31021
|
1,608 sq. feet
|
2 baths 3 beds |
show details | |

|
#9
Pullen Ln
Dublin, GA 31021
|
1,344 sq. feet
|
2 baths 3 beds |
show details | |

|
#10
Malgene Drive Rd
Cochran, GA 31014
|
1,008 sq. feet
|
1 baths 2 beds |
show details |
| Photo | Address | Area | Beds / Baths | Price | Details |
|---|---|---|---|---|---|

|
#11
Wriley Rd
Mc Intyre, GA 31054
|
1,656 sq. feet
|
2 baths - beds |
show details | |

|
#12
Shiloh Church Rd
Jeffersonville, GA 31044
|
1,225 sq. feet
|
2 baths - beds |
show details | |

|
#13
Us Highway 80
Jeffersonville, GA 31044
|
1,040 sq. feet
|
1 baths - beds |
show details | |

|
#14
N 7th St
Cochran, GA 31014
|
425 sq. feet
|
2 baths - beds |
show details | |

|
#15
Jackson St
Cochran, GA 31014
|
1,371 sq. feet
|
1 baths - beds |
show details | |

|
#16
Old Macon Rd
Dublin, GA 31021
|
1,425 sq. feet
|
2 baths - beds |
show details | |

|
#17
Ga Highway 57
Irwinton, GA 31042
|
1,588 sq. feet
|
1 baths - beds |
show details | |

|
#18
Hillcrest Dr
Cochran, GA 31014
|
1,755 sq. feet
|
1 baths - beds |
show details | |

|
#19
Lavender Rd
Irwinton, GA 31042
|
1,326 sq. feet
|
1 baths - beds |
show details | |

|
#20
Carver Rd
Irwinton, GA 31042
|
1,375 sq. feet
|
2 baths - beds |
show details |
| Photo | Address | Area | Beds / Baths | Price | Details |
|---|---|---|---|---|---|

|
#21
Chester Cochran Hwy
Cochran, GA 31014
|
876 sq. feet
|
1 baths - beds |
show details | |

|
#22
Maid Marian Ln
Dublin, GA 31021
|
1,856 sq. feet
|
3 baths - beds |
show details | |

|
#23
Tyman Cir
Jeffersonville, GA 31044
|
2,138 sq. feet
|
1 baths - beds |
show details | |

|
#24
Oak St
Dudley, GA 31022
|
1,202 sq. feet
|
1 baths - beds |
show details | |

|
#25
Evergreen Rd
Dublin, GA 31021
|
1,352 sq. feet
|
2 baths - beds |
show details | |

|
#26
Deerwood Trl
Dublin, GA 31021
|
780 sq. feet
|
1 baths - beds |
show details | |

|
#27
Kirkpatrick Rd
Cochran, GA 31014
|
2,298 sq. feet
|
3 baths - beds |
show details | |

|
#28
S 3rd St
Cochran, GA 31014
|
- sq. feet
|
- baths - beds |
show details | |

|
#29
Centerway Dr
Mc Intyre, GA 31054
|
1,248 sq. feet
|
- baths - beds |
show details | |

|
#30
Sunset Ln
Jeffersonville, GA 31044
|
- sq. feet
|
- baths - beds |
show details |
| Photo | Address | Area | Beds / Baths | Price | Details |
|---|---|---|---|---|---|

|
#31
Carrington Hts
Dublin, GA 31021
|
1,344 sq. feet
|
- baths - beds |
show details | |

|
#32
Mcintyre Road
Mc Intyre, GA 31054
|
- sq. feet
|
- baths - beds |
show details | |

|
#33
Eason Hill Church Rd
Montrose, GA 31065
|
- sq. feet
|
- baths - beds |
show details | |

|
#34
Old Toomsboro Rd
Dublin, GA 31021
|
- sq. feet
|
- baths - beds |
show details | |

|
#35
Cauthen Ln Lot 3
Dublin, GA 31021
|
- sq. feet
|
- baths - beds |
show details | |

|
#36
Gregory Ln
Dublin, GA 31021
|
- sq. feet
|
- baths - beds |
show details | |

|
#37
Moore Station Rd
Dublin, GA 31021
|
- sq. feet
|
- baths - beds |
show details | |

|
#38
Pine Cir
Mc Intyre, GA 31054
|
- sq. feet
|
- baths - beds |
show details | |

|
#39
Stewart Rd
Dublin, GA 31021
|
- sq. feet
|
- baths - beds |
show details | |

|
#40
Daniel Estates Dr
Dexter, GA 31019
|
- sq. feet
|
- baths - beds |
show details |
| Photo | Address | Area | Beds / Baths | Price | Details |
|---|---|---|---|---|---|

|
#41
Whipple Hickman Rd
Mc Intyre, GA 31054
|
- sq. feet
|
- baths - beds |
show details | |

|
#42
Mallard Rd
Cochran, GA 31014
|
- sq. feet
|
- baths - beds |
show details | |

|
#43
Carver Rd
Irwinton, GA 31042
|
1,200 sq. feet
|
- baths - beds |
show details | |

|
#44
Ridge Dr
Jeffersonville, GA 31044
|
- sq. feet
|
- baths - beds |
show details | |

|
#45
Wynne St N, Apt 2
Chester, GA 31012
|
- sq. feet
|
- baths - beds |
show details | |

|
#46
Soloman Dr
Jeffersonville, GA 31044
|
- sq. feet
|
- baths - beds |
show details | |

|
#47
King Rd
Jeffersonville, GA 31044
|
- sq. feet
|
- baths - beds |
show details | |

|
#48
Willis Jackson Rd
Dudley, GA 31022
|
1,344 sq. feet
|
- baths - beds |
show details | |

|
#49
Us Highway 80 W
Dudley, GA 31022
|
- sq. feet
|
- baths - beds |
show details | |

|
Check over 1 million property listings on Foreclosure.com!
|
browse all offers | |||

Latest news about housing in Danville, GA collected exclusively by city-data.com from local newspapers, TV, and radio stations

 | Moving from California to Atlanta (64 replies) |
| Eastern Wharf News, Updates and Observations (15 replies) |
| Considering move from SF Bay Area to Atlanta suburbs (18 replies) |
| The Future of Regency Mall (147 replies) |
| Break-ins in Atlanta? A trend (57 replies) |
| Affluent Black Suburbs? (77 replies) |

Median year apartment built: 1979
Household type by relationship:
Households: 189- Male householders: 21 (5 living alone), Female householders: 42 (10 living alone)
21 spouses (21 opposite-sex spouses), 8 unmarried partners, (8 opposite-sex unmarried partners), 28 children (28 natural, 0 adopted, 0 stepchildren), 43 grandchildren, 9 brothers or sisters, 0 parents, 0 foster children, 0 other relatives, 14 non-relatives
Size of family households: 10 2-persons, 11 3-persons, 7 4-persons, 7 5-persons.
Size of nonfamily households: 15 1-person, 13 2-persons.
12 married couples with children.
0 single-parent households (0 men, 0 women).
100.6% of residents of Danville speak English at home.
| Here: | 7.9 |
| State: | 6.8 |
| Here: | 6.2 |
| State: | 4.6 |

- Bedrooms in owner-occupied houses and condos in Danville, Georgia
- 0no bedroom
- 01 bedroom
- 102 bedrooms
- 153 bedrooms
- 44 bedrooms
- 125+ bedrooms

- Bedrooms in renter-occupied apartments in Danville, Georgia
- 0no bedroom
- 21 bedroom
- 32 bedrooms
- 193 bedrooms
- 04 bedrooms
- 05+ bedrooms

- Cars and other vehicles available in Danville in owner-occupied houses/condos
- 6no vehicle
- 281 vehicle
- 62 vehicles
- 03 vehicles
- 04 vehicles
- 15+ vehicles

- Cars and other vehicles available in Danville in renter-occupied apartments
- 8no vehicle
- 111 vehicle
- 42 vehicles
- 03 vehicles
- 04 vehicles
- 05+ vehicles

- Rooms in owner-occupied houses in Danville, Georgia
- 01 room
- 02 rooms
- 03 rooms
- 04 rooms
- 105 rooms
- 16 rooms
- 27 rooms
- 198 rooms
- 99+ rooms

- Rooms in renter-occupied apartments in Danville, Georgia
- 01 room
- 02 rooms
- 23 rooms
- 04 rooms
- 45 rooms
- 86 rooms
- 07 rooms
- 08 rooms
- 99+ rooms


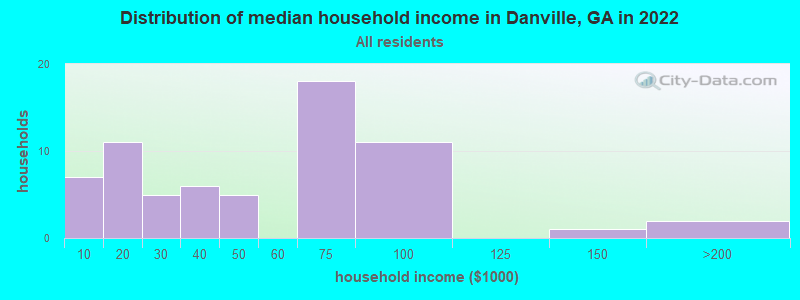
Danville, GA household income distribution

- 7Less than $10,000
- 11$10,000 to $19,999
- 5$20,000 to $29,999
- 6$30,000 to $39,999
- 5$40,000 to $49,999
- 18$60,000 to $74,999
- 11$75,000 to $99,999
- 1$125,000 to $149,999
- 2$150,000 to $199,999
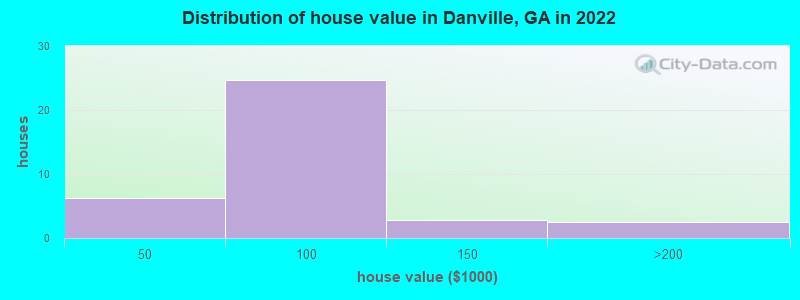
Home value of owner - occupied houses in 2022 in Danville, GA
-
- 6$20,000 to $24,999
- 6$60,000 to $69,999
- 8$70,000 to $79,999
- 9$80,000 to $89,999
- 1$100,000 to $124,999
- 1$125,000 to $149,999
- 2$150,000 to $174,999
Rent paid by renters in 2022 in Danville, GA
-
- 2$200 to $249
- 3$350 to $399
- 7$400 to $449
- 5$600 to $649
- 6No cash rent

Percentage of workers working in this county: 14.0%
Number of people working at home: 0 (0.0% of all workers)
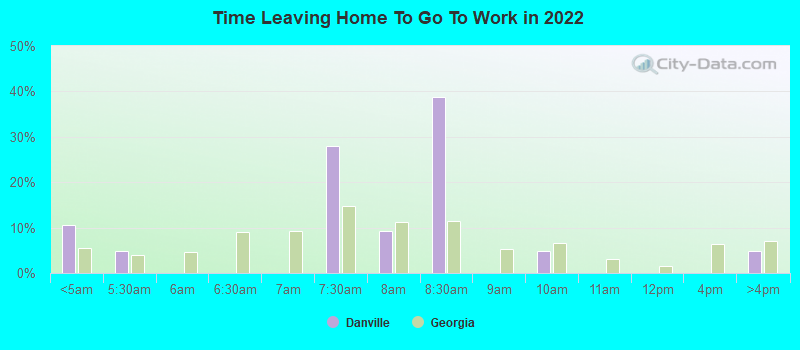
Travel time to work (commute)
- Less than 5 minutes: 0
- 5 to 9 minutes: 4
- 10 to 14 minutes: 3
- 15 to 19 minutes: 0
- 20 to 24 minutes: 0
- 25 to 29 minutes: 1
- 30 to 34 minutes: 5
- 35 to 39 minutes: 14
- 40 to 44 minutes: 1
- 45 to 59 minutes: 10
- 60 to 89 minutes: 0
- 90 or more minutes: 0
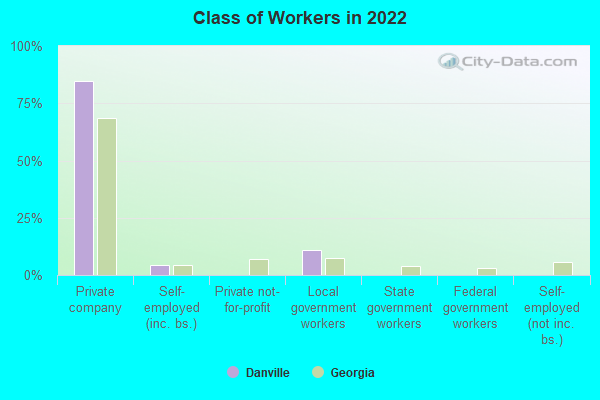
Means of transportation to work:
- Drove a car alone: 87 (69.0%)
- Carpooled: 32 (25.4%)
- Walked: 6 (4.8%)
- Worked at home: 1 (0.8%)

- Year of entry for the foreign-born population in Danville, Georgia
- 01995 to March 2000
- 01990 to 1994
- 01985 to 1989
- 01980 to 1984
- 01975 to 1979
- 01970 to 1974
- 01965 to 1969
- 1Before 1965

First ancestries reported:
- American: 15 (9.3%)
- German: 7 (4.4%)
- Irish: 1 (0.6%)
Place of birth for U.S.-born residents:
- This state: 166
- Other state: 20
- Northeast: 16
- Midwest: 0
- South: 4
- West: 0
94.0% of Danville residents lived in the same house 1 years ago.
Out of people who lived in different houses, 30.0% lived in this county.
Out of people who lived in different counties, 100.0% lived in Georgia.
| Danville: | 94.0% |
| State average: | 86.6% |
Education attainment for males 25 years and older:
- No schooling: 0
- Nursery to 4th grade: 0
- 5th and 6th grade: 0
- 7th and 8th grade: 0
- 9th grade: 0
- 10th grade: 4
- 11th grade: 0
- 12th grade, no diploma: 0
- High school graduate (or equivalency): 38
- Less than 1 year of college: 0
- Some college more than 1 year, no degree: 14
- Associate degree: 6
- Bachelor's degree: 0
- Master's degree: 0
- Professional school degree: 0
- Doctorate degree: 0

Education attainment for females 25 years and older:
- No schooling: 0
- Nursery to 4th grade: 0
- 5th and 6th grade: 0
- 7th and 8th grade: 3
- 9th grade: 4
- 10th grade: 9
- 11th grade: 6
- 12th grade, no diploma: 0
- High school graduate (or equivalency): 17
- Less than 1 year of college: 2
- Some college more than 1 year, no degree: 7
- Associate degree: 6
- Bachelor's degree: 0
- Master's degree: 7
- Professional school degree: 0
- Doctorate degree: 0


Housing units in structures:
- One, detached: 118
- Mobile homes: 23
Housing units lacking complete kitchen facilities in 2022: 25.2%
House/condo owner moved in on average 24 years ago
Renter moved in on average 7 years ago

Private vs. public school enrollment:
| Here: | 0.0% |
| Georgia: | 12.1% |
| Here: | 0.0% |
| Georgia: | 10.8% |
| Here: | 0.0% |
| Georgia: | 17.1% |


