Danville, VA (Virginia) Houses and Residents
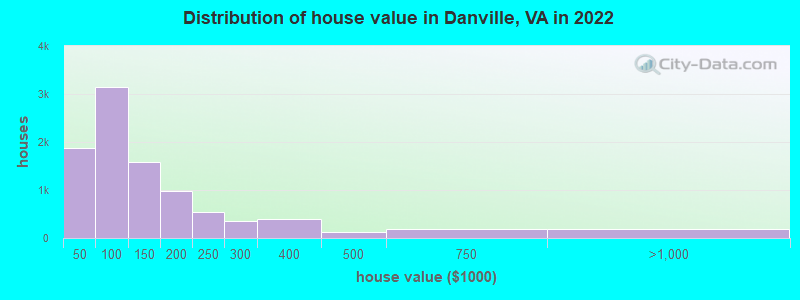
Estimated median house or condo value in 2022: $109,775 (it was $69,800 in 2000 )
Danville:
$109,775Virginia:
$365,700
Lower value quartile - upper value quartile: $65,134 - $181,472Mean price in 2022: Detached houses: $182,031 Here:
$182,031State:
$472,865
Townhouses or other attached units: $241,927 Here:
$241,927State:
$457,437
In 2-unit structures: $369,019 Here:
$369,019State:
$396,289
In 3-to-4-unit structures: $165,481 Here:
$165,481State:
$252,346
In 5-or-more-unit structures: $142,084 Here:
$142,084State:
$382,551
Mobile homes: $21,758 Here:
$21,758State:
$100,736
Total population: 42,444 (All urban)
Houses: 22,659 (19,065 occupied: 9,537 owner occupied, 9,735 renter occupied )
% of renters here:
51%State:
33%
Housing density: 526 houses/condos per square mile
Median price asked for vacant for-sale houses and condos in 2022: $178,126.
Median contract rent in 2022: $551 (lower quartile is $409, upper quartile is $707)
Median rent asked for vacant for-rent units in 2022: $676
Median gross rent in Danville, VA in 2022: $770
Housing units in Danville with a mortgage: 4,663 (449 second mortgage, 13 home equity loan, 317 both second mortgage and home equity loan )Houses without a mortgage: 59
Median household income for houses/condos with a mortgage: $66,874
Median household income for apartments without a mortgage: $44,358
Median monthly housing costs: $723
Data:
Median house or condo value ($)
Median house or condo value ($ change since 2000)
Median house or condo value ($) - White
Median house or condo value ($) - Black or African American
Median house or condo value ($) - Asian
Median house or condo value ($) - Hispanic or Latino
Median house or condo value ($) - American Indian and Alaska Native
Median house or condo value ($) - Multirace
Median house or condo value ($) - Other Race
Median price asked for mobile homes ($)
Household density (households per square mile)
Mean house or condo value by units in structure - 1, detached ($)
Mean house or condo value by units in structure - 1, attached ($)
Mean house or condo value by units in structure - 2 ($)
Mean house or condo value by units in structure by units in structure - 3 or 4 ($)
Mean house or condo value by units in structure - 5 or more ($)
Mean house or condo value by units in structure - Boat, RV, van, etc. ($)
Mean house or condo value by units in structure - Mobile home ($)
Median contract rent ($)
Median contract rent - Lower quartile ($)
Median contract rent - Upper quartile ($)
Median gross rent ($)
Urban houses (%)
Rural houses (%)
Houses occupied (%)
Houses occupied (% change since 2000)
Houses owner occupied (%)
Houses owner occupied (% change since 2000)
Houses renter occupied (%)
Houses renter occupied (% change since 2000)
Vacant housing units - For rent (%)
Vacant housing units - For rent (% change since 2000)
Vacant housing units - For sale only (%)
Vacant housing units - For sale only (% change since 2000)
Vacant housing units - Rented or sold, not occupied (%)
Vacant housing units - Rented or sold, not occupied (% change since 2000)
Vacant housing units - For seasonal, recreational, or occasional use (%)
Vacant housing units - For seasonal, recreational, or occasional use (% change since 2000)
Vacant housing units - For migrant workers (%)
Vacant housing units - For migrant workers (% change since 2000)
Vacant housing units - Other vacant (%)
Vacant housing units - Other vacant (% change since 2000)
Median monthly housing costs ($)
Median household income for houses/condos with a mortgage ($)
Median household income for houses/condos without a mortgage ($)
Median household income ($)
Median household income ($) - White
Median household income ($) - Black or African American
Median household income ($) - Asian
Median household income ($) - Hispanic or Latino
Median household income ($) - American Indian and Alaska Native
Median household income ($) - Multirace
Median household income ($) - Other Race
Mortgage status - with mortgage (%)
Mortgage status - with second mortgage (%)
Mortgage status - with home equity loan (%)
Mortgage status - with both second mortgage and home equity loan (%)
Mortgage status - without a mortgage (%)
Median year house/condo built
Median year apartment built
Household type by relationship - Male householder living alone (%)
Household type by relationship - Male householder not living alone (%)
Household type by relationship - Female householder living alone (%)
Household type by relationship - Female householder not living alone (%)
Household type by relationship - Opposite-Sex spouse (%)
Household type by relationship - Same-Sex spouse (%)
Household type by relationship - Opposite-Sex unmarried partner (%)
Household type by relationship - Same-Sex unmarried partner (%)
Household type by relationship - In group quarters (%)
Size of family households - 2-person household (%)
Size of family households - 3-person household (%)
Size of family households - 4-person household (%)
Size of family households - 5-person household (%)
Size of family households - 6-person household (%)
Size of family households - 7-or-more-person household (%)
Size of nonfamily households - 1-person household (%)
Size of nonfamily households - 2-person household (%)
Size of nonfamily households - 3-person household (%)
Size of nonfamily households - 4-person household (%)
Size of nonfamily households - 5-person household (%)
Size of nonfamily households - 6-person household (%)
Size of nonfamily households - 7-or-moreperson household (%)
Year house built - Built 2010 or later (%)
Year house built - Built 2000 to 2009 (%)
Year house built - Built 1990 to 1999 (%)
Year house built - Built 1980 to 1989 (%)
Year house built - Built 1970 to 1979 (%)
Year house built - Built 1960 to 1969 (%)
Year house built - Built 1950 to 1959 (%)
Year house built - Built 1940 to 1949 (%)
Year house built - Built 1939 or earlier (%)
Median number of rooms in houses and condos
Median number of rooms in apartments
Median number of bedrooms in owner occupied houses
Mean number of bedrooms in owner occupied houses
Median number of bedrooms in renter occupied houses
Mean number of bedrooms in renter occupied houses
Median number of vehichles in owner occupied houses
Mean number of vehichles in owner occupied houses
Median number of vehichles in renter occupied houses
Mean number of vehichles in renter occupied houses
Rooms in owner-occupied houses - 1 room (%)
Rooms in owner-occupied houses - 2 rooms (%)
Rooms in owner-occupied houses - 3 rooms (%)
Rooms in owner-occupied houses - 4 rooms (%)
Rooms in owner-occupied houses - 5 rooms (%)
Rooms in owner-occupied houses - 6 rooms (%)
Rooms in owner-occupied houses - 7 rooms (%)
Rooms in owner-occupied houses - 8 rooms (%)
Rooms in owner-occupied houses - 9+ rooms (%)
Rooms in renter-occupied houses - 1 room (%)
Rooms in renter-occupied houses - 2 rooms (%)
Rooms in renter-occupied houses - 3 rooms (%)
Rooms in renter-occupied houses - 4 rooms (%)
Rooms in renter-occupied houses - 5 rooms (%)
Rooms in renter-occupied houses - 6 rooms (%)
Rooms in renter-occupied houses - 7 rooms (%)
Rooms in renter-occupied houses - 8 rooms (%)
Rooms in renter-occupied houses - 9+ rooms (%)
Bedrooms in owner-occupied houses - no bedrooms (%)
Bedrooms in owner-occupied houses - 1 bedroom (%)
Bedrooms in owner-occupied houses - 2 bedrooms (%)
Bedrooms in owner-occupied houses - 3 bedrooms (%)
Bedrooms in owner-occupied houses - 4 bedrooms (%)
Bedrooms in owner-occupied houses - 5+ bedrooms (%)
Bedrooms in renter-occupied houses - no bedrooms (%)
Bedrooms in renter-occupied houses - 1 bedroom (%)
Bedrooms in renter-occupied houses - 2 bedrooms (%)
Bedrooms in renter-occupied houses - 3 bedrooms (%)
Bedrooms in renter-occupied houses - 4 bedrooms (%)
Bedrooms in renter-occupied houses - 5+ bedrooms (%)
Vehicles available in owner-occupied houses - no vehicle available (%)
Vehicles available in owner-occupied houses - 1 vehicle available(%)
Vehicles available in owner-occupied houses - 2 Vehicles available (%)
Vehicles available in owner-occupied houses - 3 Vehicles available (%)
Vehicles available in owner-occupied houses - 4 Vehicles available (%)
Vehicles available in owner-occupied houses - 5+ Vehicles available (%)
Vehicles available in renter-occupied houses - no vehicle available (%)
Vehicles available in renter-occupied houses - 1 vehicle available (%)
Vehicles available in renter-occupied houses - 2 Vehicles available (%)
Vehicles available in renter-occupied houses - 3 Vehicles available (%)
Vehicles available in renter-occupied houses - 4 Vehicles available (%)
Vehicles available in renter-occupied houses - 5+ Vehicles available (%)
Housing units in structures - 1, detached (%)
Housing units in structures - 1, attached (%)
Housing units in structures - 2 (%)
Housing units in structures - 3 or 4 (%)
Housing units in structures - 5 to 9 (%)
Housing units in structures - 10 to 19 (%)
Housing units in structures - 20 to 49 (%)
Housing units in structures - 50 or more (%)
Housing units in structures - Mobile home (%)
Housing units in structures - Boat, RV, van, etc. (%)
Housing units in structures - Owners - 1, detached (%)
Housing units in structures - Owners - 1, attached (%)
Housing units in structures - Owners - 2 (%)
Housing units in structures - Owners - 3 or 4 (%)
Housing units in structures - Owners - 5 to 9 (%)
Housing units in structures - Owners - 10 to 19 (%)
Housing units in structures - Owners - 20 to 49 (%)
Housing units in structures - Owners - 50 or more (%)
Housing units in structures - Owners - Mobile home (%)
Housing units in structures - Owners - Boat, RV, van, etc. (%)
Housing units in structures - Renters - 1, detached (%)
Housing units in structures - Renters - 1, attached (%)
Housing units in structures - Renters - 2 (%)
Housing units in structures - Renters - 3 or 4 (%)
Housing units in structures - Renters - 5 to 9 (%)
Housing units in structures - Renters - 10 to 19 (%)
Housing units in structures - Renters - 20 to 49 (%)
Housing units in structures - Renters - 50 or more (%)
Housing units in structures - Renters - Mobile home (%)
Housing units in structures - Renters - Boat, RV, van, etc. (%)
House/condo owner moved in on average (years ago)
Renter moved in on average (years ago)
Year householder moved into unit - Moved in 1999 to March 2000 (%)
Year householder moved into unit - Moved in 1999 to March 2000 (%) - White
Year householder moved into unit - Moved in 1999 to March 2000 (%) - Black or African American
Year householder moved into unit - Moved in 1999 to March 2000 (%) - Asian
Year householder moved into unit - Moved in 1999 to March 2000 (%) - Hispanic or Latino
Year householder moved into unit - Moved in 1999 to March 2000 (%) - American Indian and Alaska Native
Year householder moved into unit - Moved in 1999 to March 2000 (%) - Multirace
Year householder moved into unit - Moved in 1999 to March 2000 (%) - Other Race
Year householder moved into unit - Moved in 1995 to 1998 (%)
Year householder moved into unit - Moved in 1995 to 1998 (%) - White
Year householder moved into unit - Moved in 1995 to 1998 (%) - Black or African American
Year householder moved into unit - Moved in 1995 to 1998 (%) - Asian
Year householder moved into unit - Moved in 1995 to 1998 (%) - Hispanic or Latino
Year householder moved into unit - Moved in 1995 to 1998 (%) - American Indian and Alaska Native
Year householder moved into unit - Moved in 1995 to 1998 (%) - Multirace
Year householder moved into unit - Moved in 1995 to 1998 (%) - Other Race
Year householder moved into unit - Moved in 1990 to 1994 (%)
Year householder moved into unit - Moved in 1990 to 1994 (%) - White
Year householder moved into unit - Moved in 1990 to 1994 (%) - Black or African American
Year householder moved into unit - Moved in 1990 to 1994 (%) - Asian
Year householder moved into unit - Moved in 1990 to 1994 (%) - Hispanic or Latino
Year householder moved into unit - Moved in 1990 to 1994 (%) - American Indian and Alaska Native
Year householder moved into unit - Moved in 1990 to 1994 (%) - Multirace
Year householder moved into unit - Moved in 1990 to 1994 (%) - Other Race
Year householder moved into unit - Moved in 1980 to 1989 (%)
Year householder moved into unit - Moved in 1980 to 1989 (%) - White
Year householder moved into unit - Moved in 1980 to 1989 (%) - Black or African American
Year householder moved into unit - Moved in 1980 to 1989 (%) - Asian
Year householder moved into unit - Moved in 1980 to 1989 (%) - Hispanic or Latino
Year householder moved into unit - Moved in 1980 to 1989 (%) - American Indian and Alaska Native
Year householder moved into unit - Moved in 1980 to 1989 (%) - Multirace
Year householder moved into unit - Moved in 1980 to 1989 (%) - Other Race
Year householder moved into unit - Moved in 1970 to 1979 (%)
Year householder moved into unit - Moved in 1970 to 1979 (%) - White
Year householder moved into unit - Moved in 1970 to 1979 (%) - Black or African American
Year householder moved into unit - Moved in 1970 to 1979 (%) - Asian
Year householder moved into unit - Moved in 1970 to 1979 (%) - Hispanic or Latino
Year householder moved into unit - Moved in 1970 to 1979 (%) - American Indian and Alaska Native
Year householder moved into unit - Moved in 1970 to 1979 (%) - Multirace
Year householder moved into unit - Moved in 1970 to 1979 (%) - Other Race
Year householder moved into unit - Moved in 1969 or earlier (%)
Year householder moved into unit - Moved in 1969 or earlier (%) - White
Year householder moved into unit - Moved in 1969 or earlier (%) - Black or African American
Year householder moved into unit - Moved in 1969 or earlier (%) - Asian
Year householder moved into unit - Moved in 1969 or earlier (%) - Hispanic or Latino
Year householder moved into unit - Moved in 1969 or earlier (%) - American Indian and Alaska Native
Year householder moved into unit - Moved in 1969 or earlier (%) - Multirace
Year householder moved into unit - Moved in 1969 or earlier (%) - Other Race
Housing units lacking complete plumbing facilities (%)
Housing units lacking complete kitchen facilities (%)
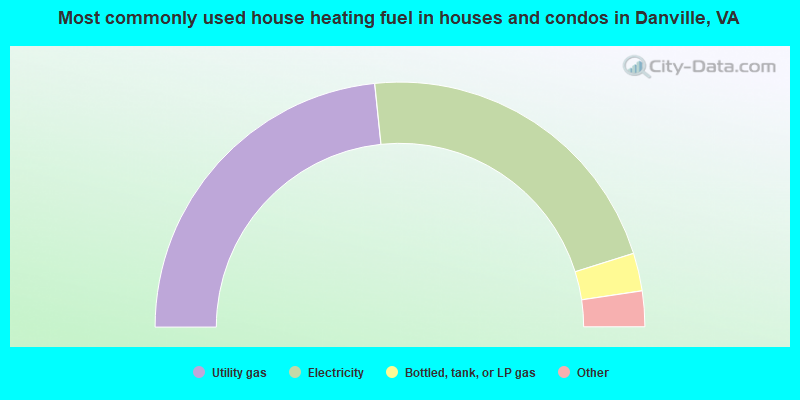
House heating fuel used in houses and condos - Utility gas (%)
House heating fuel used in houses and condos - Bottled, tank, or LP gas (%)
House heating fuel used in houses and condos - Electricity (%)
House heating fuel used in houses and condos - Fuel oil, kerosene, etc. (%)
House heating fuel used in houses and condos - Coal or coke (%)
House heating fuel used in houses and condos - Wood (%)
House heating fuel used in houses and condos - Solar energy (%)
House heating fuel used in houses and condos - Other fuel (%)
House heating fuel used in houses and condos - No fuel used (%)
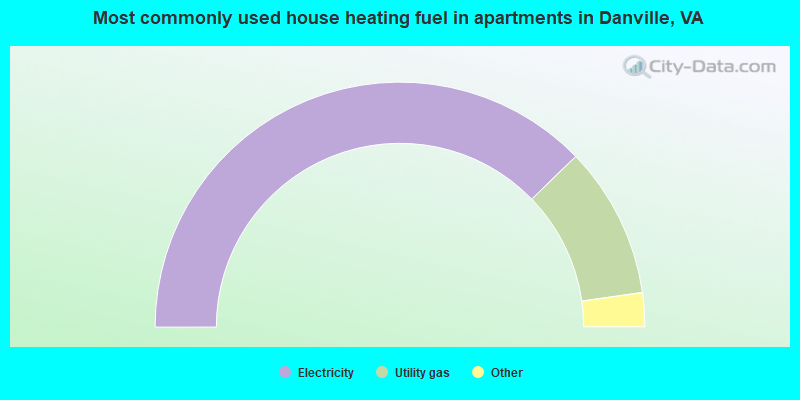
House heating fuel used in apartments - Utility gas (%)
House heating fuel used in apartments - Bottled, tank, or LP gas (%)
House heating fuel used in apartments - Electricity (%)
House heating fuel used in apartments - Fuel oil, kerosene, etc. (%)
House heating fuel used in apartments - Coal or coke (%)
House heating fuel used in apartments - Wood (%)
House heating fuel used in apartments - Solar energy (%)
House heating fuel used in apartments - Other fuel (%)
House heating fuel used in apartments - No fuel used (%)
Latest news about housing in Danville, VA collected exclusively by city-data.com from local newspapers, TV, and radio stations
Median year house/condo built: 1962Median year apartment built: 1964Household type by relationship:
Households: 42,798
Male householders: 7,657 (3,199 living alone ), Female householders: 11,226 (4,563 living alone )5,251 spouses (5,214 opposite-sex spouses ), 1,206 unmarried partners , (1,172 opposite-sex unmarried partners ), 11,685 children (11,035 natural , 119 adopted , 530 stepchildren ), 1,830 grandchildren , 290 brothers or sisters , 407 parents , 9 foster children , 683 other relatives , 930 non-relatives In group quarters: 1,619
Size of family households: 5,334 2-persons , 2,263 3-persons , 1,307 4-persons , 599 5-persons , 366 6-persons , 143 7-or-more-persons .
Size of nonfamily households: 7,986 1-person , 1,288 2-persons , 57 3-persons , 5 5-persons , 6 6-persons .
3,383 married couples with children. single-parent households (667 men , 3,789 women ).
94.4% of residents of Danville speak English at home. of residents speak Spanish at home (58% speak English very well , 10% speak English well , 28% speak English not well , 3% don't speak English at all ).of residents speak other Indo-European language at home (68% speak English very well , 25% speak English well , 7% speak English not well ).of residents speak Asian or Pacific Island language at home (45% speak English very well , 43% speak English well , 8% speak English not well , 4% don't speak English at all ).
Foreign born population: 1,551 (3.6%)of them are naturalized citizens )
Median number of rooms in houses and condos:
Median number of rooms in apartments
Owner-occupied Renter-occupied
Rooms in owner-occupied houses in Danville, Virginia
13 1 room 12 2 rooms 140 3 rooms 1,177 4 rooms 2,051 5 rooms 2,264 6 rooms 1,609 7 rooms 927 8 rooms 1,344 9+ rooms
Rooms in renter-occupied apartments in Danville, Virginia
284 1 room 245 2 rooms 1,483 3 rooms 3,545 4 rooms 2,019 5 rooms 1,003 6 rooms 565 7 rooms 412 8 rooms 180 9+ rooms
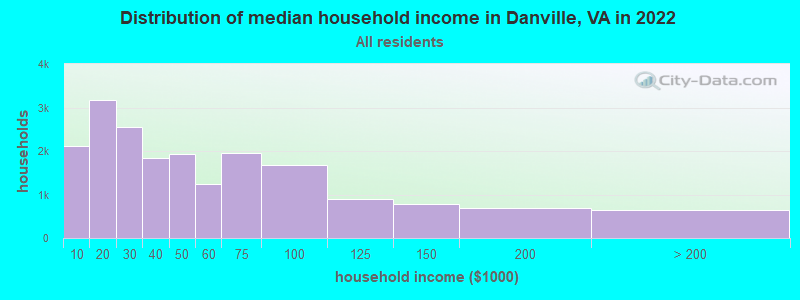
Danville, VA household income distribution 2,104 Less than $10,0003,180 $10,000 to $19,9992,543 $20,000 to $29,9991,833 $30,000 to $39,9991,928 $40,000 to $49,9991,252 $50,000 to $59,9991,958 $60,000 to $74,9991,679 $75,000 to $99,999893 $100,000 to $124,999787 $125,000 to $149,999679 $150,000 to $199,999644 $200,000 or more
Home value of owner - occupied houses in 2022 in Danville, VA 453 Less than $10,000169 $10,000 to $14,999123 $15,000 to $19,999143 $20,000 to $24,999202 $25,000 to $29,999135 $30,000 to $34,99995 $35,000 to $39,999554 $40,000 to $49,999466 $50,000 to $59,999356 $60,000 to $69,999657 $70,000 to $79,999704 $80,000 to $89,999414 $90,000 to $99,9991,020 $100,000 to $124,999558 $125,000 to $149,999684 $150,000 to $174,999296 $175,000 to $199,999535 $200,000 to $249,999362 $250,000 to $299,999386 $300,000 to $399,999127 $400,000 to $499,999189 $500,000 to $749,999135 $750,000 to $999,99946 $1,000,000 to $1,499,999Rent paid by renters in 2022 in Danville, VA 322 Less than $10078 $100 to $149250 $150 to $199328 $200 to $249168 $250 to $299511 $300 to $349493 $350 to $399768 $400 to $449761 $450 to $4991,181 $500 to $549739 $550 to $599567 $600 to $649579 $650 to $699466 $700 to $749351 $750 to $799455 $800 to $899265 $900 to $999445 $1,000 to $1,249178 $1,250 to $1,49995 $1,500 to $1,9998 $3,500 or more457 No cash rent
Percentage of workers working in this county: 76.3%Number of people working at home: 1,221 (7.5% of all workers )
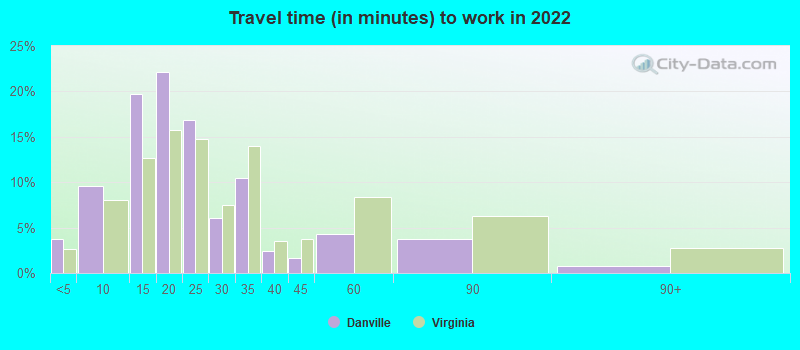
Travel time to work (commute)
Less than 5 minutes: 7775 to 9 minutes: 2,05410 to 14 minutes: 3,79915 to 19 minutes: 3,50820 to 24 minutes: 1,93125 to 29 minutes: 33630 to 34 minutes: 99335 to 39 minutes: 11140 to 44 minutes: 16745 to 59 minutes: 46160 to 89 minutes: 53190 or more minutes: 205
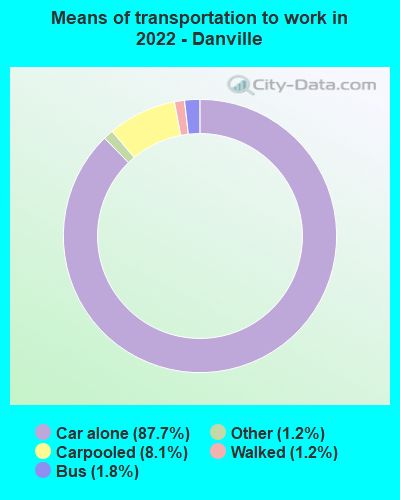
Means of transportation to work:
Drove a car alone: 21,183 (80.6%)Carpooled: 1,993 (7.6%)Bus : 304 (1.2%)Subway or elevated rail : 1 (0.0%)Taxi: 348 (1.3%)Walked: 307 (1.2%)Worked at home: 1,221 (4.6%)
Unemployment by race in 2022
Unemployment rate for White non-Hispanic residents 4.4% Males3.7% FemalesUnemployment rate for Black residents 5.7% Males5.8% FemalesUnemployment rate for Asian residents 0.7% MalesUnemployment rate for other race residents 13.3% Males15.0% FemalesUnemployment rate for two or more race residents 0.6% Males1.3% FemalesUnemployment rate for Hispanic or Latino residents 1.0% Males2.7% Females
Year of entry for the foreign-born population in Danville, Virginia
800 2010 or later 466 2000 to 2009 172 1990 to 1999 59 1980 to 1989 136 1970 to 1979 141 Before 1970
First ancestries reported:
American: 4,247 (14.5%)
English: 2,613 (8.9%)
African: 1,965 (6.7%)
Irish: 526 (1.8%)
German: 475 (1.6%)
European: 253 (0.9%)
Scotch-Irish: 253 (0.9%)
British: 241 (0.8%)
Scottish: 213 (0.7%)
Italian: 102 (0.3%)
French: 82 (0.3%)
Polish: 56 (0.2%)
Norwegian: 47 (0.2%)
Pennsylvania German: 35 (0.1%)
Jamaican: 34 (0.1%)
Welsh: 29 (0.10%)
Dutch: 25 (0.09%)
Scandinavian: 16 (0.05%)
Nigerian: 13 (0.04%)
Russian: 10 (0.03%)
Greek: 9 (0.03%)
Austrian: 8 (0.03%)
Canadian: 7 (0.02%)
Hungarian: 6 (0.02%)
Czech: 5 (0.02%)
Swiss: 5 (0.02%)
French Canadian: 4 (0.01%)
Northern European: 4 (0.01%)
Bahamian: 4 (0.01%) Most common places of birth for foreign-born residents (%): Mexico Danville:
20.1% (312)Virginia:
5.3% (57,498)
India Danville:
15.4% (239)Virginia:
9.0% (97,830)
El Salvador Danville:
13.9% (216)Virginia:
9.9% (107,534)
Honduras Danville:
13.4% (208)Virginia:
3.0% (32,892)
Philippines Danville:
5.5% (86)Virginia:
4.8% (52,629)
Panama Danville:
4.5% (70)Virginia:
0.4% (4,196)
Denmark Danville:
3.5% (54)Virginia:
0.1% (805)
Vietnam Danville:
2.9% (45)Virginia:
4.2% (45,750)
China, excluding Hong Kong and Taiwan Danville:
2.8% (43)Virginia:
3.9% (42,989)
Jamaica Danville:
2.1% (33)Virginia:
1.0% (10,734)
Dominican Republic Danville:
1.7% (27)Virginia:
0.6% (6,698)
Africa, n.e.c. Danville:
1.5% (24)Virginia:
0.3% (3,275)
Uruguay Danville:
1.5% (24)Virginia:
0.1% (1,223)
Place of birth for U.S.-born residents:
This state: 29,620Other state: 11,177Northeast: 3,218Midwest: 870South: 6,519West: 540 89.0% of Danville residents lived in the same house 1 years ago.
Out of people who lived in different houses, 32.7% lived in this county.
Out of people who lived in different counties, 58.9% lived in Virginia.
Danville:
89.0%State average:
86.6%
Education attainment for males 25 years and older:
No schooling: 232Nursery to 4th grade: 635th and 6th grade: 1527th and 8th grade: 1969th grade: 24010th grade: 48211th grade: 57312th grade, no diploma: 199High school graduate (or equivalency): 5,635Less than 1 year of college: 549Some college more than 1 year, no degree: 1,351Associate degree: 833Bachelor's degree: 1,582Master's degree: 459Professional school degree: 232Doctorate degree: 94
Education attainment for females 25 years and older:
No schooling: 227Nursery to 4th grade: 465th and 6th grade: 1617th and 8th grade: 2869th grade: 28210th grade: 44511th grade: 45612th grade, no diploma: 262High school graduate (or equivalency): 5,820Less than 1 year of college: 1,204Some college more than 1 year, no degree: 2,196Associate degree: 1,751Bachelor's degree: 1,948Master's degree: 1,143Professional school degree: 169Doctorate degree: 88
Housing units in structures:
One, detached: 15,372One, attached: 387Two: 7233 or 4: 1,0155 to 9: 1,32010 to 19: 1,55420 to 49: 67050 or more: 731Mobile homes: 883Median worth of mobile homes: $12,020
Housing units lacking complete plumbing facilities in 2022: 4.9%Housing units lacking complete kitchen facilities in 2022: 6.1%House/condo owner moved in on average 18 years ago
Renter moved in on average 1 years ago
Private vs. public school enrollment:
Students in private schools in grades 1 to 8 (elementary and middle school): 326 Students in private schools in grades 9 to 12 (high school): 208 Students in private undergraduate colleges: 551