Darlington, SC (South Carolina) Houses and Residents
| Darlington: | $186,181 |
| South Carolina: | $254,600 |
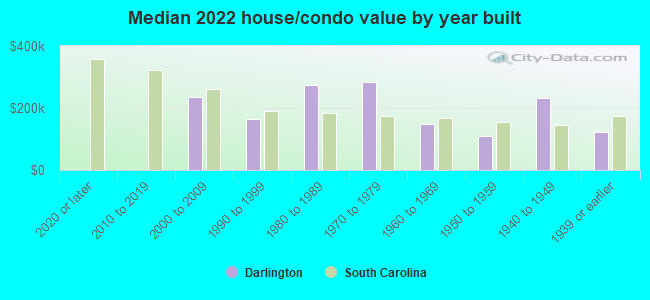
Mean price in 2022:
Detached houses: $185,150
Here: $185,150 State: $368,255
Total population: 6,206 (All urban)
Houses: 3,299 (2,654 occupied: 1,313 owner occupied, 1,392 renter occupied)
| % of renters here: | 51% |
| State: | 28% |
Housing density: 769 houses/condos per square mile
Median price asked for vacant for-sale houses and condos in 2022 in this county: $144,953.
Median contract rent in 2022: $529 (lower quartile is $316, upper quartile is $674)
Median rent asked for vacant for-rent units in 2022: $682
Median gross rent in Darlington, SC in 2022: $712
Housing units in Darlington with a mortgage: 600 (74 second mortgage, 0 home equity loan, 54 both second mortgage and home equity loan)
Houses without a mortgage: 0
Median household income for houses/condos with a mortgage: $73,515
Median household income for apartments without a mortgage: $42,323
Median monthly housing costs: $690
Compare current foreclosures in Darlington, SC:
| Photo | Address | Area | Beds / Baths | Price | Details |
|---|---|---|---|---|---|

|
#1
Mont Clare Rd
Darlington, SC 29540
|
1,399 sq. feet
|
2 baths 3 beds |
show details | |

|
#2
Forest Dr
Darlington, SC 29540
|
- sq. feet
|
2 baths 3 beds |
show details | |

|
#3
Lawson Rd
Darlington, SC 29532
|
- sq. feet
|
1 baths 3 beds |
show details | |

|
#4
E Mciver Rd
Darlington, SC 29532
|
2,432 sq. feet
|
2 baths 4 beds |
show details | |

|
#5
Allen St
Darlington, SC 29532
|
1,372 sq. feet
|
- baths - beds |
$39,900
|
show details |

|
#6
Sunflower Ct
Darlington, SC 29532
|
- sq. feet
|
- baths - beds |
show details | |

|
#7
Wood Creek Rd
Darlington, SC 29532
|
1,607 sq. feet
|
- baths - beds |
show details | |

|
#8
Darlington Ave
Darlington, SC 29532
|
1,087 sq. feet
|
- baths - beds |
show details | |

|
#9
Coon Hunter Dr
Darlington, SC 29540
|
- sq. feet
|
- baths - beds |
show details | |

|
#10
Jacobs Dr
Darlington, SC 29532
|
- sq. feet
|
- baths - beds |
show details |
| Photo | Address | Area | Beds / Baths | Price | Details |
|---|---|---|---|---|---|

|
#11
Tiffany Ln
Darlington, SC 29532
|
- sq. feet
|
- baths - beds |
show details | |

|
#12
Jamestown Ave
Darlington, SC 29532
|
2,128 sq. feet
|
- baths - beds |
show details | |

|
#13
Lamar Hwy
Darlington, SC 29532
|
- sq. feet
|
- baths - beds |
show details | |

|
#14
Howle Ave
Darlington, SC 29532
|
1,108 sq. feet
|
- baths - beds |
show details | |

|
#15
Virgil Wells Cir
Darlington, SC 29532
|
1,103 sq. feet
|
- baths - beds |
show details | |

|
#16
2nd St
Darlington, SC 29532
|
1,046 sq. feet
|
- baths - beds |
show details | |

|
#17
Limit St
Darlington, SC 29532
|
1,175 sq. feet
|
- baths - beds |
show details | |

|
#18
Spring Acres Dr
Darlington, SC 29532
|
- sq. feet
|
- baths - beds |
show details | |

|
#19
Rogers Rd
Darlington, SC 29532
|
2,744 sq. feet
|
- baths - beds |
show details | |

|
#20
Kennedy St
Darlington, SC 29540
|
1,030 sq. feet
|
- baths - beds |
show details |
| Photo | Address | Area | Beds / Baths | Price | Details |
|---|---|---|---|---|---|

|
#21
Shearin St
Darlington, SC 29532
|
- sq. feet
|
- baths - beds |
show details | |

|
#22
Cedar Ridge Rd
Darlington, SC 29540
|
763 sq. feet
|
- baths - beds |
show details | |

|
#23
Chestnut St
Darlington, SC 29532
|
- sq. feet
|
- baths - beds |
show details | |

|
#24
Moses Dr
Darlington, SC 29532
|
1,164 sq. feet
|
- baths - beds |
show details | |

|
#25
Rhodes Community Rd
Darlington, SC 29540
|
1,180 sq. feet
|
- baths - beds |
show details | |

|
#26
Jessamine St
Darlington, SC 29532
|
661 sq. feet
|
- baths - beds |
show details | |

|
#27
Dove Trail Rd
Darlington, SC 29540
|
834 sq. feet
|
- baths - beds |
show details | |

|
#28
Gilchrist Rd
Darlington, SC 29532
|
- sq. feet
|
- baths - beds |
show details | |

|
#29
Timmonsville Hwy
Darlington, SC 29532
|
- sq. feet
|
- baths - beds |
show details | |

|
#30
Fulton Rd
Darlington, SC 29532
|
4,083 sq. feet
|
- baths - beds |
show details |
| Photo | Address | Area | Beds / Baths | Price | Details |
|---|---|---|---|---|---|

|
#31
Edwards Ave
Darlington, SC 29532
|
983 sq. feet
|
- baths - beds |
show details | |

|
#32
Lamar Hwy
Darlington, SC 29532
|
- sq. feet
|
- baths - beds |
show details | |

|
#33
April Dr
Darlington, SC 29532
|
- sq. feet
|
- baths - beds |
show details | |

|
#34
Society Hill Rd
Darlington, SC 29540
|
1,033 sq. feet
|
- baths - beds |
show details | |

|
#35
Holly Cir
Darlington, SC 29532
|
2,750 sq. feet
|
- baths - beds |
show details | |

|
#36
Jamestown Ave
Darlington, SC 29532
|
- sq. feet
|
- baths - beds |
show details | |

|
#37
Gilchrist Rd
Darlington, SC 29532
|
- sq. feet
|
- baths - beds |
show details | |

|
#38
Diana Dr
Darlington, SC 29532
|
- sq. feet
|
- baths - beds |
show details | |

|
#39
Welling Farm Rd
Darlington, SC 29532
|
- sq. feet
|
- baths - beds |
show details | |

|
Check over 1 million property listings on Foreclosure.com!
|
browse all offers | |||

Latest news about housing in Darlington, SC collected exclusively by city-data.com from local newspapers, TV, and radio stations

 | Century complete in Darlington (3 replies) |
| What's New/Closing/Coming to Florence (436 replies) |
| Top-ranked South Carolina stayed in the locker room for the national anthem at the Final Four (97 replies) |
| Hartsville, SC Information (26 replies) |
| South Carolina 10 year growth changes (157 replies) |
| Rural Towns near Shoreline (75 replies) |
Median year apartment built: 1973
Household type by relationship:
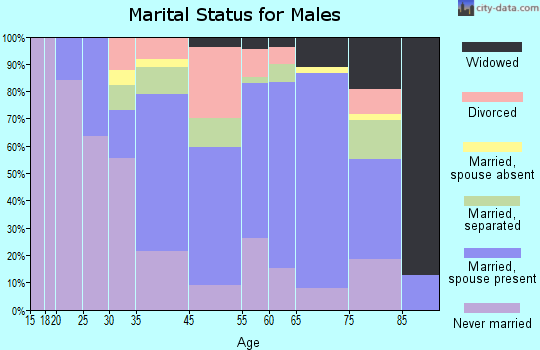
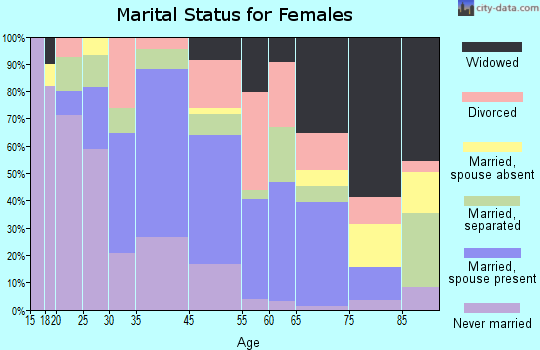
Households: 6,339- Male householders: 887 (323 living alone), Female householders: 1,745 (666 living alone)
800 spouses (800 opposite-sex spouses), 66 unmarried partners, (54 opposite-sex unmarried partners), 1,849 children (1,795 natural, 11 adopted, 43 stepchildren), 408 grandchildren, 64 brothers or sisters, 90 parents, 0 foster children, 103 other relatives, 78 non-relatives
- In group quarters: 244
Size of family households: 811 2-persons, 356 3-persons, 237 4-persons, 201 5-persons.
Size of nonfamily households: 1,006 1-person, 82 2-persons.
458 married couples with children.
427 single-parent households (130 men, 297 women).
99.8% of residents of Darlington speak English at home.
0.5% of residents speak Spanish at home (88% speak English well, 12% don't speak English at all).
Foreign born population: 102 (1.6%)
(80.4% of them are naturalized citizens)
| Here: | 6.9 |
| State: | 6.4 |
| Here: | 4.6 |
| State: | 4.5 |
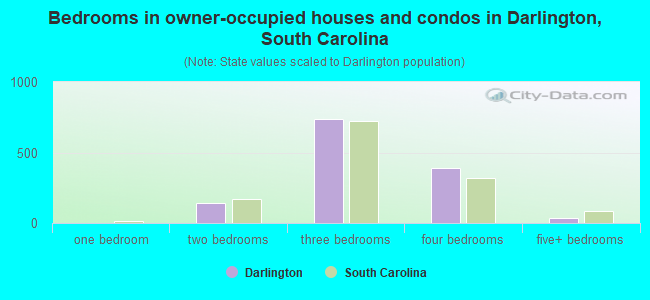
- Bedrooms in owner-occupied houses and condos in Darlington, South Carolina
- 0no bedroom
- 01 bedroom
- 1412 bedrooms
- 7403 bedrooms
- 3934 bedrooms
- 395+ bedrooms
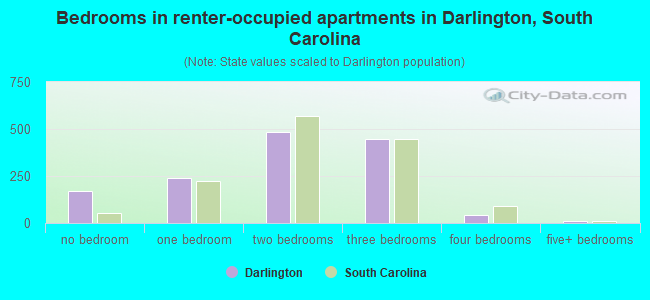
- Bedrooms in renter-occupied apartments in Darlington, South Carolina
- 172no bedroom
- 2381 bedroom
- 4832 bedrooms
- 4493 bedrooms
- 424 bedrooms
- 105+ bedrooms
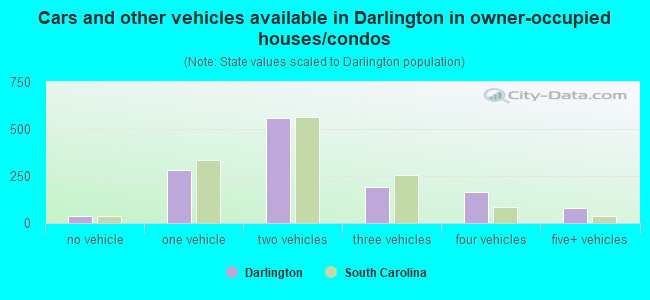
- Cars and other vehicles available in Darlington in owner-occupied houses/condos
- 38no vehicle
- 2811 vehicle
- 5612 vehicles
- 1913 vehicles
- 1644 vehicles
- 795+ vehicles
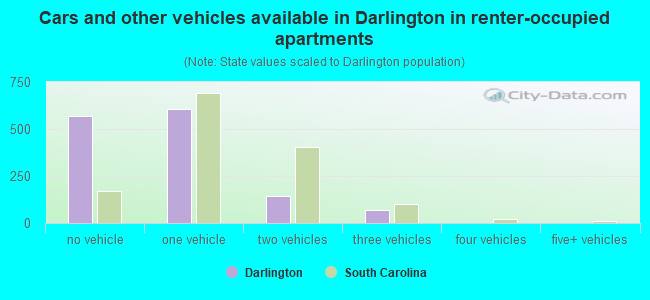
- Cars and other vehicles available in Darlington in renter-occupied apartments
- 569no vehicle
- 6081 vehicle
- 1462 vehicles
- 703 vehicles
- 04 vehicles
- 05+ vehicles
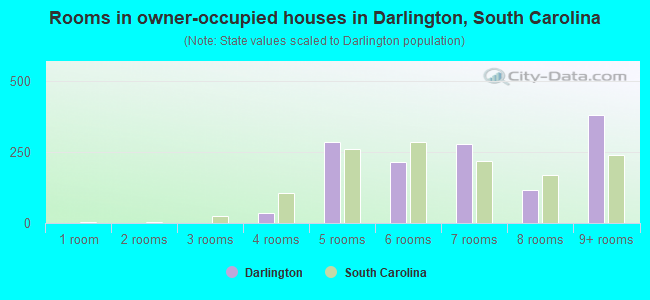
- Rooms in owner-occupied houses in Darlington, South Carolina
- 01 room
- 02 rooms
- 03 rooms
- 344 rooms
- 2875 rooms
- 2166 rooms
- 2787 rooms
- 1178 rooms
- 3819+ rooms
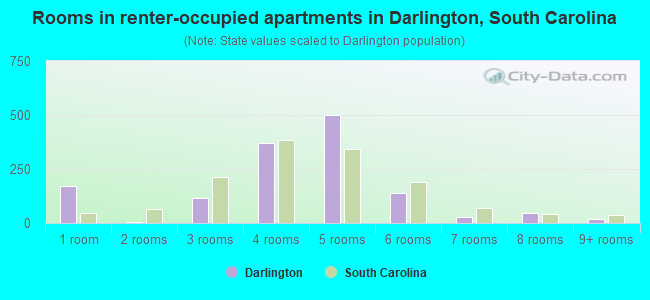
- Rooms in renter-occupied apartments in Darlington, South Carolina
- 1721 room
- 52 rooms
- 1153 rooms
- 3704 rooms
- 5005 rooms
- 1376 rooms
- 267 rooms
- 468 rooms
- 209+ rooms
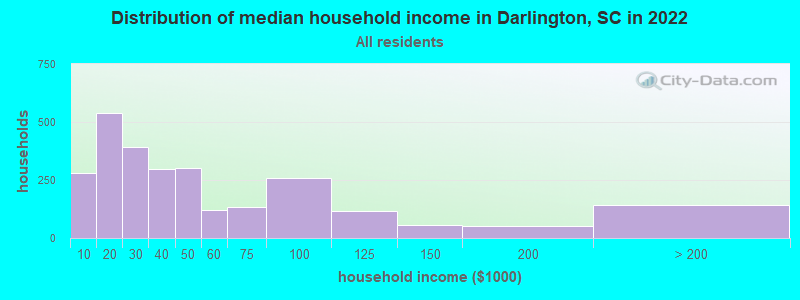
Darlington, SC household income distribution

- 280Less than $10,000
- 537$10,000 to $19,999
- 391$20,000 to $29,999
- 297$30,000 to $39,999
- 300$40,000 to $49,999
- 122$50,000 to $59,999
- 133$60,000 to $74,999
- 259$75,000 to $99,999
- 118$100,000 to $124,999
- 56$125,000 to $149,999
- 53$150,000 to $199,999
- 142$200,000 or more
Home value of owner - occupied houses in 2022 in Darlington, SC
-
- 5Less than $10,000
- 5$15,000 to $19,999
- 42$20,000 to $24,999
- 5$25,000 to $29,999
- 15$30,000 to $34,999
- 60$40,000 to $49,999
- 50$50,000 to $59,999
- 23$60,000 to $69,999
- 22$70,000 to $79,999
- 15$80,000 to $89,999
- 49$90,000 to $99,999
- 96$100,000 to $124,999
- 92$125,000 to $149,999
- 70$150,000 to $174,999
- 41$175,000 to $199,999
- 153$200,000 to $249,999
- 227$250,000 to $299,999
- 103$300,000 to $399,999
- 33$400,000 to $499,999
- 89$1,500,000 to $1,999,999
Rent paid by renters in 2022 in Darlington, SC
-
- 35Less than $100
- 66$100 to $149
- 164$150 to $199
- 12$200 to $249
- 19$250 to $299
- 108$300 to $349
- 46$350 to $399
- 57$400 to $449
- 58$450 to $499
- 42$500 to $549
- 61$550 to $599
- 226$600 to $649
- 21$650 to $699
- 95$700 to $749
- 28$750 to $799
- 24$800 to $899
- 5$900 to $999
- 102$1,000 to $1,249
- 12$3,500 or more
- 58No cash rent
Percentage of workers working in this county: 62.0%
Number of people working at home: 39 (1.8% of all workers)
Travel time to work (commute)
- Less than 5 minutes: 177
- 5 to 9 minutes: 255
- 10 to 14 minutes: 336
- 15 to 19 minutes: 312
- 20 to 24 minutes: 254
- 25 to 29 minutes: 69
- 30 to 34 minutes: 384
- 35 to 39 minutes: 79
- 40 to 44 minutes: 27
- 45 to 59 minutes: 61
- 60 to 89 minutes: 66
- 90 or more minutes: 19
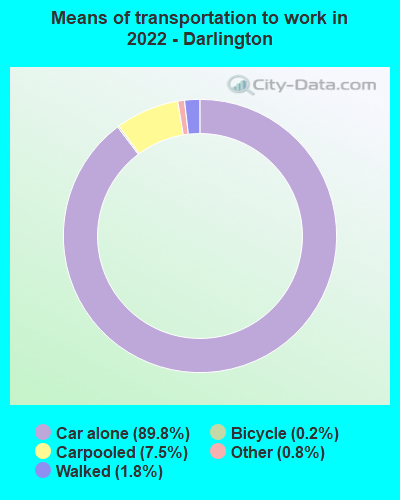
Means of transportation to work:
- Drove a car alone: 3,196 (85.7%)
- Carpooled: 278 (7.5%)
- Taxi: 33 (0.9%)
- Bicycle: 6 (0.2%)
- Walked: 58 (1.6%)
- Worked at home: 39 (1.0%)
- Unemployment by race in 2022
- Unemployment rate for White non-Hispanic residents
- 0.5%Males
- 0.8%Females
- Unemployment rate for Black residents
- 4.7%Males
- 12.3%Females
- Unemployment rate for two or more race residents
- 100.0%Females
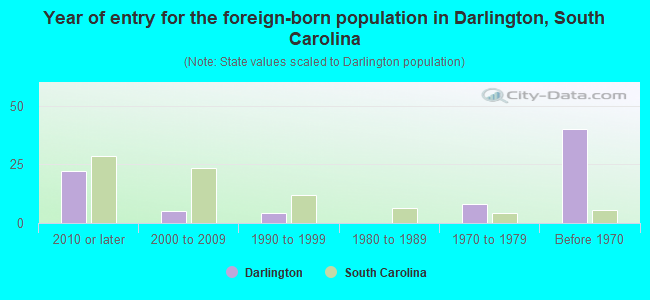
- Year of entry for the foreign-born population in Darlington, South Carolina
- 222010 or later
- 52000 to 2009
- 41990 to 1999
- 01980 to 1989
- 81970 to 1979
- 40Before 1970
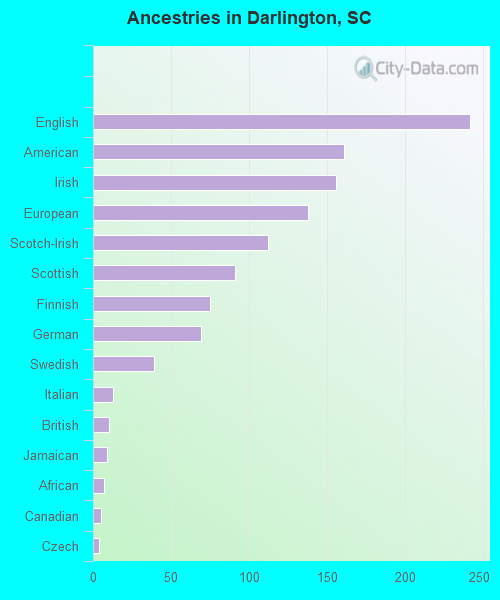
First ancestries reported:
- English: 242 (5.8%)
- American: 161 (3.8%)
- Irish: 156 (3.7%)
- European: 138 (3.3%)
- Scotch-Irish: 112 (2.7%)
- Scottish: 91 (2.2%)
- Finnish: 75 (1.8%)
- German: 69 (1.6%)
- Swedish: 39 (0.9%)
- Italian: 13 (0.3%)
- British: 10 (0.2%)
- Jamaican: 9 (0.2%)
- African: 7 (0.2%)
- Canadian: 5 (0.1%)
- Czech: 4 (0.10%)
- Barbadian: 2 (0.05%)
Most common places of birth for foreign-born residents (%):
| Darlington: | 40.2% (41) |
| South Carolina: | 4.1% (11,031) |
| Darlington: | 15.7% (16) |
| South Carolina: | 1.2% (3,296) |
| Darlington: | 11.8% (12) |
| South Carolina: | 1.9% (5,117) |
| Darlington: | 9.8% (10) |
| South Carolina: | 22.5% (60,774) |
| Darlington: | 5.9% (6) |
| South Carolina: | 3.0% (8,193) |
| Darlington: | 3.9% (4) |
| South Carolina: | 0.1% (317) |
| Darlington: | 3.9% (4) |
| South Carolina: | 0.1% (194) |
Place of birth for U.S.-born residents:
- This state: 5,077
- Other state: 1,040
- Northeast: 305
- Midwest: 130
- South: 494
- West: 110
92.5% of Darlington residents lived in the same house 1 years ago.
Out of people who lived in different houses, 34.6% lived in this county.
Out of people who lived in different counties, 85.6% lived in South Carolina.
| Darlington: | 92.5% |
| State average: | 86.5% |
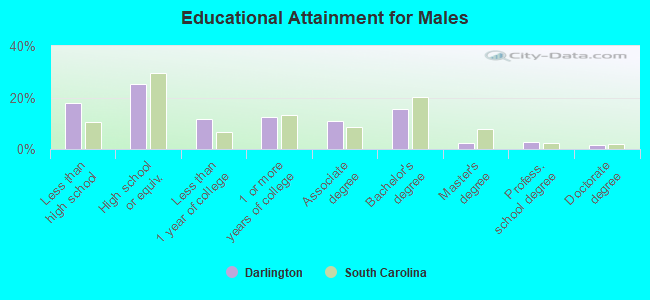
Education attainment for males 25 years and older:
- No schooling: 69
- Nursery to 4th grade: 4
- 5th and 6th grade: 10
- 7th and 8th grade: 27
- 9th grade: 20
- 10th grade: 92
- 11th grade: 53
- 12th grade, no diploma: 26
- High school graduate (or equivalency): 426
- Less than 1 year of college: 195
- Some college more than 1 year, no degree: 211
- Associate degree: 182
- Bachelor's degree: 265
- Master's degree: 41
- Professional school degree: 44
- Doctorate degree: 26
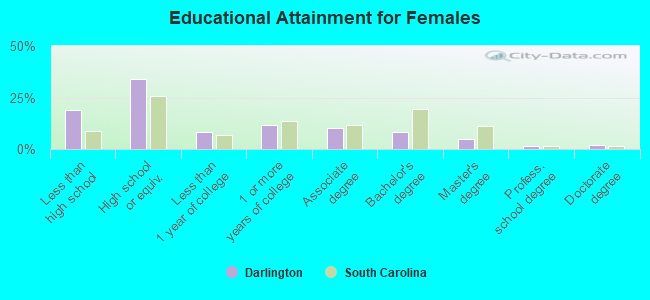
Education attainment for females 25 years and older:
- No schooling: 76
- Nursery to 4th grade: 44
- 5th and 6th grade: 32
- 7th and 8th grade: 86
- 9th grade: 15
- 10th grade: 181
- 11th grade: 40
- 12th grade, no diploma: 57
- High school graduate (or equivalency): 954
- Less than 1 year of college: 231
- Some college more than 1 year, no degree: 323
- Associate degree: 291
- Bachelor's degree: 231
- Master's degree: 130
- Professional school degree: 47
- Doctorate degree: 52
Housing units in structures:
- One, detached: 2,379
- One, attached: 27
- Two: 210
- 3 or 4: 254
- 5 to 9: 210
- 10 to 19: 126
- 20 to 49: 25
- Mobile homes: 65
Housing units lacking complete kitchen facilities in 2022: 3.7%
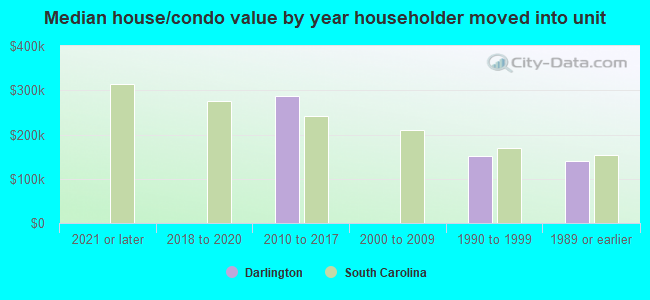
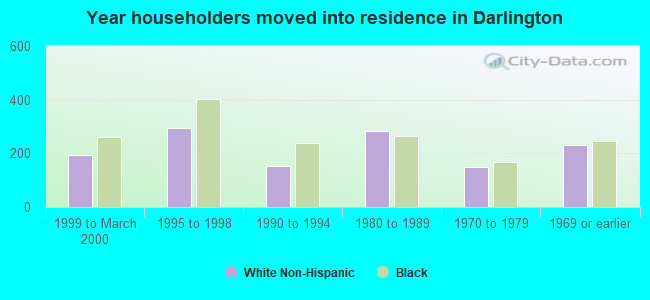
House/condo owner moved in on average 20 years ago
Renter moved in on average 4 years ago
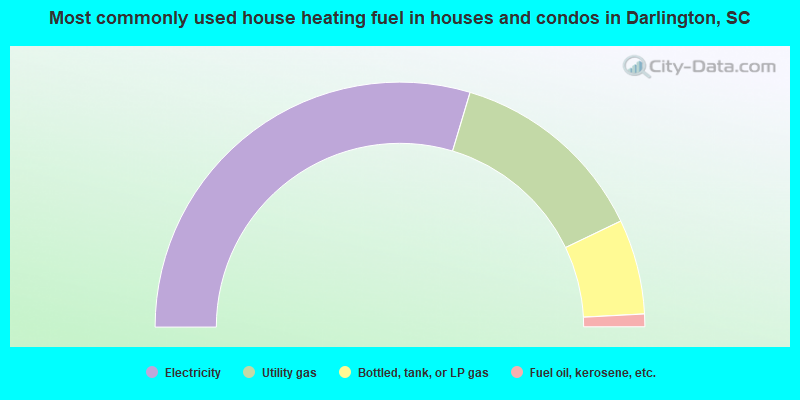
- 59.2%Electricity
- 26.5%Utility gas
- 12.5%Bottled, tank, or LP gas
- 1.7%Fuel oil, kerosene, etc.
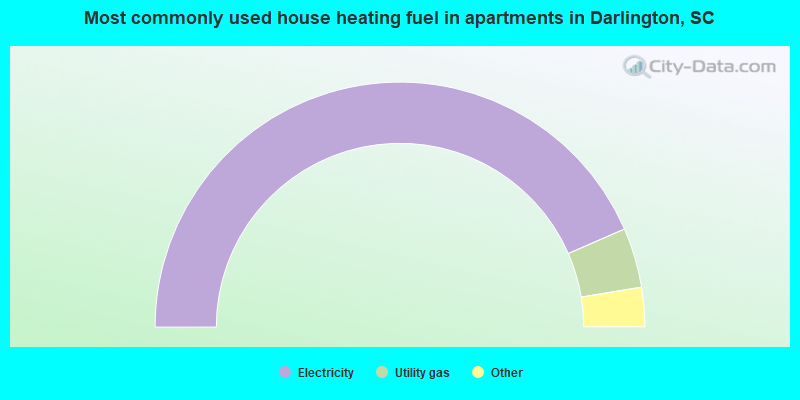
- 87.0%Electricity
- 7.9%Utility gas
- 2.3%Fuel oil, kerosene, etc.
- 2.2%Other fuel
- 0.6%Bottled, tank, or LP gas
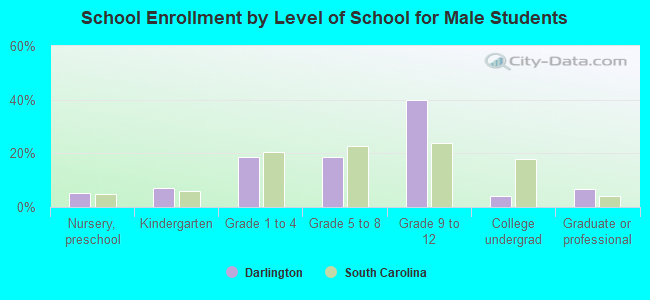
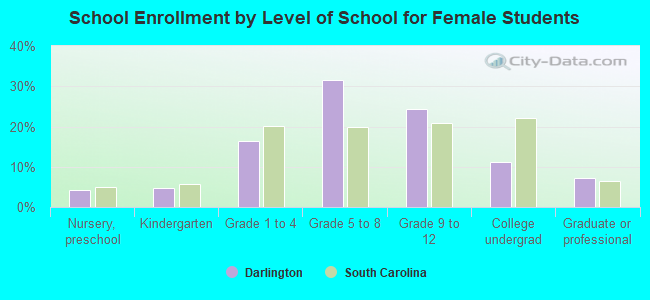
Private vs. public school enrollment:
| Here: | 11.9% |
| South Carolina: | 14.4% |
| Here: | 8.1% |
| South Carolina: | 11.1% |
| Here: | 47.1% |
| South Carolina: | 21.9% |