Housing density: 2,624 houses/condos per square mile
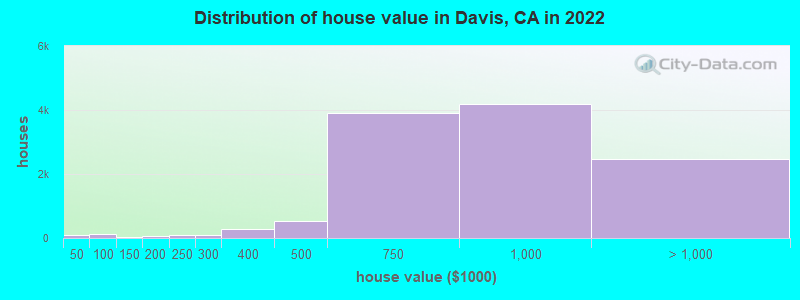
Median price asked for vacant for-sale houses and condos in 2022: $599,755.
Median contract rent in 2022: $1,865 (lower quartile is $1,510, upper quartile is over $2,000)
Median rent asked for vacant for-rent units in 2022: $2,359
Median gross rent in Davis, CA in 2022: $1,920
Housing units in Davis with a mortgage: 6,281 (615 second mortgage, 0 home equity loan, 310 both second mortgage and home equity loan) Houses without a mortgage: 234
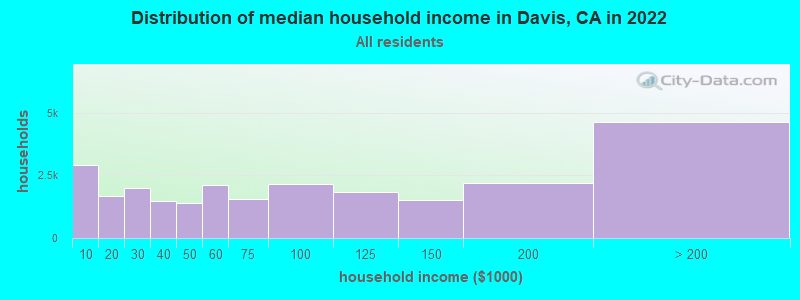
Median household income for houses/condos with a mortgage: $180,540
Median household income for apartments without a mortgage: $94,509
6,930 married couples with children.
2,075 single-parent households (343 men, 1,732 women).
70.3% of residents of Davis speak English at home.
7.3% of residents speak Spanish at home (84% speak English very well, 7% speak English well, 6% speak English not well, 3% don't speak English at all).
5.8% of residents speak other Indo-European language at home (80% speak English very well, 9% speak English well, 9% speak English not well, 2% don't speak English at all).
15.3% of residents speak Asian or Pacific Island language at home (49% speak English very well, 38% speak English well, 7% speak English not well, 5% don't speak English at all).
0.9% of residents speak other language at home (79% speak English very well, 12% speak English well, 9% speak English not well).
Foreign born population: 13,745 (20.5%)
(34.9% of them are naturalized citizens)
Percentage of workers working in this county: 72.7% Number of people working at home: 7,084 (21.2% of all workers)
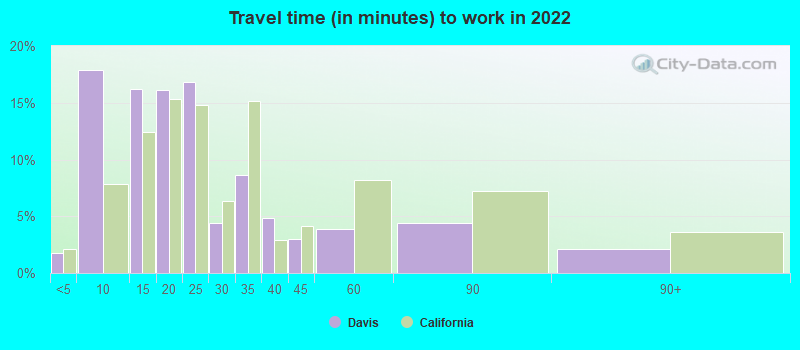
Travel time to work (commute)
Less than 5 minutes: 342
5 to 9 minutes: 3,641
10 to 14 minutes: 5,233
15 to 19 minutes: 6,843
20 to 24 minutes: 3,398
25 to 29 minutes: 1,611
30 to 34 minutes: 2,186
35 to 39 minutes: 502
40 to 44 minutes: 357
45 to 59 minutes: 658
60 to 89 minutes: 1,645
90 or more minutes: 2,134
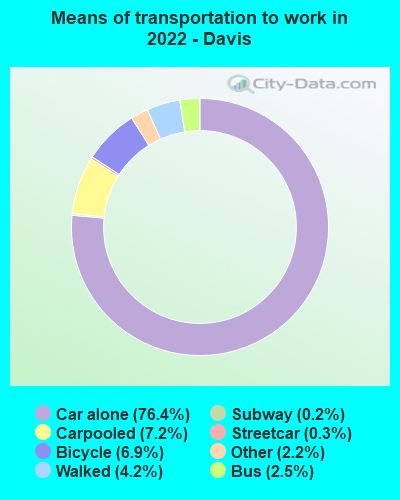
Means of transportation to work:
Drove a car alone: 13,771 (55.3%)
Carpooled: 1,733 (7.0%)
Bus: 236 (0.9%)
Subway or elevated rail: 25 (0.1%)
Long-distance train or commuter rail: 23 (0.1%)
Light rail, streetcar or trolley: 11 (0.0%)
Taxi: 463 (1.9%)
Bicycle: 1,080 (4.3%)
Walked: 697 (2.8%)
Worked at home: 7,084 (28.4%)
Unemployment by race in 2022
Unemployment rate for White non-Hispanic residents
5.3%Males
3.4%Females
Unemployment rate for Black residents
11.3%Males
13.4%Females
Unemployment rate for American Indian and Alaska Native residents
3.1%Males
Unemployment rate for Asian residents
3.2%Males
4.8%Females
Unemployment rate for other race residents
2.5%Males
5.1%Females
Unemployment rate for two or more race residents
6.9%Males
8.8%Females
Unemployment rate for Hispanic or Latino residents
8.0%Males
11.2%Females
Year of entry for the foreign-born population in Davis, California
8,1882010 or later
2,6632000 to 2009
1,8431990 to 1999
3,3561980 to 1989
1,2161970 to 1979
1,023Before 1970
First ancestries reported:
European: 4,384 (11.9%)
English: 1,613 (4.4%)
German: 1,122 (3.0%)
Irish: 1,028 (2.8%)
American: 758 (2.1%)
Italian: 694 (1.9%)
Iranian: 472 (1.3%)
African: 300 (0.8%)
French: 280 (0.8%)
Turkish: 269 (0.7%)
Northern European: 188 (0.5%)
Scotch-Irish: 187 (0.5%)
Dutch: 180 (0.5%)
Swedish: 176 (0.5%)
Eastern European: 171 (0.5%)
Scottish: 162 (0.4%)
Portuguese: 157 (0.4%)
Scandinavian: 145 (0.4%)
Norwegian: 142 (0.4%)
Swiss: 141 (0.4%)
Polish: 138 (0.4%)
British: 130 (0.4%)
Canadian: 125 (0.3%)
Austrian: 115 (0.3%)
Finnish: 108 (0.3%)
French Canadian: 97 (0.3%)
Danish: 93 (0.3%)
Lebanese: 82 (0.2%)
Romanian: 81 (0.2%)
Afghan: 76 (0.2%)
Greek: 72 (0.2%)
Ukrainian: 62 (0.2%)
Russian: 58 (0.2%)
Welsh: 56 (0.2%)
Brazilian: 54 (0.1%)
Sudanese: 53 (0.1%)
Armenian: 51 (0.1%)
Ghanaian: 45 (0.1%)
Nigerian: 39 (0.1%)
Estonian: 32 (0.09%)
Israeli: 31 (0.08%)
Palestinian: 29 (0.08%)
Ethiopian: 28 (0.08%)
Arab: 28 (0.08%)
Hungarian: 25 (0.07%)
Slavic: 22 (0.06%)
Basque: 18 (0.05%)
Slovene: 16 (0.04%)
Yugoslavian: 16 (0.04%)
Serbian: 14 (0.04%)
Jamaican: 12 (0.03%)
Slovak: 11 (0.03%)
Somali: 9 (0.02%)
Iraqi: 9 (0.02%)
Australian: 7 (0.02%)
Guyanese: 7 (0.02%)
Czechoslovakian: 7 (0.02%)
Czech: 7 (0.02%)
Lithuanian: 6 (0.02%)
Croatian: 6 (0.02%)
Belgian: 5 (0.01%)
Most common places of birth for foreign-born residents (%):
China, excluding Hong Kong and Taiwan
Davis:
32.5% (4,583)
California:
6.6% (684,672)
India
Davis:
6.6% (928)
California:
5.2% (539,184)
Mexico
Davis:
6.1% (864)
California:
37.2% (3,881,193)
Korea
Davis:
5.9% (831)
California:
3.0% (315,248)
Iran
Davis:
3.9% (546)
California:
2.0% (206,004)
Taiwan
Davis:
3.1% (442)
California:
1.7% (176,274)
Philippines
Davis:
2.9% (409)
California:
7.8% (818,297)
Japan
Davis:
2.9% (404)
California:
1.0% (103,575)
Turkey
Davis:
2.6% (360)
California:
0.2% (20,474)
Canada
Davis:
2.5% (351)
California:
1.2% (127,477)
Bangladesh
Davis:
1.7% (245)
California:
0.2% (18,366)
Chile
Davis:
1.7% (233)
California:
0.1% (15,357)
Vietnam
Davis:
1.6% (219)
California:
4.9% (512,335)
Place of birth for U.S.-born residents:
This state: 39,911
Other state: 12,799
Northeast: 3,283
Midwest: 3,274
South: 2,874
West: 3,368
64.3% of Davis residents lived in the same house 1 years ago. Out of people who lived in different houses, 35.3% lived in this county. Out of people who lived in different counties, 82.7% lived in California.
Davis:
64.3%
State average:
88.9%
Education attainment for males 25 years and older:
No schooling: 35
Nursery to 4th grade: 0
5th and 6th grade: 98
7th and 8th grade: 129
9th grade: 0
10th grade: 0
11th grade: 93
12th grade, no diploma: 347
High school graduate (or equivalency): 2,145
Less than 1 year of college: 222
Some college more than 1 year, no degree: 1,254
Associate degree: 331
Bachelor's degree: 4,126
Master's degree: 3,134
Professional school degree: 1,661
Doctorate degree: 2,441
Education attainment for females 25 years and older:
No schooling: 131
Nursery to 4th grade: 0
5th and 6th grade: 51
7th and 8th grade: 0
9th grade: 103
10th grade: 145
11th grade: 25
12th grade, no diploma: 227
High school graduate (or equivalency): 1,996
Less than 1 year of college: 578
Some college more than 1 year, no degree: 1,608
Associate degree: 1,302
Bachelor's degree: 5,646
Master's degree: 3,173
Professional school degree: 1,672
Doctorate degree: 1,615
Housing units in structures:
One, detached: 11,071
One, attached: 3,502
Two: 632
3 or 4: 3,038
5 to 9: 2,968
10 to 19: 1,506
20 to 49: 1,161
50 or more: 3,257
Mobile homes: 291
Median worth of mobile homes: $264,900
Housing units lacking complete plumbing facilities in 2022: 0.2%
Housing units lacking complete kitchen facilities in 2022: 1.4%
House/condo owner moved in on average 13 years ago