Dayton, IN (Indiana) Houses and Residents
| Dayton: | $172,842 |
| Indiana: | $208,700 |
Mean price in 2022:
Detached houses: $178,881
Here: $178,881 State: $257,916
Total population: 1,550 (Urban population: 1,108, Rural population: 0)
Houses: 556 (529 occupied: 415 owner occupied, 118 renter occupied)
| % of renters here: | 22% |
| State: | 29% |
Housing density: 536 houses/condos per square mile
Median price asked for vacant for-sale houses and condos in 2022 in this county: $130,989.
Median contract rent in 2022: $700 (lower quartile is $584, upper quartile is $794)
Median rent asked for vacant for-rent units in 2022: $824
Median gross rent in Dayton, IN in 2022: $946
Housing units in Dayton with a mortgage: 305 (20 second mortgage, 0 home equity loan, 20 both second mortgage and home equity loan)
Houses without a mortgage: 5
Median household income for houses/condos with a mortgage: $83,450
Median household income for apartments without a mortgage: $47,619
Median monthly housing costs: $951
Compare current foreclosures near Dayton, IN:
| Photo | Address | Area | Beds / Baths | Price | Details |
|---|---|---|---|---|---|

|
#1
Center St
Mulberry, IN 46058
|
1,949 sq. feet
|
3 baths 4 beds |
$258,900
|
show details |

|
#2
N County Road 400 W
Frankfort, IN 46041
|
1,512 sq. feet
|
1 baths 3 beds |
$147,000
|
show details |

|
#3
Sims St
Frankfort, IN 46041
|
1,092 sq. feet
|
2 baths 2 beds |
$159,900
|
show details |

|
#4
Kossuth St
Lafayette, IN 47905
|
1,486 sq. feet
|
1 baths 3 beds |
show details | |

|
#5
S 30th St
Lafayette, IN 47904
|
624 sq. feet
|
1 baths 2 beds |
show details | |

|
#6
Stair Rd
Lafayette, IN 47905
|
1,178 sq. feet
|
2 baths 3 beds |
show details | |

|
#7
Autumn Ln
Lafayette, IN 47909
|
1,148 sq. feet
|
1 baths 3 beds |
show details | |

|
#8
Milroy St
Frankfort, IN 46041
|
1,220 sq. feet
|
1 baths 3 beds |
show details | |

|
#9
S Wood St
Brookston, IN 47923
|
1,976 sq. feet
|
2 baths 3 beds |
show details | |

|
#10
Hawthorne Ave
Frankfort, IN 46041
|
1,065 sq. feet
|
1 baths 3 beds |
show details |
| Photo | Address | Area | Beds / Baths | Price | Details |
|---|---|---|---|---|---|

|
#11
Evergreen Blvd
Linden, IN 47955
|
1,278 sq. feet
|
2 baths 3 beds |
show details | |

|
#12
N Clay St
Frankfort, IN 46041
|
1,803 sq. feet
|
1 baths 3 beds |
show details | |

|
#13
Delphi Ave
Frankfort, IN 46041
|
1,508 sq. feet
|
1 baths 3 beds |
show details | |

|
#14
W Mulberry Jefferson Rd
Mulberry, IN 46058
|
1,302 sq. feet
|
2 baths 3 beds |
show details | |

|
#15
John St
Frankfort, IN 46041
|
984 sq. feet
|
1 baths 2 beds |
show details | |

|
#16
W 132 N
Delphi, IN 46923
|
1,540 sq. feet
|
2 baths 3 beds |
show details | |

|
#17
S 5th St
Frankfort, IN 46041
|
1,395 sq. feet
|
1 baths 2 beds |
show details | |

|
#18
Gentry St
Frankfort, IN 46041
|
1,092 sq. feet
|
1 baths 3 beds |
show details | |

|
#19
W South St
Frankfort, IN 46041
|
1,000 sq. feet
|
1 baths 3 beds |
show details | |

|
#20
E Main St
Rossville, IN 46065
|
1,880 sq. feet
|
2 baths 3 beds |
show details |
| Photo | Address | Area | Beds / Baths | Price | Details |
|---|---|---|---|---|---|

|
#21
W Jackson St
Frankfort, IN 46041
|
1,064 sq. feet
|
1 baths 3 beds |
show details | |

|
#22
S Wabash St
New Richmond, IN 47967
|
1,275 sq. feet
|
1 baths 3 beds |
show details | |

|
#23
S 2nd St
Frankfort, IN 46041
|
1,836 sq. feet
|
1 baths 2 beds |
show details | |

|
#24
S Williams Rd
Frankfort, IN 46041
|
1,943 sq. feet
|
2 baths 3 beds |
show details | |

|
#25
S Maish Rd
Frankfort, IN 46041
|
2,392 sq. feet
|
1 baths 3 beds |
show details | |

|
#26
Faxon Dr
Lafayette, IN 47905
|
- sq. feet
|
2 baths 3 beds |
show details | |

|
#27
W Meredith St
Frankfort, IN 46041
|
992 sq. feet
|
2 baths 2 beds |
show details | |

|
#28
E Morrison St
Frankfort, IN 46041
|
1,044 sq. feet
|
1 baths 2 beds |
show details | |

|
#29
E Walnut St
Frankfort, IN 46041
|
942 sq. feet
|
1 baths 2 beds |
show details | |

|
#30
W Antioch Rd
Frankfort, IN 46041
|
1,613 sq. feet
|
1 baths 3 beds |
show details |
| Photo | Address | Area | Beds / Baths | Price | Details |
|---|---|---|---|---|---|

|
#31
E Jefferson St
Frankfort, IN 46041
|
1,924 sq. feet
|
1 baths 2 beds |
show details | |

|
#32
N Wildwood Dr
Frankfort, IN 46041
|
4,056 sq. feet
|
3 baths 4 beds |
show details | |

|
#33
E Boone St
Frankfort, IN 46041
|
2,461 sq. feet
|
2 baths 5 beds |
show details | |

|
#34
Plaza Ln
Lafayette, IN 47909
|
- sq. feet
|
- baths - beds |
show details | |

|
#35
N 24th St
Lafayette, IN 47904
|
- sq. feet
|
- baths - beds |
show details | |

|
#36
Woods Edge Ct
West Lafayette, IN 47906
|
- sq. feet
|
- baths - beds |
show details | |

|
#37
Woods Edge Ct
West Lafayette, IN 47906
|
- sq. feet
|
- baths - beds |
show details | |

|
#38
Gainsboro Dr
West Lafayette, IN 47906
|
- sq. feet
|
- baths - beds |
show details | |

|
#39
E 600 N
West Lafayette, IN 47906
|
- sq. feet
|
- baths - beds |
show details | |

|
#40
S Winans St
Battle Ground, IN 47920
|
- sq. feet
|
- baths - beds |
show details |
| Photo | Address | Area | Beds / Baths | Price | Details |
|---|---|---|---|---|---|

|
#41
Old Romney Rd Apt 307
Lafayette, IN 47909
|
- sq. feet
|
- baths - beds |
show details | |

|
#42
Prophets Rock Rd
West Lafayette, IN 47906
|
- sq. feet
|
- baths - beds |
show details | |

|
#43
N 250 W
Rossville, IN 46065
|
- sq. feet
|
- baths - beds |
show details | |

|
#44
Tantara Way, Apt 104
Lafayette, IN 47909
|
- sq. feet
|
- baths - beds |
show details | |

|
#45
Plantation Way
Lafayette, IN 47909
|
- sq. feet
|
- baths - beds |
show details | |

|
#46
Clydesdale Dr
Lafayette, IN 47905
|
- sq. feet
|
- baths - beds |
show details | |

|
#47
Brunswick Dr # B
Lafayette, IN 47909
|
- sq. feet
|
- baths - beds |
show details | |

|
#48
E 900 N
West Lafayette, IN 47906
|
- sq. feet
|
- baths - beds |
show details | |

|
#49
Woods Edge Ct
West Lafayette, IN 47906
|
- sq. feet
|
- baths - beds |
show details | |

|
Check over 1 million property listings on Foreclosure.com!
|
browse all offers | |||

Latest news about housing in Dayton, IN collected exclusively by city-data.com from local newspapers, TV, and radio stations


Median year apartment built: 1982
Household type by relationship:
Households: 1,109- Male householders: 240 (49 living alone), Female householders: 279 (99 living alone)
219 spouses (217 opposite-sex spouses), 39 unmarried partners, (35 opposite-sex unmarried partners), 276 children (235 natural, 3 adopted, 38 stepchildren), 2 grandchildren, 12 brothers or sisters, 17 parents, 0 foster children, 5 other relatives, 7 non-relatives
- In group quarters: 11
Size of family households: 188 2-persons, 90 3-persons, 41 4-persons, 36 5-persons.
Size of nonfamily households: 151 1-person, 26 2-persons.
160 married couples with children.
88 single-parent households (12 men, 76 women).
96.0% of residents of Dayton speak English at home.
2.7% of residents speak Spanish at home (48% speak English very well, 41% speak English well, 10% speak English not well).
0.6% of residents speak other Indo-European language at home (33% speak English very well, 67% speak English well).
Foreign born population: 13 (1.2%)
(107.7% of them are naturalized citizens)
| Here: | 6.6 |
| State: | 6.6 |
| Here: | 4.7 |
| State: | 4.3 |

- Bedrooms in owner-occupied houses and condos in Dayton, Indiana
- 0no bedroom
- 21 bedroom
- 342 bedrooms
- 3093 bedrooms
- 684 bedrooms
- 25+ bedrooms

- Bedrooms in renter-occupied apartments in Dayton, Indiana
- 0no bedroom
- 231 bedroom
- 542 bedrooms
- 413 bedrooms
- 04 bedrooms
- 05+ bedrooms

- Cars and other vehicles available in Dayton in owner-occupied houses/condos
- 4no vehicle
- 1321 vehicle
- 1802 vehicles
- 863 vehicles
- 74 vehicles
- 65+ vehicles

- Cars and other vehicles available in Dayton in renter-occupied apartments
- 2no vehicle
- 811 vehicle
- 282 vehicles
- 43 vehicles
- 34 vehicles
- 05+ vehicles

- Rooms in owner-occupied houses in Dayton, Indiana
- 01 room
- 02 rooms
- 23 rooms
- 184 rooms
- 765 rooms
- 1016 rooms
- 847 rooms
- 578 rooms
- 799+ rooms

- Rooms in renter-occupied apartments in Dayton, Indiana
- 01 room
- 02 rooms
- 113 rooms
- 304 rooms
- 435 rooms
- 236 rooms
- 107 rooms
- 08 rooms
- 19+ rooms


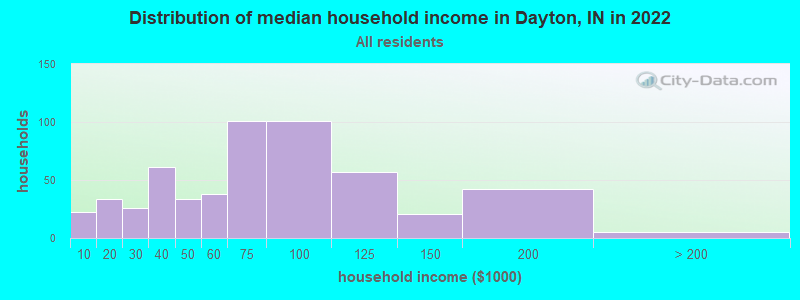
Dayton, IN household income distribution

- 22Less than $10,000
- 34$10,000 to $19,999
- 26$20,000 to $29,999
- 61$30,000 to $39,999
- 34$40,000 to $49,999
- 38$50,000 to $59,999
- 101$60,000 to $74,999
- 101$75,000 to $99,999
- 57$100,000 to $124,999
- 21$125,000 to $149,999
- 42$150,000 to $199,999
- 5$200,000 or more
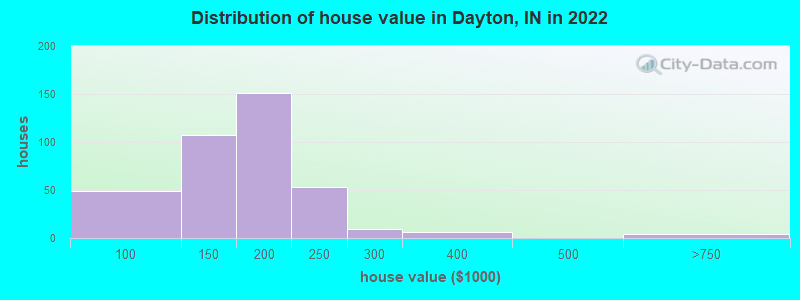
Home value of owner - occupied houses in 2022 in Dayton, IN
-
- 26$70,000 to $79,999
- 7$80,000 to $89,999
- 15$90,000 to $99,999
- 35$100,000 to $124,999
- 71$125,000 to $149,999
- 80$150,000 to $174,999
- 70$175,000 to $199,999
- 52$200,000 to $249,999
- 9$250,000 to $299,999
- 6$300,000 to $399,999
- 3$500,000 to $749,999
- 1$750,000 to $999,999
Rent paid by renters in 2022 in Dayton, IN
-
- 1$150 to $199
- 2$200 to $249
- 11$300 to $349
- 11$550 to $599
- 10$600 to $649
- 18$650 to $699
- 23$700 to $749
- 2$800 to $899
- 5$900 to $999
- 10$1,000 to $1,249
- 4$1,250 to $1,499


Percentage of workers working in this county: 91.6%
Number of people working at home: 56 (10.0% of all workers)
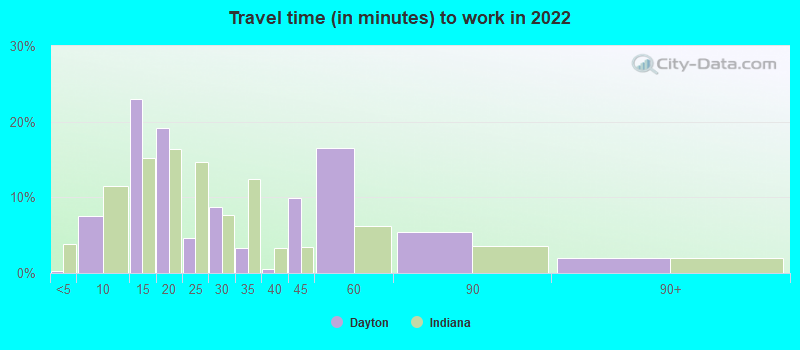
Travel time to work (commute)
- Less than 5 minutes: 19
- 5 to 9 minutes: 80
- 10 to 14 minutes: 131
- 15 to 19 minutes: 111
- 20 to 24 minutes: 54
- 25 to 29 minutes: 15
- 30 to 34 minutes: 44
- 35 to 39 minutes: 0
- 40 to 44 minutes: 0
- 45 to 59 minutes: 2
- 60 to 89 minutes: 8
- 90 or more minutes: 24
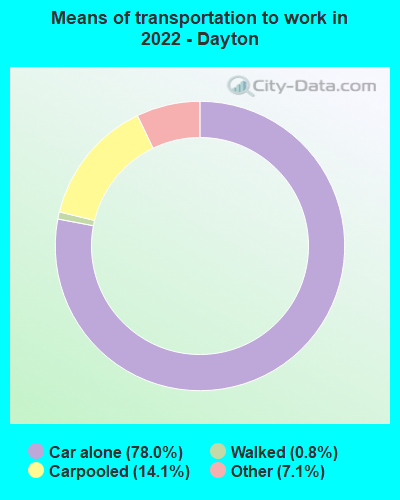
Means of transportation to work:
- Drove a car alone: 717 (71.3%)
- Carpooled: 143 (14.2%)
- Taxi: 70 (7.0%)
- Walked: 7 (0.7%)
- Worked at home: 71 (7.1%)

- Unemployment by race in 2022
- Unemployment rate for White non-Hispanic residents
- 1.4%Males
- Unemployment rate for other race residents
- 68.2%Females
- Unemployment rate for Hispanic or Latino residents
- 46.6%Females

- Year of entry for the foreign-born population in Dayton, Indiana
- 02010 or later
- 42000 to 2009
- 51990 to 1999
- 01980 to 1989
- 41970 to 1979
- 2Before 1970
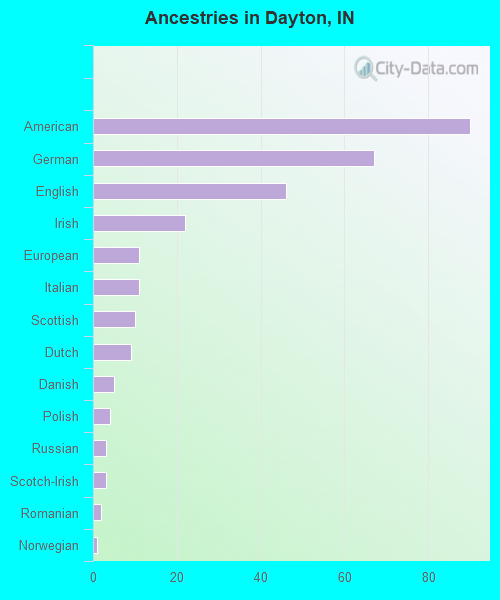
First ancestries reported:
- American: 90 (22.1%)
- German: 67 (16.5%)
- English: 46 (11.3%)
- Irish: 22 (5.4%)
- European: 11 (2.7%)
- Italian: 11 (2.7%)
- Scottish: 10 (2.5%)
- Dutch: 9 (2.2%)
- Danish: 5 (1.2%)
- Polish: 4 (1.0%)
- Russian: 3 (0.7%)
- Scotch-Irish: 3 (0.7%)
- Romanian: 2 (0.5%)
- Norwegian: 1 (0.2%)
Most common places of birth for foreign-born residents (%):
| Dayton: | 42.9% (6) |
| Indiana: | 27.0% (101,996) |
| Dayton: | 28.6% (4) |
| Indiana: | 0.0% (41) |
| Dayton: | 14.3% (2) |
| Indiana: | 2.2% (8,253) |
Place of birth for U.S.-born residents:
- This state: 801
- Other state: 287
- Northeast: 32
- Midwest: 173
- South: 43
- West: 33
82.6% of Dayton residents lived in the same house 1 years ago.
Out of people who lived in different houses, 30.6% lived in this county.
Out of people who lived in different counties, 54.2% lived in Indiana.
| Dayton: | 82.6% |
| State average: | 87.1% |
Education attainment for males 25 years and older:
- No schooling: 0
- Nursery to 4th grade: 0
- 5th and 6th grade: 2
- 7th and 8th grade: 12
- 9th grade: 10
- 10th grade: 3
- 11th grade: 1
- 12th grade, no diploma: 13
- High school graduate (or equivalency): 118
- Less than 1 year of college: 19
- Some college more than 1 year, no degree: 55
- Associate degree: 41
- Bachelor's degree: 31
- Master's degree: 30
- Professional school degree: 10
- Doctorate degree: 0

Education attainment for females 25 years and older:
- No schooling: 0
- Nursery to 4th grade: 0
- 5th and 6th grade: 0
- 7th and 8th grade: 11
- 9th grade: 5
- 10th grade: 3
- 11th grade: 0
- 12th grade, no diploma: 0
- High school graduate (or equivalency): 145
- Less than 1 year of college: 37
- Some college more than 1 year, no degree: 84
- Associate degree: 68
- Bachelor's degree: 62
- Master's degree: 22
- Professional school degree: 0
- Doctorate degree: 3


Housing units in structures:
- One, detached: 472
- One, attached: 5
- Two: 56
- 3 or 4: 16
- 5 to 9: 6
House/condo owner moved in on average 9 years ago
Renter moved in on average 5 years ago

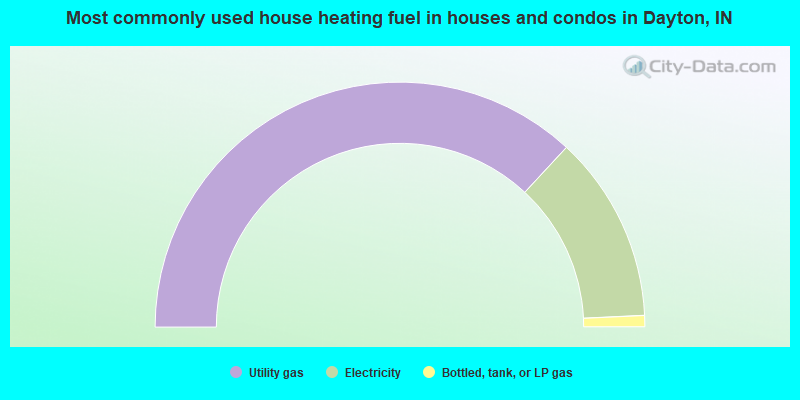
- 73.8%Utility gas
- 24.7%Electricity
- 1.5%Bottled, tank, or LP gas
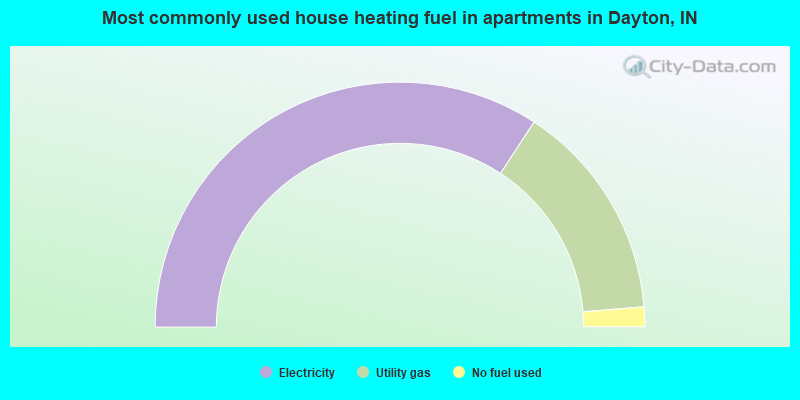
- 68.4%Electricity
- 28.9%Utility gas
- 2.6%No fuel used
Private vs. public school enrollment:
| Here: | 4.6% |
| Indiana: | 14.9% |
| Here: | 10.3% |
| Indiana: | 11.4% |
| Here: | 3.1% |
| Indiana: | 22.3% |


