Housing density: 1,018 houses/condos per square mile
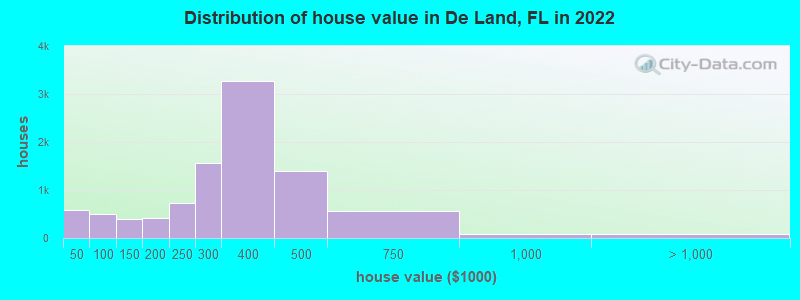
Median price asked for vacant for-sale houses and condos in 2022: $144,699.
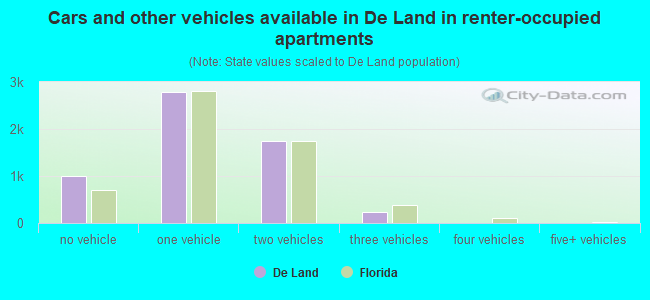
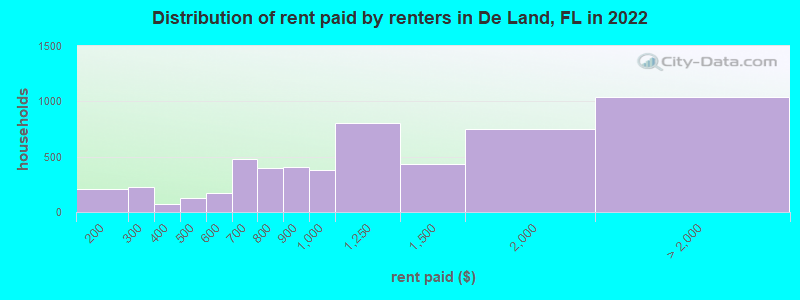
Median contract rent in 2022: $1,072 (lower quartile is $814, upper quartile is $1,518)
Median rent asked for vacant for-rent units in 2022: $1,961
Median gross rent in De Land, FL in 2022: $1,271
Housing units in De Land with a mortgage: 5,224 (236 second mortgage, 0 home equity loan, 160 both second mortgage and home equity loan) Houses without a mortgage: 61
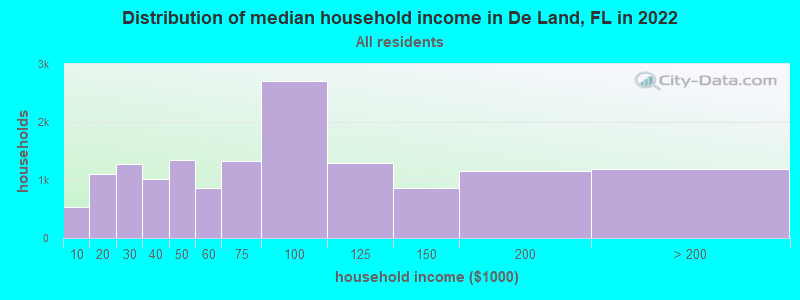
Median household income for houses/condos with a mortgage: $100,523
Median household income for apartments without a mortgage: $74,447
5,036 married couples with children.
2,801 single-parent households (427 men, 2,374 women).
85.3% of residents of De Land speak English at home.
12.0% of residents speak Spanish at home (72% speak English very well, 19% speak English well, 5% speak English not well, 4% don't speak English at all).
1.8% of residents speak other Indo-European language at home (90% speak English very well, 6% speak English well, 4% speak English not well).
1.0% of residents speak Asian or Pacific Island language at home (62% speak English very well, 14% speak English well, 24% don't speak English at all).
0.3% of residents speak other language at home (73% speak English very well, 27% speak English well).
Foreign born population: 2,924 (7.3%)
(60.6% of them are naturalized citizens)
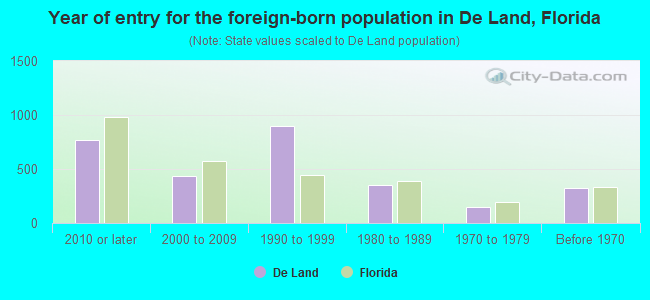
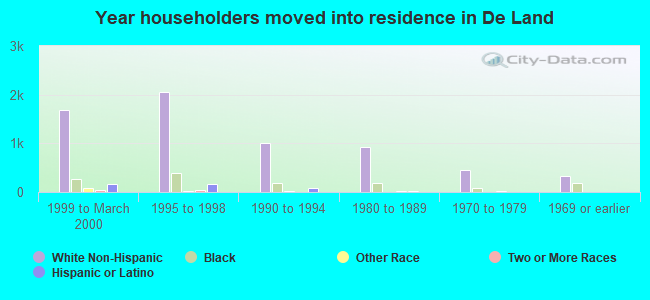
Year of entry for the foreign-born population in De Land, Florida
7652010 or later
4382000 to 2009
8971990 to 1999
3521980 to 1989
1451970 to 1979
321Before 1970
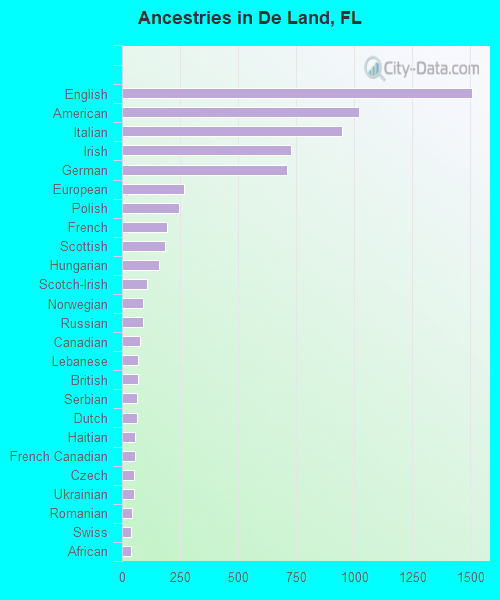
First ancestries reported:
English: 1,506 (6.6%)
American: 1,020 (4.5%)
Italian: 950 (4.2%)
Irish: 727 (3.2%)
German: 709 (3.1%)
European: 269 (1.2%)
Polish: 244 (1.1%)
French: 192 (0.8%)
Scottish: 187 (0.8%)
Hungarian: 158 (0.7%)
Scotch-Irish: 107 (0.5%)
Norwegian: 92 (0.4%)
Russian: 90 (0.4%)
Canadian: 78 (0.3%)
Lebanese: 70 (0.3%)
British: 67 (0.3%)
Serbian: 64 (0.3%)
Dutch: 63 (0.3%)
Haitian: 56 (0.2%)
French Canadian: 54 (0.2%)
Czech: 50 (0.2%)
Ukrainian: 50 (0.2%)
Romanian: 45 (0.2%)
Swiss: 40 (0.2%)
African: 39 (0.2%)
Scandinavian: 33 (0.1%)
Swedish: 33 (0.1%)
Portuguese: 32 (0.1%)
Greek: 30 (0.1%)
Brazilian: 29 (0.1%)
Eastern European: 29 (0.1%)
Slovak: 29 (0.1%)
Trinidadian and Tobagonian: 25 (0.1%)
Welsh: 24 (0.1%)
Danish: 23 (0.1%)
Barbadian: 16 (0.07%)
Guyanese: 15 (0.07%)
Palestinian: 11 (0.05%)
Finnish: 10 (0.04%)
Lithuanian: 9 (0.04%)
West Indian: 9 (0.04%)
Croatian: 8 (0.04%)
Somali: 7 (0.03%)
Austrian: 7 (0.03%)
Albanian: 3 (0.01%)
Most common places of birth for foreign-born residents (%):
Mexico
De Land:
23.4% (739)
Florida:
5.6% (257,152)
Czechoslovakia (includes Czech Republic and Slovakia)
De Land:
5.5% (175)
Florida:
0.2% (8,038)
Venezuela
De Land:
5.3% (167)
Florida:
5.7% (262,042)
Canada
De Land:
5.0% (158)
Florida:
2.4% (109,132)
Vietnam
De Land:
4.2% (134)
Florida:
1.3% (60,604)
Brazil
De Land:
4.1% (129)
Florida:
2.7% (122,906)
Germany
De Land:
4.1% (128)
Florida:
1.2% (54,272)
Haiti
De Land:
3.9% (123)
Florida:
7.5% (342,375)
Korea
De Land:
3.5% (111)
Florida:
0.4% (19,445)
North Macedonia (Macedonia)
De Land:
3.0% (95)
Florida:
0.0% (1,035)
China, excluding Hong Kong and Taiwan
De Land:
2.7% (84)
Florida:
1.2% (56,071)
United Kingdom, excluding England and Scotland
De Land:
1.8% (57)
Florida:
0.7% (34,227)
India
De Land:
1.8% (57)
Florida:
2.1% (94,349)
Dominican Republic
De Land:
1.7% (53)
Florida:
3.0% (137,727)
Peru
De Land:
1.7% (53)
Florida:
2.1% (96,693)
Cuba
De Land:
1.6% (52)
Florida:
22.0% (1,006,576)
Place of birth for U.S.-born residents:
This state: 16,841
Other state: 17,990
Northeast: 6,776
Midwest: 5,082
South: 4,835
West: 1,346
81.4% of De Land residents lived in the same house 1 years ago. Out of people who lived in different houses, 32.3% lived in this county. Out of people who lived in different counties, 58.4% lived in Florida.
De Land:
81.4%
State average:
86.3%
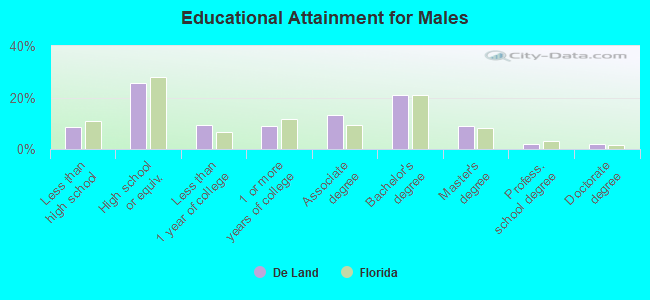
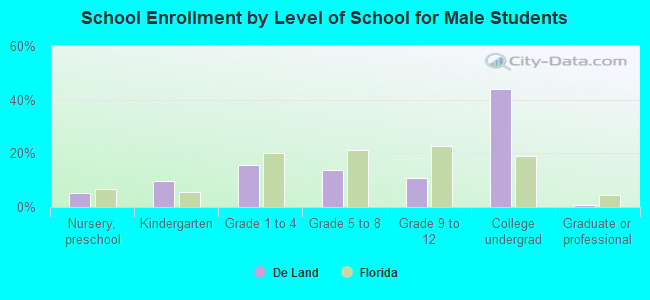
Education attainment for males 25 years and older:
No schooling: 251
Nursery to 4th grade: 9
5th and 6th grade: 42
7th and 8th grade: 98
9th grade: 161
10th grade: 102
11th grade: 97
12th grade, no diploma: 204
High school graduate (or equivalency): 2,855
Less than 1 year of college: 1,047
Some college more than 1 year, no degree: 997
Associate degree: 1,466
Bachelor's degree: 2,316
Master's degree: 999
Professional school degree: 232
Doctorate degree: 235
Education attainment for females 25 years and older:
No schooling: 257
Nursery to 4th grade: 0
5th and 6th grade: 92
7th and 8th grade: 24
9th grade: 70
10th grade: 134
11th grade: 125
12th grade, no diploma: 147
High school graduate (or equivalency): 3,946
Less than 1 year of college: 1,102
Some college more than 1 year, no degree: 1,791
Associate degree: 2,077
Bachelor's degree: 3,051
Master's degree: 1,563
Professional school degree: 159
Doctorate degree: 426
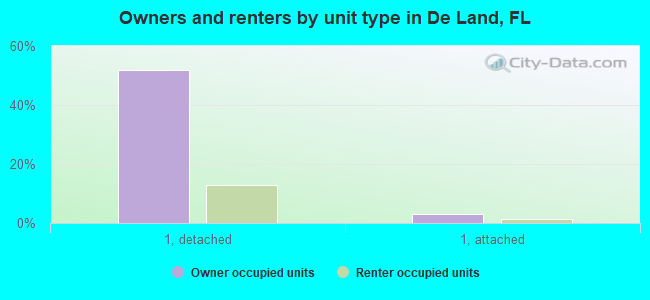
Housing units in structures:
One, detached: 10,467
One, attached: 599
Two: 426
3 or 4: 476
5 to 9: 1,164
10 to 19: 242
20 to 49: 465
50 or more: 1,258
Mobile homes: 1,062
Median worth of mobile homes: $55,581
Housing units lacking complete plumbing facilities in 2022: 0.4%
Housing units lacking complete kitchen facilities in 2022: 1.4%