De Land Southwest, FL (Florida) Houses and Residents
| De Land Southwest: | $346,515 |
| Florida: | $354,100 |
Mean price in 2022:
Detached houses: $148,329
Here: $148,329 State: $500,941 Mobile homes: $142,487
Here: $142,487 State: $113,202
Total population: 1,052 (All urban)
Houses: 519 (424 occupied: 228 owner occupied, 199 renter occupied)
| % of renters here: | 47% |
| State: | 33% |
Housing density: 827 houses/condos per square mile
Median price asked for vacant for-sale houses and condos in 2022 in this county: $206,715.
Median contract rent in 2022: $1,009 (lower quartile is $676, upper quartile is $1,120)
Median rent asked for vacant for-rent units in 2022: $1,172
Median gross rent in De Land Southwest, FL in 2022: $1,117
Housing units in De Land Southwest with a mortgage: 80 (0 second mortgage, 0 home equity loan, 0 both second mortgage and home equity loan)
Houses without a mortgage: 0


Median year apartment built: 1965
Household type by relationship:
Households: 1,278- Male householders: 338 (67 living alone), Female householders: 89 (41 living alone)
89 spouses (89 opposite-sex spouses), 123 unmarried partners, (123 opposite-sex unmarried partners), 434 children (434 natural, 0 adopted, 0 stepchildren), 0 grandchildren, 54 brothers or sisters, 58 parents, 0 foster children, 51 other relatives, 39 non-relatives
Size of family households: 72 2-persons, 73 3-persons, 15 5-persons, 63 6-persons, 7 7-or-more-persons.
Size of nonfamily households: 110 1-person, 76 2-persons, 1 3-persons.
36 married couples with children.
307 single-parent households (307 men, 0 women).
75.8% of residents of De Land Southwest speak English at home.
23.1% of residents speak Spanish at home (79% speak English very well, 9% speak English well, 7% speak English not well, 6% don't speak English at all).
Foreign born population: 69 (5.4%)
(53.6% of them are naturalized citizens)
| Here: | 5.1 |
| State: | 5.9 |
| Here: | 4.4 |
| State: | 4.2 |

- Bedrooms in owner-occupied houses and condos in De Land Southwest, Florida
- 0no bedroom
- 01 bedroom
- 1282 bedrooms
- 933 bedrooms
- 04 bedrooms
- 85+ bedrooms

- Bedrooms in renter-occupied apartments in De Land Southwest, Florida
- 0no bedroom
- 281 bedroom
- 952 bedrooms
- 23 bedrooms
- 754 bedrooms
- 05+ bedrooms

- Cars and other vehicles available in De Land Southwest in owner-occupied houses/condos
- 40no vehicle
- 461 vehicle
- 842 vehicles
- 03 vehicles
- 594 vehicles
- 05+ vehicles

- Cars and other vehicles available in De Land Southwest in renter-occupied apartments
- 46no vehicle
- 551 vehicle
- 992 vehicles
- 03 vehicles
- 04 vehicles
- 05+ vehicles

- Rooms in owner-occupied houses in De Land Southwest, Florida
- 01 room
- 02 rooms
- 03 rooms
- 04 rooms
- 1575 rooms
- 126 rooms
- 517 rooms
- 88 rooms
- 09+ rooms

- Rooms in renter-occupied apartments in De Land Southwest, Florida
- 01 room
- 282 rooms
- 433 rooms
- 274 rooms
- 825 rooms
- 26 rooms
- 07 rooms
- 188 rooms
- 09+ rooms


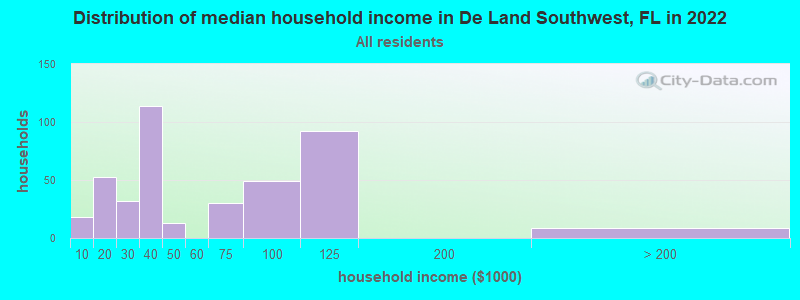
De Land Southwest, FL household income distribution

- 18Less than $10,000
- 53$10,000 to $19,999
- 32$20,000 to $29,999
- 114$30,000 to $39,999
- 13$40,000 to $49,999
- 30$60,000 to $74,999
- 49$75,000 to $99,999
- 92$100,000 to $124,999
- 9$200,000 or more
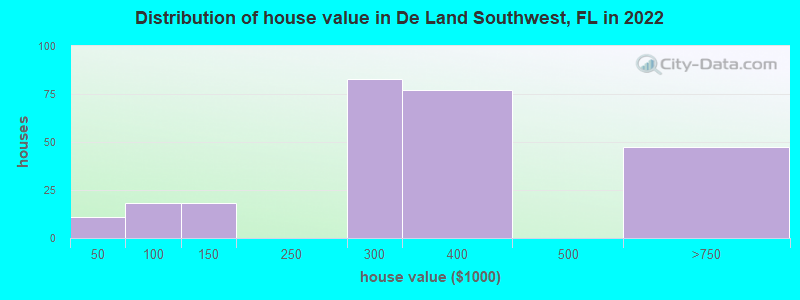
Home value of owner - occupied houses in 2022 in De Land Southwest, FL
-
- 10Less than $10,000
- 18$60,000 to $69,999
- 14$100,000 to $124,999
- 3$125,000 to $149,999
- 82$250,000 to $299,999
- 77$300,000 to $399,999
- 47$500,000 to $749,999
Rent paid by renters in 2022 in De Land Southwest, FL
-
- 48$600 to $649
- 7$700 to $749
- 14$800 to $899
- 59$900 to $999
- 1No cash rent


Percentage of workers working in this county: 94.2%
Number of people working at home: 34 (7.6% of all workers)
Travel time to work (commute)
- Less than 5 minutes: 29
- 5 to 9 minutes: 40
- 10 to 14 minutes: 7
- 15 to 19 minutes: 9
- 20 to 24 minutes: 50
- 25 to 29 minutes: 49
- 30 to 34 minutes: 0
- 35 to 39 minutes: 0
- 40 to 44 minutes: 126
- 45 to 59 minutes: 59
- 60 to 89 minutes: 35
- 90 or more minutes: 0
Means of transportation to work:
- Drove a car alone: 202 (65.2%)
- Carpooled: 74 (23.9%)
- Walked: 11 (3.5%)
- Worked at home: 23 (7.4%)

- Unemployment by race in 2022
- Unemployment rate for White non-Hispanic residents
- 2.5%Females

- Year of entry for the foreign-born population in De Land Southwest, Florida
- 02010 or later
- 02000 to 2009
- 611990 to 1999
- 01980 to 1989
- 51970 to 1979
- 31Before 1970

First ancestries reported:
- American: 24 (2.8%)
- English: 8 (0.9%)
Most common places of birth for foreign-born residents (%):
| De Land Southwest: | 77.0% (57) |
| Florida: | 5.6% (257,152) |
| De Land Southwest: | 16.2% (12) |
| Florida: | 0.2% (9,122) |
Place of birth for U.S.-born residents:
- This state: 883
- Other state: 249
- Northeast: 233
- Midwest: 0
- South: 2
- West: 7
100.4% of De Land Southwest residents lived in the same house 1 years ago.
Out of people who lived in different houses, 16.7% lived in this county.
Out of people who lived in different counties, 100.0% lived in Florida.
| De Land Southwest: | 100.4% |
| State average: | 86.3% |
Education attainment for males 25 years and older:
- No schooling: 0
- Nursery to 4th grade: 0
- 5th and 6th grade: 0
- 7th and 8th grade: 122
- 9th grade: 0
- 10th grade: 39
- 11th grade: 41
- 12th grade, no diploma: 28
- High school graduate (or equivalency): 123
- Less than 1 year of college: 29
- Some college more than 1 year, no degree: 0
- Associate degree: 6
- Bachelor's degree: 25
- Master's degree: 0
- Professional school degree: 0
- Doctorate degree: 0

Education attainment for females 25 years and older:
- No schooling: 40
- Nursery to 4th grade: 0
- 5th and 6th grade: 0
- 7th and 8th grade: 0
- 9th grade: 0
- 10th grade: 0
- 11th grade: 26
- 12th grade, no diploma: 15
- High school graduate (or equivalency): 110
- Less than 1 year of college: 25
- Some college more than 1 year, no degree: 53
- Associate degree: 59
- Bachelor's degree: 10
- Master's degree: 69
- Professional school degree: 0
- Doctorate degree: 0


Housing units in structures:
- One, detached: 322
- Mobile homes: 196
House/condo owner moved in on average 15 years ago
Renter moved in on average 2 years ago

Private vs. public school enrollment:
| Here: | 8.9% |
| Florida: | 15.8% |
| Here: | 0.0% |
| Florida: | 12.9% |
| Here: | 0.0% |
| Florida: | 23.6% |


