De Soto, IA (Iowa) Houses and Residents
| De Soto: | $221,785 |
| Iowa: | $194,600 |
Mean price in 2022:
Detached houses: $190,067
Here: $190,067 State: $245,224 Mobile homes: $53,292
Here: $53,292 State: $51,271
Total population: 1,098 (Urban population: 0, Rural population: 1,016 (4 farm, 1,012 nonfarm))
Houses: 424 (378 occupied: 314 owner occupied, 63 renter occupied)
| % of renters here: | 17% |
| State: | 28% |
Housing density: 286 houses/condos per square mile
Median price asked for vacant for-sale houses and condos in 2022: $80,056.
Median contract rent in 2022: $692 (lower quartile is $563, upper quartile is $803)
Median rent asked for vacant for-rent units in 2022: $1,046
Median gross rent in De Soto, IA in 2022: $909
Housing units in De Soto with a mortgage: 180 (14 second mortgage, 14 home equity loan, 6 both second mortgage and home equity loan)
Houses without a mortgage: 9
Median household income for houses/condos with a mortgage: $124,357
Median household income for apartments without a mortgage: $67,213
Median monthly housing costs: $1,121
Compare current foreclosures near De Soto, IA:
| Photo | Address | Area | Beds / Baths | Price | Details |
|---|---|---|---|---|---|

|
#1
Sunset Ter
Windsor Heights, IA 50324
|
1,120 sq. feet
|
2 baths 3 beds |
show details | |

|
#2
E Jefferson St
Winterset, IA 50273
|
1,440 sq. feet
|
1 baths 3 beds |
show details | |

|
#3
SE Cardinal Ln
Waukee, IA 50263
|
4,770 sq. feet
|
3 baths 4 beds |
show details | |

|
#4
3rd St
West Des Moines, IA 50265
|
1,635 sq. feet
|
1 baths 3 beds |
show details | |

|
#5
Wildflower Ln
Urbandale, IA 50322
|
1,527 sq. feet
|
2 baths 3 beds |
show details | |

|
#6
Kingman Dr
West Des Moines, IA 50266
|
2,206 sq. feet
|
1 baths 3 beds |
show details | |

|
#7
Stone Creek Ct
West Des Moines, IA 50266
|
1,302 sq. feet
|
1 baths 2 beds |
show details | |

|
#8
Hammontree Dr
Urbandale, IA 50322
|
2,263 sq. feet
|
1 baths 3 beds |
show details | |

|
#9
NW Morningside Ct
Grimes, IA 50111
|
1,614 sq. feet
|
2 baths 3 beds |
show details | |

|
#10
Westown Pkwy Unit 20110
West Des Moines, IA 50266
|
1,215 sq. feet
|
1 baths 3 beds |
show details |
| Photo | Address | Area | Beds / Baths | Price | Details |
|---|---|---|---|---|---|

|
#11
Westown Pkwy Unit 21109
West Des Moines, IA 50266
|
1,215 sq. feet
|
1 baths 3 beds |
show details | |

|
#12
NW 80th Ct
Clive, IA 50325
|
1,785 sq. feet
|
2 baths 3 beds |
show details | |

|
#13
Prospect Ave
West Des Moines, IA 50265
|
1,957 sq. feet
|
1 baths 3 beds |
show details | |

|
#14
77th St
Urbandale, IA 50322
|
1,841 sq. feet
|
1 baths 4 beds |
show details | |

|
#15
87th St
Urbandale, IA 50322
|
1,505 sq. feet
|
2 baths 2 beds |
show details | |

|
#16
1st St
Redfield, IA 50233
|
912 sq. feet
|
1 baths 3 beds |
show details | |

|
#17
SE Glenstone Dr Unit 223
Grimes, IA 50111
|
1,712 sq. feet
|
2 baths 2 beds |
show details | |

|
#18
NW 157th St
Clive, IA 50325
|
928 sq. feet
|
2 baths 4 beds |
show details | |

|
#19
Cherry St
Dallas Center, IA 50063
|
1,762 sq. feet
|
1 baths 3 beds |
show details | |

|
#20
SE Little Beaver Ct
Grimes, IA 50111
|
1,016 sq. feet
|
2 baths 2 beds |
show details |
| Photo | Address | Area | Beds / Baths | Price | Details |
|---|---|---|---|---|---|

|
#21
30th Ave
Norwalk, IA 50211
|
1,228 sq. feet
|
2 baths 4 beds |
show details | |

|
#22
Sugar Grove Ave
Dallas Center, IA 50063
|
996 sq. feet
|
1 baths 2 beds |
show details | |

|
#23
Woodland Ave Unit 207
West Des Moines, IA 50266
|
1,196 sq. feet
|
1 baths 2 beds |
show details | |

|
#24
NW Norton Cir
Grimes, IA 50111
|
1,480 sq. feet
|
1 baths 3 beds |
show details | |

|
#25
46th Pl
West Des Moines, IA 50265
|
2,424 sq. feet
|
2 baths 4 beds |
show details | |

|
#26
7th St
West Des Moines, IA 50265
|
1,302 sq. feet
|
1 baths 4 beds |
show details | |

|
#27
Valdez Dr
Urbandale, IA 50322
|
1,420 sq. feet
|
1 baths 2 beds |
show details | |

|
#28
Country Club Blvd
Clive, IA 50325
|
2,494 sq. feet
|
2 baths 4 beds |
show details | |

|
#29
6th St
West Des Moines, IA 50265
|
1,109 sq. feet
|
1 baths 3 beds |
show details | |

|
#30
Greenbelt Dr
Urbandale, IA 50323
|
1,056 sq. feet
|
2 baths 2 beds |
show details |
| Photo | Address | Area | Beds / Baths | Price | Details |
|---|---|---|---|---|---|

|
#31
SE Little Beaver Dr
Grimes, IA 50111
|
1,334 sq. feet
|
1 baths 3 beds |
show details | |

|
#32
Prairie Pkwy
Johnston, IA 50131
|
1,739 sq. feet
|
2 baths 2 beds |
show details | |

|
#33
SW 62nd St
Des Moines, IA 50312
|
976 sq. feet
|
1 baths 2 beds |
show details | |

|
#34
67th St Unit 110
West Des Moines, IA 50266
|
999 sq. feet
|
1 baths 2 beds |
show details | |

|
#35
Mcwilliams Dr
Johnston, IA 50131
|
2,079 sq. feet
|
2 baths 3 beds |
show details | |

|
#36
Hillsdale Dr
Urbandale, IA 50322
|
1,658 sq. feet
|
2 baths 3 beds |
show details | |

|
#37
S 14th St
Adel, IA 50003
|
1,371 sq. feet
|
1 baths 3 beds |
show details | |

|
#38
Hyvue St
Adel, IA 50003
|
1,500 sq. feet
|
1 baths 3 beds |
show details | |

|
#39
Horse N Buggy Dr
Adel, IA 50003
|
1,040 sq. feet
|
1 baths 3 beds |
show details | |

|
#40
Hickory Ln
Urbandale, IA 50322
|
1,907 sq. feet
|
2 baths 3 beds |
show details |
| Photo | Address | Area | Beds / Baths | Price | Details |
|---|---|---|---|---|---|

|
#41
Brookview Dr
West Des Moines, IA 50265
|
1,992 sq. feet
|
1 baths 3 beds |
show details | |

|
#42
Candlewick Dr
Norwalk, IA 50211
|
1,060 sq. feet
|
2 baths 3 beds |
show details | |

|
#43
34th Pl
West Des Moines, IA 50265
|
2,102 sq. feet
|
2 baths 3 beds |
show details | |

|
#44
Franklin Ave
Urbandale, IA 50322
|
936 sq. feet
|
2 baths 2 beds |
show details | |

|
#45
Sutton Dr # 4
Urbandale, IA 50322
|
864 sq. feet
|
1 baths 2 beds |
show details | |

|
#46
Maple St
West Des Moines, IA 50265
|
864 sq. feet
|
1 baths 2 beds |
show details | |

|
#47
Sunset Ter
Windsor Heights, IA 50324
|
1,606 sq. feet
|
1 baths 3 beds |
show details | |

|
#48
52nd St
West Des Moines, IA 50265
|
3,133 sq. feet
|
2 baths 4 beds |
show details | |

|
#49
Valley Ridge Ct
West Des Moines, IA 50265
|
4,373 sq. feet
|
3 baths 4 beds |
show details | |

|
Check over 1 million property listings on Foreclosure.com!
|
browse all offers | |||


Median year apartment built: 1968
Household type by relationship:
Households: 995- Male householders: 194 (34 living alone), Female householders: 184 (41 living alone)
217 spouses (217 opposite-sex spouses), 43 unmarried partners, (43 opposite-sex unmarried partners), 323 children (303 natural, 0 adopted, 20 stepchildren), 4 grandchildren, 5 brothers or sisters, 0 parents, 0 foster children, 1 other relatives, 21 non-relatives
Size of family households: 119 2-persons, 81 3-persons, 53 4-persons, 17 5-persons, 4 6-persons, 3 7-or-more-persons.
Size of nonfamily households: 74 1-person, 24 2-persons.
210 married couples with children.
72 single-parent households (34 men, 38 women).
94.2% of residents of De Soto speak English at home.
5.0% of residents speak other Indo-European language at home (81% speak English very well, 19% speak English well).
Foreign born population: 76 (7.6%)
(40.8% of them are naturalized citizens)
| Here: | 6.4 |
| State: | 6.8 |
| Here: | 5.7 |
| State: | 4.2 |

- Bedrooms in owner-occupied houses and condos in De Soto, Iowa
- 0no bedroom
- 01 bedroom
- 752 bedrooms
- 1713 bedrooms
- 574 bedrooms
- 125+ bedrooms

- Bedrooms in renter-occupied apartments in De Soto, Iowa
- 0no bedroom
- 01 bedroom
- 162 bedrooms
- 473 bedrooms
- 04 bedrooms
- 05+ bedrooms

- Cars and other vehicles available in De Soto in owner-occupied houses/condos
- 10no vehicle
- 291 vehicle
- 1162 vehicles
- 923 vehicles
- 454 vehicles
- 235+ vehicles

- Cars and other vehicles available in De Soto in renter-occupied apartments
- 9no vehicle
- 261 vehicle
- 172 vehicles
- 103 vehicles
- 04 vehicles
- 25+ vehicles

- Rooms in owner-occupied houses in De Soto, Iowa
- 01 room
- 02 rooms
- 03 rooms
- 344 rooms
- 745 rooms
- 806 rooms
- 297 rooms
- 388 rooms
- 599+ rooms

- Rooms in renter-occupied apartments in De Soto, Iowa
- 01 room
- 02 rooms
- 03 rooms
- 44 rooms
- 245 rooms
- 246 rooms
- 27 rooms
- 108 rooms
- 09+ rooms


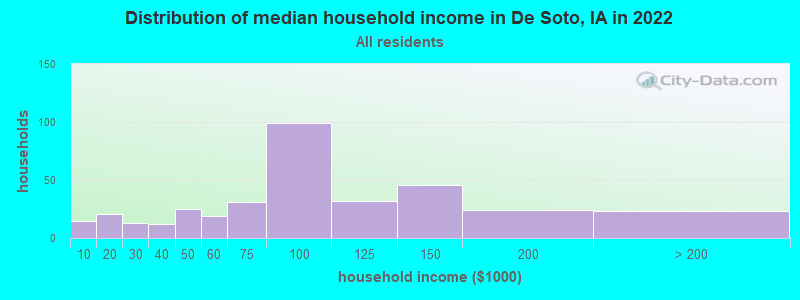
De Soto, IA household income distribution

- 15Less than $10,000
- 21$10,000 to $19,999
- 13$20,000 to $29,999
- 12$30,000 to $39,999
- 25$40,000 to $49,999
- 19$50,000 to $59,999
- 31$60,000 to $74,999
- 99$75,000 to $99,999
- 32$100,000 to $124,999
- 46$125,000 to $149,999
- 24$150,000 to $199,999
- 23$200,000 or more
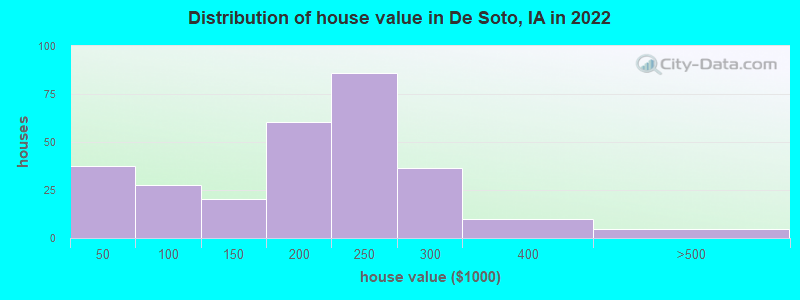
Home value of owner - occupied houses in 2022 in De Soto, IA
-
- 1Less than $10,000
- 17$10,000 to $14,999
- 15$15,000 to $19,999
- 3$40,000 to $49,999
- 1$50,000 to $59,999
- 3$70,000 to $79,999
- 19$80,000 to $89,999
- 10$100,000 to $124,999
- 10$125,000 to $149,999
- 18$150,000 to $174,999
- 42$175,000 to $199,999
- 85$200,000 to $249,999
- 36$250,000 to $299,999
- 10$300,000 to $399,999
- 4$400,000 to $499,999
Rent paid by renters in 2022 in De Soto, IA
-
- 2$350 to $399
- 4$450 to $499
- 1$550 to $599
- 11$600 to $649
- 2$700 to $749
- 2$750 to $799
- 2$1,000 to $1,249
- 3$1,500 to $1,999
- 27No cash rent

Percentage of workers working in this county: 54.4%
Number of people working at home: 72 (15.0% of all workers)
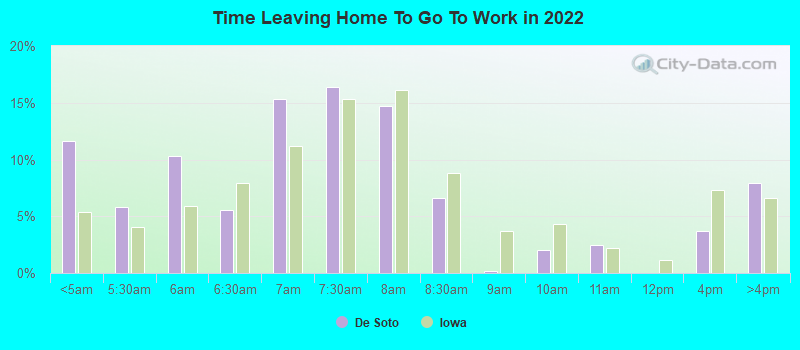
Travel time to work (commute)
- Less than 5 minutes: 40
- 5 to 9 minutes: 23
- 10 to 14 minutes: 38
- 15 to 19 minutes: 63
- 20 to 24 minutes: 93
- 25 to 29 minutes: 50
- 30 to 34 minutes: 34
- 35 to 39 minutes: 34
- 40 to 44 minutes: 12
- 45 to 59 minutes: 18
- 60 to 89 minutes: 0
- 90 or more minutes: 24
Means of transportation to work:
- Drove a car alone: 429 (77.3%)
- Carpooled: 81 (14.6%)
- Bus or trolley bus: 2 (0.4%)
- Walked: 11 (2.0%)
- Worked at home: 32 (5.8%)
- Unemployment by race in 2022
- Unemployment rate for White non-Hispanic residents
- 0.3%Males
- 6.1%Females

- Year of entry for the foreign-born population in De Soto, Iowa
- 462010 or later
- 62000 to 2009
- 121990 to 1999
- 01980 to 1989
- 21970 to 1979
- 9Before 1970

First ancestries reported:
- German: 97 (27.2%)
- American: 47 (13.2%)
- English: 26 (7.3%)
- British: 20 (5.6%)
- Polish: 19 (5.3%)
- Norwegian: 14 (3.9%)
- Irish: 11 (3.1%)
- Danish: 8 (2.2%)
- Swedish: 7 (2.0%)
- European: 6 (1.7%)
- Jamaican: 6 (1.7%)
- French: 3 (0.8%)
- Scottish: 2 (0.6%)
- Lebanese: 1 (0.3%)
- Scotch-Irish: 1 (0.3%)
Most common places of birth for foreign-born residents (%):
| De Soto: | 57.1% (36) |
| Iowa: | 6.2% (11,148) |
| De Soto: | 17.5% (11) |
| Iowa: | 0.5% (848) |
| De Soto: | 11.1% (7) |
| Iowa: | 1.4% (2,525) |
| De Soto: | 11.1% (7) |
| Iowa: | 0.7% (1,326) |
Place of birth for U.S.-born residents:
- This state: 733
- Other state: 181
- Northeast: 6
- Midwest: 88
- South: 25
- West: 63
93.1% of De Soto residents lived in the same house 1 years ago.
Out of people who lived in different houses, 11.8% lived in this county.
Out of people who lived in different counties, 62.9% lived in Iowa.
| De Soto: | 93.1% |
| State average: | 87.2% |
Education attainment for males 25 years and older:
- No schooling: 11
- Nursery to 4th grade: 0
- 5th and 6th grade: 0
- 7th and 8th grade: 0
- 9th grade: 0
- 10th grade: 0
- 11th grade: 2
- 12th grade, no diploma: 27
- High school graduate (or equivalency): 105
- Less than 1 year of college: 17
- Some college more than 1 year, no degree: 57
- Associate degree: 20
- Bachelor's degree: 67
- Master's degree: 23
- Professional school degree: 5
- Doctorate degree: 0

Education attainment for females 25 years and older:
- No schooling: 1
- Nursery to 4th grade: 0
- 5th and 6th grade: 0
- 7th and 8th grade: 6
- 9th grade: 2
- 10th grade: 0
- 11th grade: 0
- 12th grade, no diploma: 2
- High school graduate (or equivalency): 103
- Less than 1 year of college: 33
- Some college more than 1 year, no degree: 43
- Associate degree: 14
- Bachelor's degree: 98
- Master's degree: 25
- Professional school degree: 0
- Doctorate degree: 2


Housing units in structures:
- One, detached: 337
- One, attached: 8
- 3 or 4: 7
- 5 to 9: 4
- 10 to 19: 2
- Mobile homes: 64
Median worth of mobile homes: $21,068
Housing units lacking complete kitchen facilities in 2022: 0.5%
House/condo owner moved in on average 13 years ago
Renter moved in on average 7 years ago

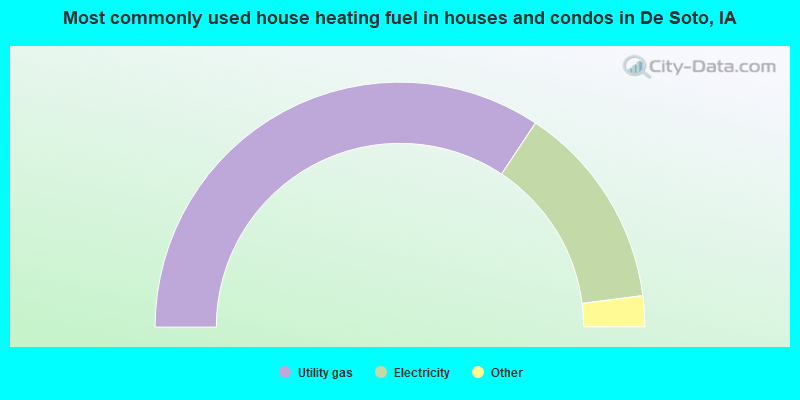
- 68.9%Utility gas
- 27.3%Electricity
- 2.7%Bottled, tank, or LP gas
- 1.0%Coal or coke
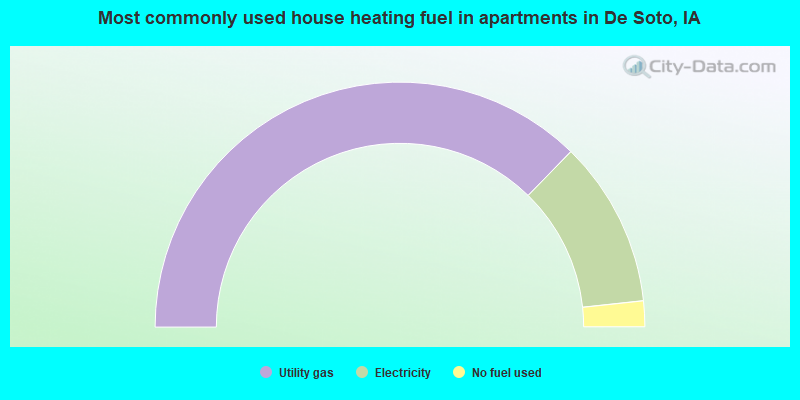
- 74.6%Utility gas
- 22.0%Electricity
- 3.4%No fuel used
Private vs. public school enrollment:
| Here: | 2.0% |
| Iowa: | 10.6% |
| Here: | 0.0% |
| Iowa: | 7.9% |
| Here: | 8.7% |
| Iowa: | 23.9% |


