Deal Island, MD (Maryland) Houses and Residents
| Deal Island: | $128,794 |
| Maryland: | $398,100 |
Total population: 471 (Urban population: 0, Rural population: 611 (all nonfarm))
Houses: 342 (177 occupied: 154 owner occupied, 25 renter occupied)
| % of renters here: | 14% |
| State: | 32% |
Housing density: 105 houses/condos per square mile
Median price asked for vacant for-sale houses and condos in 2022: $531,503.
Median contract rent in 2022: $1,034 (lower quartile is $768, upper quartile is $1,135)
Median gross rent in Deal Island, MD in 2022: $-646,641,634
Housing units in Deal Island with a mortgage: 59 (20 second mortgage, 0 home equity loan, 0 both second mortgage and home equity loan)
Houses without a mortgage: 0
Median household income for apartments without a mortgage: $21,498
Median monthly housing costs: $787
Compare current foreclosures near Deal Island, MD:
| Photo | Address | Area | Beds / Baths | Price | Details |
|---|---|---|---|---|---|

|
#1
Thomas Price Rd
Deal Island, MD 21821
|
- sq. feet
|
- baths - beds |
show details | |

|
#2
Drawbridge Rd
Princess Anne, MD 21853
|
2,600 sq. feet
|
3 baths 3 beds |
$435,000
|
show details |

|
#3
Sackertown Rd
Crisfield, MD 21817
|
1,283 sq. feet
|
1 baths - beds |
$15,000
|
show details |

|
#4
Boone Rd
Crisfield, MD 21817
|
1,948 sq. feet
|
2 baths 3 beds |
show details | |

|
#5
Back St
Toddville, MD 21672
|
1,458 sq. feet
|
1 baths - beds |
show details | |

|
#6
Noble Farm Rd
Eden, MD 21822
|
3,427 sq. feet
|
3 baths - beds |
show details | |

|
#7
Perry Rankin Rd
Princess Anne, MD 21853
|
1,248 sq. feet
|
1 baths - beds |
show details | |

|
#8
Mount Vernon Rd
Princess Anne, MD 21853
|
775 sq. feet
|
1 baths - beds |
show details | |

|
#9
Columbia Ave
Crisfield, MD 21817
|
1,760 sq. feet
|
2 baths - beds |
show details | |

|
#10
Mccormick Swamp Rd
Princess Anne, MD 21853
|
1,520 sq. feet
|
1 baths - beds |
show details |
| Photo | Address | Area | Beds / Baths | Price | Details |
|---|---|---|---|---|---|

|
#11
Jerusalem Rd
Princess Anne, MD 21853
|
1,512 sq. feet
|
2 baths - beds |
show details | |

|
#12
Calvary Rd
Crisfield, MD 21817
|
2,324 sq. feet
|
1 baths - beds |
show details | |

|
#13
W Post Office Rd
Princess Anne, MD 21853
|
1,008 sq. feet
|
1 baths - beds |
show details | |

|
#14
Independence Ct
Princess Anne, MD 21853
|
1,176 sq. feet
|
2 baths - beds |
show details | |

|
#15
Boone Rd
Crisfield, MD 21817
|
1,392 sq. feet
|
1 baths - beds |
show details | |

|
#16
Venton Rd
Princess Anne, MD 21853
|
993 sq. feet
|
2 baths - beds |
show details | |

|
#17
Manor Dr
Princess Anne, MD 21853
|
1,386 sq. feet
|
2 baths - beds |
show details | |

|
#18
Wayman Rd
Marion Station, MD 21838
|
576 sq. feet
|
1 baths - beds |
show details | |

|
#19
Hall Hwy
Crisfield, MD 21817
|
1,740 sq. feet
|
1 baths - beds |
show details | |

|
#20
Peach St
Crisfield, MD 21817
|
1,410 sq. feet
|
1 baths - beds |
show details |
| Photo | Address | Area | Beds / Baths | Price | Details |
|---|---|---|---|---|---|

|
#21
River Rd
Westover, MD 21871
|
1,466 sq. feet
|
1 baths - beds |
show details | |

|
#22
Jacksonville Rd
Crisfield, MD 21817
|
3,124 sq. feet
|
3 baths - beds |
show details | |

|
#23
Davis Rd
Marion Station, MD 21838
|
1,998 sq. feet
|
2 baths - beds |
show details | |

|
#24
Bowland Hill Cir
Princess Anne, MD 21853
|
- sq. feet
|
- baths - beds |
show details | |

|
#25
Tyaskin Rd
Tyaskin, MD 21865
|
- sq. feet
|
- baths - beds |
show details | |

|
#26
Bobtown Rd
Princess Anne, MD 21853
|
- sq. feet
|
- baths - beds |
show details | |

|
#27
Fishing Island Rd
Westover, MD 21871
|
- sq. feet
|
- baths - beds |
show details | |

|
#28
Somerset Ave
Princess Anne, MD 21853
|
- sq. feet
|
- baths - beds |
show details | |

|
#29
Fitzgerald Rd
Princess Anne, MD 21853
|
- sq. feet
|
- baths - beds |
show details | |

|
#30
Pine Knoll Dr
Princess Anne, MD 21853
|
- sq. feet
|
- baths - beds |
show details |
| Photo | Address | Area | Beds / Baths | Price | Details |
|---|---|---|---|---|---|

|
#31
Chestnut Cir
Princess Anne, MD 21853
|
- sq. feet
|
- baths - beds |
show details | |

|
#32
Progress Ln
Princess Anne, MD 21853
|
- sq. feet
|
- baths - beds |
show details | |

|
#33
Jesterville Rd
Bivalve, MD 21814
|
- sq. feet
|
- baths - beds |
show details | |

|
#34
Back St
Toddville, MD 21672
|
- sq. feet
|
- baths - beds |
show details | |

|
#35
Hill Ln
Crisfield, MD 21817
|
- sq. feet
|
- baths - beds |
show details | |

|
#36
Revells Neck Rd
Westover, MD 21890
|
- sq. feet
|
- baths - beds |
show details | |

|
#37
Toddville Rd, C O Steven Sears
Toddville, MD 21672
|
- sq. feet
|
- baths - beds |
show details | |

|
#38
Scotts Blvd
Princess Anne, MD 21853
|
- sq. feet
|
- baths - beds |
show details | |

|
Check over 1 million property listings on Foreclosure.com!
|
browse all offers | |||


 | Centreville, Easton, Chestertown, Stevensville (2 replies) |

Median year apartment built: 1939
Household type by relationship:
Households: 286- Male householders: 46 (22 living alone), Female householders: 130 (95 living alone)
21 spouses (21 opposite-sex spouses), 2 unmarried partners, (2 opposite-sex unmarried partners), 38 children (30 natural, 8 adopted, 0 stepchildren), 19 grandchildren, 9 brothers or sisters, 0 parents, 0 foster children, 5 other relatives, 16 non-relatives
Size of family households: 39 2-persons, 15 3-persons, 2 6-persons.
Size of nonfamily households: 122 1-person, 3 3-persons.
0 married couples with children.
7 single-parent households (0 men, 7 women).
99.6% of residents of Deal Island speak English at home.
1.4% of residents speak Asian or Pacific Island language at home (100% speak English well).
| Here: | 6.4 |
| State: | 7.3 |
| Here: | 7.3 |
| State: | 4.2 |

- Bedrooms in owner-occupied houses and condos in Deal Island, Maryland
- 0no bedroom
- 01 bedroom
- 572 bedrooms
- 663 bedrooms
- 324 bedrooms
- 05+ bedrooms

- Bedrooms in renter-occupied apartments in Deal Island, Maryland
- 0no bedroom
- 01 bedroom
- 202 bedrooms
- 53 bedrooms
- 04 bedrooms
- 05+ bedrooms

- Cars and other vehicles available in Deal Island in owner-occupied houses/condos
- 0no vehicle
- 1171 vehicle
- 142 vehicles
- 153 vehicles
- 84 vehicles
- 05+ vehicles

- Cars and other vehicles available in Deal Island in renter-occupied apartments
- 0no vehicle
- 131 vehicle
- 52 vehicles
- 73 vehicles
- 04 vehicles
- 05+ vehicles

- Rooms in owner-occupied houses in Deal Island, Maryland
- 01 room
- 02 rooms
- 53 rooms
- 104 rooms
- 95 rooms
- 596 rooms
- 357 rooms
- 268 rooms
- 109+ rooms

- Rooms in renter-occupied apartments in Deal Island, Maryland
- 01 room
- 02 rooms
- 03 rooms
- 04 rooms
- 05 rooms
- 76 rooms
- 57 rooms
- 138 rooms
- 09+ rooms


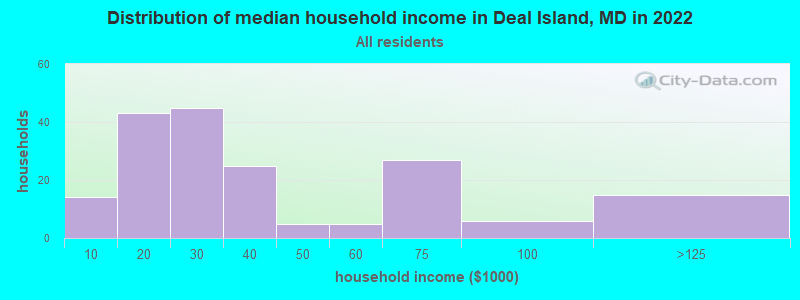
Deal Island, MD household income distribution

- 14Less than $10,000
- 43$10,000 to $19,999
- 45$20,000 to $29,999
- 25$30,000 to $39,999
- 5$40,000 to $49,999
- 5$50,000 to $59,999
- 27$60,000 to $74,999
- 6$75,000 to $99,999
- 15$100,000 to $124,999
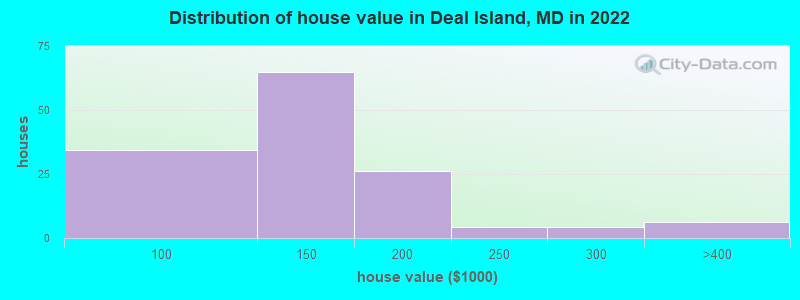
Home value of owner - occupied houses in 2022 in Deal Island, MD
-
- 5$50,000 to $59,999
- 6$60,000 to $69,999
- 21$80,000 to $89,999
- 44$100,000 to $124,999
- 20$125,000 to $149,999
- 16$150,000 to $174,999
- 9$175,000 to $199,999
- 4$200,000 to $249,999
- 4$250,000 to $299,999
- 6$300,000 to $399,999
Rent paid by renters in 2022 in Deal Island, MD
-
- 7$750 to $799
- 13$1,000 to $1,249
- 5No cash rent


Percentage of workers working in this county: 33.8%
Number of people working at home: 7 (8.8% of all workers)
Travel time to work (commute)
- Less than 5 minutes: 0
- 5 to 9 minutes: 13
- 10 to 14 minutes: 0
- 15 to 19 minutes: 6
- 20 to 24 minutes: 3
- 25 to 29 minutes: 0
- 30 to 34 minutes: 4
- 35 to 39 minutes: 0
- 40 to 44 minutes: 5
- 45 to 59 minutes: 34
- 60 to 89 minutes: 0
- 90 or more minutes: 0
Means of transportation to work:
- Drove a car alone: 161 (59.4%)
- Carpooled: 63 (23.2%)
- Walked: 17 (6.3%)
- Other means: 15 (5.5%)
- Worked at home: 15 (5.5%)


First ancestries reported:
- American: 120 (52.8%)
- English: 77 (33.9%)
- German: 12 (5.3%)
- Polish: 6 (2.6%)
Place of birth for U.S.-born residents:
- This state: 191
- Other state: 91
- Northeast: 45
- Midwest: 0
- South: 44
- West: 0
92.7% of Deal Island residents lived in the same house 1 years ago.
Out of people who lived in different houses, 48.8% lived in this county.
| Deal Island: | 92.7% |
| State average: | 88.5% |
Education attainment for males 25 years and older:
- No schooling: 5
- Nursery to 4th grade: 0
- 5th and 6th grade: 0
- 7th and 8th grade: 0
- 9th grade: 0
- 10th grade: 0
- 11th grade: 0
- 12th grade, no diploma: 4
- High school graduate (or equivalency): 27
- Less than 1 year of college: 0
- Some college more than 1 year, no degree: 20
- Associate degree: 6
- Bachelor's degree: 9
- Master's degree: 4
- Professional school degree: 0
- Doctorate degree: 0

Education attainment for females 25 years and older:
- No schooling: 0
- Nursery to 4th grade: 0
- 5th and 6th grade: 0
- 7th and 8th grade: 0
- 9th grade: 0
- 10th grade: 2
- 11th grade: 15
- 12th grade, no diploma: 9
- High school graduate (or equivalency): 46
- Less than 1 year of college: 30
- Some college more than 1 year, no degree: 3
- Associate degree: 24
- Bachelor's degree: 20
- Master's degree: 6
- Professional school degree: 0
- Doctorate degree: 0


Housing units in structures:
- One, detached: 296
- One, attached: 20
- Mobile homes: 26
Housing units lacking complete kitchen facilities in 2022: 2.7%
House/condo owner moved in on average 25 years ago
Renter moved in on average 1 years ago

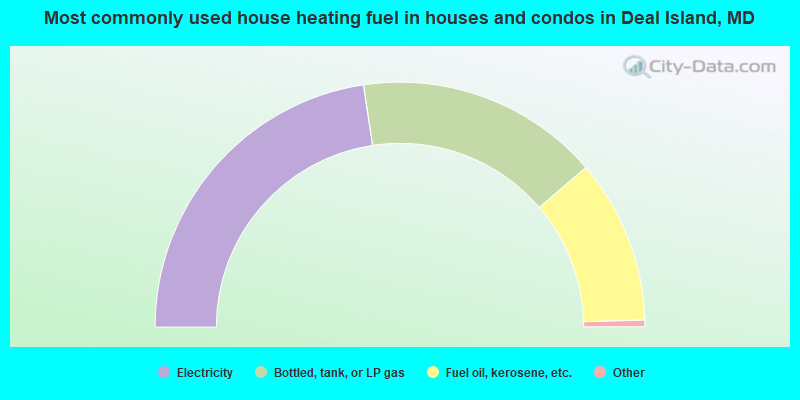
- 45.7%Electricity
- 32.5%Bottled, tank, or LP gas
- 21.9%Fuel oil, kerosene, etc.
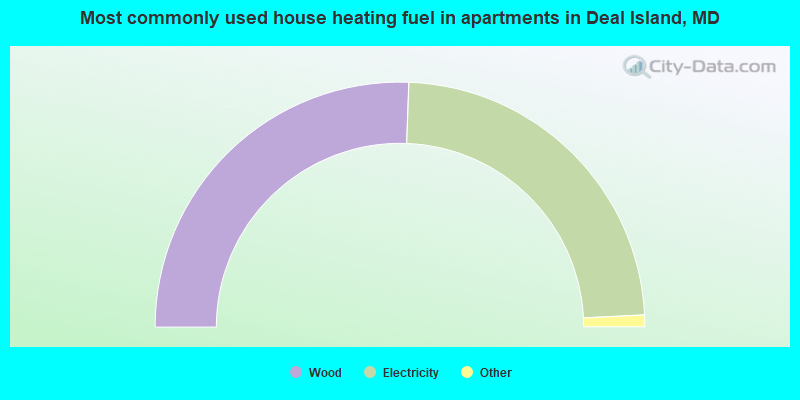
- 52.0%Wood
- 48.0%Electricity
Private vs. public school enrollment:
| Here: | 0.0% |
| Maryland: | 15.2% |
| Here: | 33.3% |
| Maryland: | 14.4% |
| Here: | 0.0% |
| Maryland: | 20.2% |


