Deal, NJ (New Jersey) Houses and Residents
| Deal: | $1,700,855 |
| New Jersey: | $428,900 |
Mean price in 2022:
Detached houses: $3,016,270
Here: $3,016,270 State: $537,591 In 5-or-more-unit structures: $729,999
Here: $729,999 State: $368,745
Total population: 737 (All urban)
Houses: 958 (250 occupied: 133 owner occupied, 120 renter occupied)
| % of renters here: | 47% |
| State: | 35% |
Housing density: 788 houses/condos per square mile
Median price asked for vacant for-sale houses and condos in 2022 in this county: $430,351.
Median contract rent in 2022: $1,160 (lower quartile is $1,001, upper quartile is $1,593)
Median rent asked for vacant for-rent units in 2022: $935
Median gross rent in Deal, NJ in 2022: $1,326
Housing units in Deal with a mortgage: 63 (2 second mortgage, 0 home equity loan, 2 both second mortgage and home equity loan)
Houses without a mortgage: 10
Median household income for houses/condos with a mortgage: $243,638
Median household income for apartments without a mortgage: $95,404
Median monthly housing costs: $1,613
Compare current foreclosures near Deal, NJ:
| Photo | Address | Area | Beds / Baths | Price | Details |
|---|---|---|---|---|---|

|
#1
Brighton Ave
Deal, NJ 07723
|
3,742 sq. feet
|
- baths - beds |
show details | |

|
#2
Grant Ave
Deal, NJ 07723
|
3,248 sq. feet
|
- baths - beds |
show details | |

|
#3
Wyckoff St Apt B
Deal, NJ 07723
|
- sq. feet
|
- baths - beds |
show details | |

|
#4
Roseld Ave
Deal, NJ 07723
|
- sq. feet
|
- baths - beds |
show details | |

|
#5
Hathaway Ave
Deal, NJ 07723
|
4,963 sq. feet
|
- baths - beds |
show details | |

|
#6
Warren Street
Keyport, NJ 07735
|
2,889 sq. feet
|
2 baths 7 beds |
$459,900
|
show details |

|
#7
Henry St
Keyport, NJ 07735
|
800 sq. feet
|
1 baths 2 beds |
$219,350
|
show details |

|
#8
-11 Spring St
Red Bank, NJ 07701
|
1,096 sq. feet
|
1 baths 2 beds |
show details | |

|
#9
Crawford Street
Red Bank, NJ 07701
|
1,280 sq. feet
|
1 baths 2 beds |
show details | |

|
#10
Bridle Path
Neptune, NJ 07753
|
1,992 sq. feet
|
1 baths 3 beds |
show details |
| Photo | Address | Area | Beds / Baths | Price | Details |
|---|---|---|---|---|---|

|
#11
Drummond Ave
Neptune, NJ 07753
|
928 sq. feet
|
1 baths 2 beds |
show details | |

|
#12
Eastham Rd
Point Pleasant Beach, NJ 08742
|
1,610 sq. feet
|
2 baths 3 beds |
show details | |

|
#13
Forest Dr
Lakewood, NJ 08701
|
1,768 sq. feet
|
1 baths 3 beds |
show details | |

|
#14
Jupiter St
Middletown, NJ 07748
|
2,040 sq. feet
|
2 baths 4 beds |
show details | |

|
#15
Alba Ln
West Long Branch, NJ 07764
|
5,483 sq. feet
|
6 baths 5 beds |
show details | |

|
#16
Wilson Ave
Matawan, NJ 07747
|
1,464 sq. feet
|
2 baths 3 beds |
show details | |

|
#17
1st Ave
Asbury Park, NJ 07712
|
1,318 sq. feet
|
1 baths 2 beds |
show details | |

|
#18
Princeton Ct
Allenwood, NJ 08720
|
2,970 sq. feet
|
1 baths 4 beds |
show details | |

|
#19
Creamery Ct
Freehold, NJ 07728
|
1,510 sq. feet
|
1 baths 3 beds |
show details | |

|
#20
Morningside Ave
Keyport, NJ 07735
|
1,228 sq. feet
|
2 baths 3 beds |
show details |
| Photo | Address | Area | Beds / Baths | Price | Details |
|---|---|---|---|---|---|

|
#21
Lorillard Ave
Keyport, NJ 07735
|
762 sq. feet
|
1 baths 2 beds |
show details | |

|
#22
20th Ave
Brick, NJ 08724
|
1,428 sq. feet
|
2 baths 3 beds |
show details | |

|
#23
Leone Dr
Brick, NJ 08724
|
1,538 sq. feet
|
2 baths 4 beds |
show details | |

|
#24
9th Ave
Neptune, NJ 07753
|
992 sq. feet
|
1 baths 2 beds |
show details | |

|
#25
Potter Rd
Freehold, NJ 07728
|
4,062 sq. feet
|
3 baths 5 beds |
show details | |

|
#26
Pkwy Dr
Freehold, NJ 07728
|
1,262 sq. feet
|
1 baths 2 beds |
show details | |

|
#27
Main St
Middletown, NJ 07748
|
- sq. feet
|
1 baths 2 beds |
show details | |

|
#28
Shady Ln
Howell, NJ 07731
|
1,464 sq. feet
|
1 baths 4 beds |
show details | |

|
#29
Dudley St
Long Branch, NJ 07740
|
1,668 sq. feet
|
1 baths 3 beds |
show details | |

|
#30
Maurice Ave
Holmdel, NJ 07733
|
1,296 sq. feet
|
2 baths 3 beds |
show details |
| Photo | Address | Area | Beds / Baths | Price | Details |
|---|---|---|---|---|---|

|
#31
Crine Rd
Morganville, NJ 07751
|
3,058 sq. feet
|
3 baths 5 beds |
show details | |

|
#32
Highland Ave
Long Branch, NJ 07740
|
2,608 sq. feet
|
2 baths 5 beds |
show details | |

|
#33
Cheyenne St
Asbury Park, NJ 07712
|
1,840 sq. feet
|
2 baths 3 beds |
show details | |

|
#34
Dora Ln
Holmdel, NJ 07733
|
4,783 sq. feet
|
2 baths 4 beds |
show details | |

|
#35
Dock St
Keyport, NJ 07735
|
1,362 sq. feet
|
2 baths 3 beds |
show details | |

|
#36
Kent Rd
Howell, NJ 07731
|
1,104 sq. feet
|
2 baths 4 beds |
show details | |

|
#37
Baser Ln
Brick, NJ 08724
|
1,021 sq. feet
|
2 baths 2 beds |
show details | |

|
#38
Rankin Rd
Brielle, NJ 08730
|
- sq. feet
|
3 baths 4 beds |
show details | |

|
#39
Susan Ln
Brielle, NJ 08730
|
- sq. feet
|
2 baths 2 beds |
show details | |

|
#40
Campbell Pl
Brick, NJ 08724
|
1,220 sq. feet
|
- baths - beds |
show details |
| Photo | Address | Area | Beds / Baths | Price | Details |
|---|---|---|---|---|---|

|
#41
Cumberland Dr
Brick, NJ 08723
|
1,512 sq. feet
|
- baths - beds |
show details | |

|
#42
Oak Knoll Rd
Asbury Park, NJ 07712
|
2,596 sq. feet
|
- baths - beds |
show details | |

|
#43
Sullivan Rd
Brick, NJ 08724
|
2,168 sq. feet
|
- baths - beds |
show details | |

|
#44
Tennis Ct
Belmar, NJ 07719
|
1,700 sq. feet
|
- baths 3 beds |
show details | |

|
#45
Turner Rd
Freehold, NJ 07728
|
966 sq. feet
|
- baths 3 beds |
show details | |

|
#46
Church St
Manasquan, NJ 08736
|
4,406 sq. feet
|
- baths - beds |
show details | |

|
#47
Monmouth Pkwy
Middletown, NJ 07748
|
1,738 sq. feet
|
- baths - beds |
show details | |

|
#48
Sugar Maple Ct
Howell, NJ 07731
|
1,576 sq. feet
|
- baths - beds |
show details | |

|
#49
Hulses Corner Rd
Howell, NJ 07731
|
1,472 sq. feet
|
- baths - beds |
show details | |

|
Check over 1 million property listings on Foreclosure.com!
|
browse all offers | |||

Latest news about housing in Deal, NJ collected exclusively by city-data.com from local newspapers, TV, and radio stations

 | Upgrade to larger home or invest at the shore- advice needed (43 replies) |
| rentals in Deal (0 replies) |
| A special thank you to Phil Murphy's supporters (179 replies) |
| Do Townhouses retain their value better? (18 replies) |
| Is Newark Improving? (892 replies) |
| Fair housing guide for real estate agents (1 reply) |

Median year apartment built: 1952
Household type by relationship:
Households: 646- Male householders: 106 (26 living alone), Female householders: 143 (45 living alone)
67 spouses (67 opposite-sex spouses), 4 unmarried partners, (4 opposite-sex unmarried partners), 193 children (191 natural, 2 adopted, 0 stepchildren), 63 grandchildren, 10 brothers or sisters, 4 parents, 0 foster children, 11 other relatives, 39 non-relatives
- In group quarters: 5
Size of family households: 49 2-persons, 56 3-persons, 13 4-persons, 13 5-persons, 5 6-persons, 8 7-or-more-persons.
Size of nonfamily households: 70 1-person, 27 2-persons, 7 4-persons.
32 married couples with children.
26 single-parent households (0 men, 26 women).
69.1% of residents of Deal speak English at home.
14.8% of residents speak Spanish at home (57% speak English very well, 43% speak English well).
7.9% of residents speak other Indo-European language at home (98% speak English very well, 2% speak English not well).
1.4% of residents speak Asian or Pacific Island language at home (56% speak English well, 44% don't speak English at all).
5.3% of residents speak other language at home (85% speak English very well, 15% speak English well).
Foreign born population: 141 (21.8%)
(71.6% of them are naturalized citizens)
| Here: | 8.3 |
| State: | 6.8 |
| Here: | 3.8 |
| State: | 3.9 |

- Bedrooms in owner-occupied houses and condos in Deal, New Jersey
- 0no bedroom
- 81 bedroom
- 212 bedrooms
- 283 bedrooms
- 184 bedrooms
- 585+ bedrooms

- Bedrooms in renter-occupied apartments in Deal, New Jersey
- 9no bedroom
- 381 bedroom
- 552 bedrooms
- 103 bedrooms
- 84 bedrooms
- 05+ bedrooms

- Cars and other vehicles available in Deal in owner-occupied houses/condos
- 10no vehicle
- 401 vehicle
- 412 vehicles
- 203 vehicles
- 44 vehicles
- 185+ vehicles

- Cars and other vehicles available in Deal in renter-occupied apartments
- 10no vehicle
- 531 vehicle
- 432 vehicles
- 83 vehicles
- 64 vehicles
- 05+ vehicles

- Rooms in owner-occupied houses in Deal, New Jersey
- 01 room
- 02 rooms
- 63 rooms
- 174 rooms
- 175 rooms
- 26 rooms
- 167 rooms
- 108 rooms
- 649+ rooms

- Rooms in renter-occupied apartments in Deal, New Jersey
- 91 room
- 112 rooms
- 283 rooms
- 434 rooms
- 165 rooms
- 26 rooms
- 67 rooms
- 08 rooms
- 59+ rooms


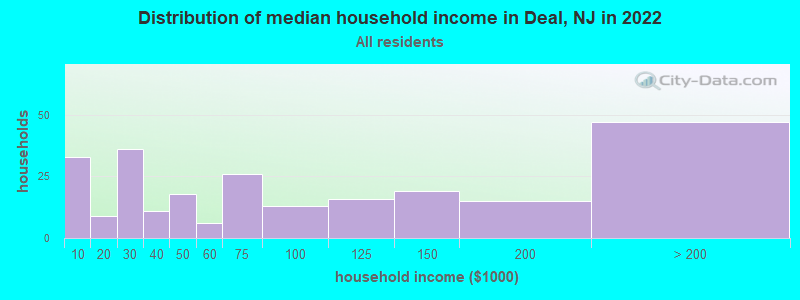
Deal, NJ household income distribution

- 33Less than $10,000
- 9$10,000 to $19,999
- 36$20,000 to $29,999
- 11$30,000 to $39,999
- 18$40,000 to $49,999
- 6$50,000 to $59,999
- 26$60,000 to $74,999
- 13$75,000 to $99,999
- 16$100,000 to $124,999
- 19$125,000 to $149,999
- 15$150,000 to $199,999
- 47$200,000 or more
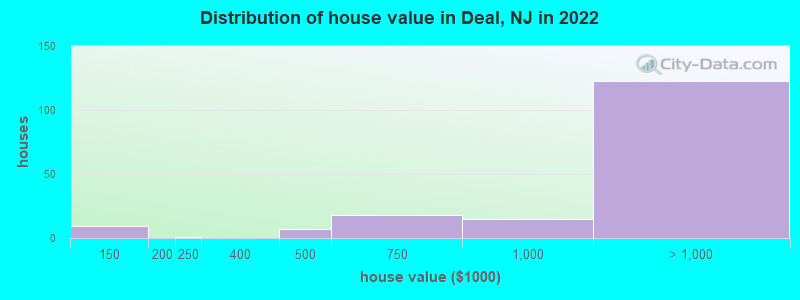
Home value of owner - occupied houses in 2022 in Deal, NJ
-
- 9$100,000 to $124,999
- 1$200,000 to $249,999
- 7$400,000 to $499,999
- 18$500,000 to $749,999
- 14$750,000 to $999,999
- 23$1,000,000 to $1,499,999
- 8$1,500,000 to $1,999,999
- 91$2,000,000 or more
Rent paid by renters in 2022 in Deal, NJ
-
- 2$800 to $899
- 21$900 to $999
- 42$1,000 to $1,249
- 13$1,250 to $1,499
- 16$1,500 to $1,999
- 9$2,000 to $2,499
- 2$3,000 to $3,499
- 12No cash rent


Percentage of workers working in this county: 69.3%
Number of people working at home: 32 (11.6% of all workers)
Travel time to work (commute)
- Less than 5 minutes: 2
- 5 to 9 minutes: 69
- 10 to 14 minutes: 3
- 15 to 19 minutes: 14
- 20 to 24 minutes: 8
- 25 to 29 minutes: 44
- 30 to 34 minutes: 24
- 35 to 39 minutes: 26
- 40 to 44 minutes: 12
- 45 to 59 minutes: 15
- 60 to 89 minutes: 9
- 90 or more minutes: 11
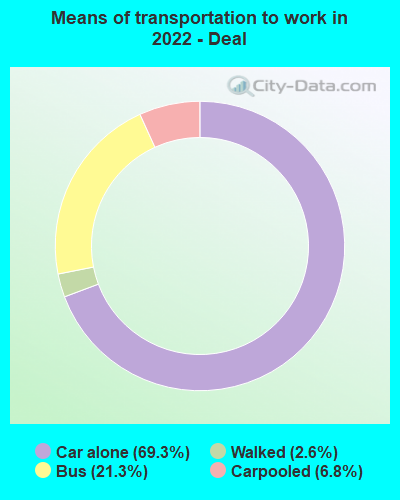
Means of transportation to work:
- Drove a car alone: 315 (58.0%)
- Carpooled: 28 (5.2%)
- Bus or trolley bus: 59 (10.9%)
- Walked: 11 (2.0%)
- Worked at home: 147 (27.1%)

- Unemployment by race in 2022
- Unemployment rate for White non-Hispanic residents
- 1.9%Males
- 5.1%Females
- Unemployment rate for Asian residents
- 29.7%Females

- Year of entry for the foreign-born population in Deal, New Jersey
- 602010 or later
- 312000 to 2009
- 191990 to 1999
- 231980 to 1989
- 171970 to 1979
- 64Before 1970

First ancestries reported:
- Syrian: 31 (10.3%)
- American: 29 (9.6%)
- Israeli: 17 (5.6%)
- Irish: 10 (3.3%)
- Polish: 10 (3.3%)
- Turkish: 10 (3.3%)
- Lebanese: 9 (3.0%)
- Egyptian: 8 (2.7%)
- Italian: 5 (1.7%)
- Moroccan: 2 (0.7%)
- English: 2 (0.7%)
- French: 2 (0.7%)
- Russian: 2 (0.7%)
- Ghanaian: 2 (0.7%)
- German: 1 (0.3%)
Most common places of birth for foreign-born residents (%):
| Deal: | 27.0% (38) |
| New Jersey: | 4.8% (102,527) |
| Deal: | 19.1% (27) |
| New Jersey: | 0.7% (14,848) |
| Deal: | 14.9% (21) |
| New Jersey: | 1.3% (27,580) |
| Deal: | 12.8% (18) |
| New Jersey: | 0.5% (10,975) |
| Deal: | 11.3% (16) |
| New Jersey: | 4.2% (90,817) |
| Deal: | 7.8% (11) |
| New Jersey: | 0.8% (16,778) |
| Deal: | 5.7% (8) |
| New Jersey: | 2.3% (48,811) |
| Deal: | 2.8% (4) |
| New Jersey: | 0.3% (5,966) |
Place of birth for U.S.-born residents:
- This state: 245
- Other state: 261
- Northeast: 243
- Midwest: 0
- South: 14
- West: 0
89.1% of Deal residents lived in the same house 1 years ago.
Out of people who lived in different houses, 10.9% lived in this county.
Out of people who lived in different counties, 76.5% lived in New Jersey.
| Deal: | 89.1% |
| State average: | 90.4% |
Education attainment for males 25 years and older:
- No schooling: 0
- Nursery to 4th grade: 0
- 5th and 6th grade: 0
- 7th and 8th grade: 11
- 9th grade: 0
- 10th grade: 0
- 11th grade: 2
- 12th grade, no diploma: 2
- High school graduate (or equivalency): 32
- Less than 1 year of college: 19
- Some college more than 1 year, no degree: 24
- Associate degree: 21
- Bachelor's degree: 46
- Master's degree: 4
- Professional school degree: 4
- Doctorate degree: 0

Education attainment for females 25 years and older:
- No schooling: 2
- Nursery to 4th grade: 0
- 5th and 6th grade: 0
- 7th and 8th grade: 0
- 9th grade: 0
- 10th grade: 2
- 11th grade: 7
- 12th grade, no diploma: 4
- High school graduate (or equivalency): 79
- Less than 1 year of college: 4
- Some college more than 1 year, no degree: 37
- Associate degree: 4
- Bachelor's degree: 43
- Master's degree: 17
- Professional school degree: 0
- Doctorate degree: 0


Housing units in structures:
- One, detached: 791
- One, attached: 5
- Two: 6
- 3 or 4: 3
- 5 to 9: 45
- 10 to 19: 38
- 20 to 49: 55
- Mobile homes: 14
Housing units lacking complete kitchen facilities in 2022: 0.8%
House/condo owner moved in on average 31 years ago
Renter moved in on average 6 years ago

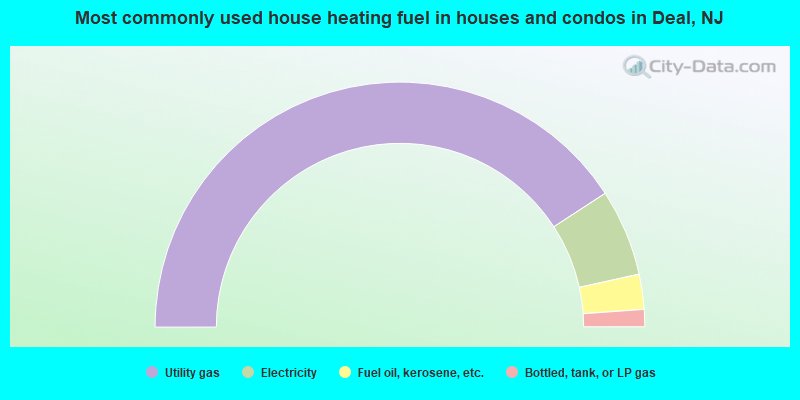
- 81.7%Utility gas
- 11.5%Electricity
- 4.6%Fuel oil, kerosene, etc.
- 2.3%Bottled, tank, or LP gas
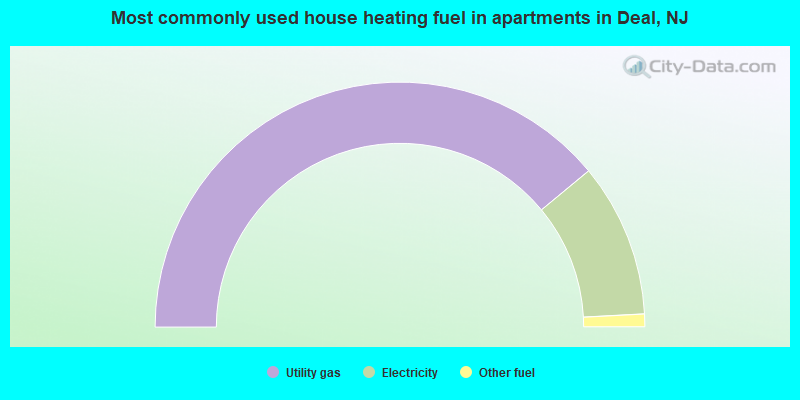
- 78.0%Utility gas
- 20.3%Electricity
- 1.7%Other fuel
Private vs. public school enrollment:
| Here: | 35.0% |
| New Jersey: | 12.3% |
| Here: | 0.0% |
| New Jersey: | 13.1% |
| Here: | 53.1% |
| New Jersey: | 33.2% |


