Death Valley, CA (California) Houses and Residents
| Death Valley: | $83,719 |
| California: | $715,900 |
Total population: 620 (Urban population: 0, Rural population: 629 (14 farm, 615 nonfarm))
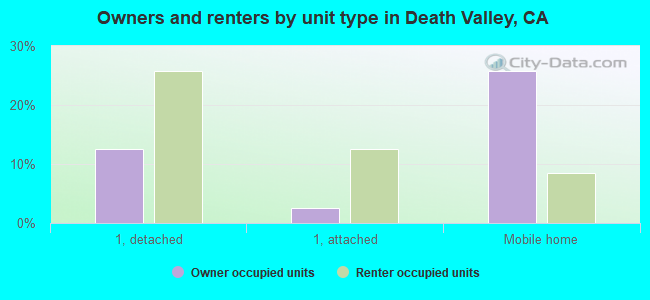
Houses: 529 (357 occupied: 160 owner occupied, 197 renter occupied)
| % of renters here: | 55% |
| State: | 44% |
Housing density: 0 houses/condos per square mile
Median price asked for vacant for-sale houses and condos in 2022 in this county: $478,581.
Median contract rent in 2022: $731 (lower quartile is $481, upper quartile is $1,010)
Median rent asked for vacant for-rent units in 2022: $736
Median gross rent in Death Valley, CA in 2022: $839
Housing units in Death Valley with a mortgage: 19 (5 second mortgage, 0 home equity loan, 0 both second mortgage and home equity loan)
Houses without a mortgage: 26
Compare current foreclosures near Death Valley, CA:
| Photo | Address | Area | Beds / Baths | Price | Details |
|---|---|---|---|---|---|

|
#1
Pawnee Pl
Pahrump, NV 89061
|
1,683 sq. feet
|
1 baths 3 beds |
show details | |

|
#2
Jackie St
Pahrump, NV 89048
|
1,647 sq. feet
|
2 baths 3 beds |
show details | |

|
#3
Camellia St
Pahrump, NV 89048
|
2,217 sq. feet
|
3 baths 4 beds |
show details | |

|
#4
W. White Hawk Rd
Pahrump, NV 89060
|
2,649 sq. feet
|
3 baths 3 beds |
show details | |

|
#5
White Hawk Rd
Pahrump, NV 89060
|
2,649 sq. feet
|
2 baths 2 beds |
show details | |

|
#6
Old West Ave
Pahrump, NV 89048
|
- sq. feet
|
2 baths 3 beds |
show details | |

|
#7
Casey Rd
Pahrump, NV 89048
|
1,334 sq. feet
|
2 baths 3 beds |
show details | |

|
#8
Francine St
Pahrump, NV 89060
|
3,490 sq. feet
|
3 baths 4 beds |
show details | |

|
#9
W Basin Ave
Pahrump, NV 89060
|
- sq. feet
|
- baths - beds |
show details | |

|
#10
W Irene St
Pahrump, NV 89060
|
- sq. feet
|
- baths - beds |
show details |
| Photo | Address | Area | Beds / Baths | Price | Details |
|---|---|---|---|---|---|

|
#11
E Deerskin St
Pahrump, NV 89048
|
- sq. feet
|
- baths - beds |
show details | |

|
#12
S Linda St # 8
Pahrump, NV 89048
|
- sq. feet
|
- baths - beds |
show details | |

|
#13
Z St
Pahrump, NV 89048
|
912 sq. feet
|
- baths - beds |
show details | |

|
#14
E Summit Ave
Pahrump, NV 89061
|
- sq. feet
|
- baths - beds |
show details | |

|
#15
Marywood Ct
Pahrump, NV 89061
|
2,143 sq. feet
|
- baths - beds |
show details | |

|
#16
S Highland Ave
Pahrump, NV 89048
|
1,396 sq. feet
|
- baths - beds |
show details | |

|
#17
E Florence Ave
Pahrump, NV 89061
|
- sq. feet
|
- baths - beds |
show details | |

|
#18
E Weld Ave
Pahrump, NV 89061
|
- sq. feet
|
- baths - beds |
show details | |

|
#19
Peppertree St
Pahrump, NV 89061
|
- sq. feet
|
- baths - beds |
show details | |

|
#20
Morgan Ln
Pahrump, NV 89060
|
499 sq. feet
|
- baths - beds |
show details |
| Photo | Address | Area | Beds / Baths | Price | Details |
|---|---|---|---|---|---|

|
#21
W Adkisson St
Pahrump, NV 89060
|
1,534 sq. feet
|
- baths - beds |
show details | |

|
#22
S Larimer St
Pahrump, NV 89061
|
- sq. feet
|
- baths - beds |
show details | |

|
#23
Balhurst Ct
Pahrump, NV 89061
|
3,128 sq. feet
|
- baths - beds |
show details | |

|
#24
S Rainbow Ave
Pahrump, NV 89048
|
2,269 sq. feet
|
- baths - beds |
show details | |

|
#25
Applewood Ct
Pahrump, NV 89061
|
2,327 sq. feet
|
- baths - beds |
show details | |

|
#26
Feather St
Pahrump, NV 89048
|
2,398 sq. feet
|
- baths - beds |
show details | |

|
#27
National Ave
Pahrump, NV 89048
|
1,676 sq. feet
|
- baths - beds |
show details | |

|
#28
National Ave
Pahrump, NV 89048
|
1,979 sq. feet
|
- baths - beds |
show details | |

|
#29
N Blagg Rd
Pahrump, NV 89060
|
- sq. feet
|
- baths - beds |
show details | |

|
#30
S Nevada Highway 160, Ste 8
Pahrump, NV 89048
|
- sq. feet
|
- baths - beds |
show details |
| Photo | Address | Area | Beds / Baths | Price | Details |
|---|---|---|---|---|---|

|
#31
Lorenzo Way
Pahrump, NV 89061
|
- sq. feet
|
- baths - beds |
show details | |

|
#32
Monte Penne Way
Pahrump, NV 89061
|
- sq. feet
|
- baths - beds |
show details | |

|
#33
Via Vinci Ct
Pahrump, NV 89061
|
- sq. feet
|
- baths - beds |
show details | |

|
#34
Janet Ln
Pahrump, NV 89060
|
1,693 sq. feet
|
- baths - beds |
show details | |

|
#35
N Linda St
Pahrump, NV 89060
|
1,378 sq. feet
|
- baths - beds |
show details | |

|
#36
E Teller Dr
Pahrump, NV 89061
|
- sq. feet
|
- baths - beds |
show details | |

|
#37
E Cheyenne Way
Pahrump, NV 89061
|
2,361 sq. feet
|
- baths - beds |
show details | |

|
#38
Tonopah Trl
Pahrump, NV 89048
|
618 sq. feet
|
- baths - beds |
show details | |

|
#39
S Woodchips Rd
Pahrump, NV 89048
|
- sq. feet
|
- baths - beds |
show details | |

|
#40
Flamingo Rd
Pahrump, NV 89048
|
2,160 sq. feet
|
- baths - beds |
show details |
| Photo | Address | Area | Beds / Baths | Price | Details |
|---|---|---|---|---|---|

|
#41
Carnation Way Unit 2
Pahrump, NV 89048
|
- sq. feet
|
- baths - beds |
show details | |

|
#42
Fremont St
Pahrump, NV 89048
|
1,483 sq. feet
|
- baths - beds |
show details | |

|
#43
W Calvada Blvd
Pahrump, NV 89048
|
2,247 sq. feet
|
- baths - beds |
show details | |

|
#44
Fritz Ln
Pahrump, NV 89048
|
2,604 sq. feet
|
- baths - beds |
show details | |

|
#45
China St
Pahrump, NV 89048
|
1,987 sq. feet
|
- baths - beds |
show details | |

|
#46
W Retread Rd
Pahrump, NV 89048
|
2,014 sq. feet
|
- baths - beds |
show details | |

|
#47
Oakridge Ave
Pahrump, NV 89048
|
1,742 sq. feet
|
- baths - beds |
show details | |

|
#48
Corrine St
Pahrump, NV 89048
|
- sq. feet
|
- baths - beds |
show details | |

|
#49
Amarillo Ave
Pahrump, NV 89048
|
- sq. feet
|
- baths - beds |
show details | |

|
Check over 1 million property listings on Foreclosure.com!
|
browse all offers | |||

Household type by relationship:
Households: 18,113- In family households: 14,328 (3,239 male householders, 1,594 female householders)
3,612 spouses, 4,474 children (4,162 natural, 77 adopted, 235 stepchildren), 338 grandchildren, 179 brothers or sisters, 160 parents, foster children, 238 other relatives, 400 non-relatives
- In nonfamily households: 3,785 (1,717 male householders (1,432 living alone)), 1,499 female householders (1,297 living alone)), 569 nonrelatives
- In group quarters: 433 (304 institutionalized population)
2,798 married couples with children.
1,213 single-parent households (353 men, 860 women).
91.7% of residents of Death Valley speak English at home.
3.8% of residents speak Spanish at home (100% speak English very well).
2.1% of residents speak other Indo-European language at home (100% speak English very well).
0.7% of residents speak Asian or Pacific Island language at home (100% speak English well).
1.8% of residents speak other language at home (100% speak English very well).
Foreign born population: 20 (2.7%)
(135.0% of them are naturalized citizens)
| Here: | 4.8 |
| State: | 6.0 |
| Here: | 4.7 |
| State: | 3.9 |

- Bedrooms in owner-occupied houses and condos in Death Valley, California
- 14no bedroom
- 431 bedroom
- 552 bedrooms
- 343 bedrooms
- 144 bedrooms
- 05+ bedrooms

- Bedrooms in renter-occupied apartments in Death Valley, California
- 9no bedroom
- 361 bedroom
- 942 bedrooms
- 583 bedrooms
- 04 bedrooms
- 05+ bedrooms

- Cars and other vehicles available in Death Valley in owner-occupied houses/condos
- 12no vehicle
- 771 vehicle
- 442 vehicles
- 103 vehicles
- 174 vehicles
- 05+ vehicles

- Cars and other vehicles available in Death Valley in renter-occupied apartments
- 0no vehicle
- 911 vehicle
- 892 vehicles
- 133 vehicles
- 44 vehicles
- 05+ vehicles

- Rooms in owner-occupied houses in Death Valley, California
- 141 room
- 132 rooms
- 263 rooms
- 504 rooms
- 335 rooms
- 56 rooms
- 107 rooms
- 58 rooms
- 49+ rooms

- Rooms in renter-occupied apartments in Death Valley, California
- 51 room
- 72 rooms
- 393 rooms
- 554 rooms
- 445 rooms
- 376 rooms
- 57 rooms
- 08 rooms
- 59+ rooms


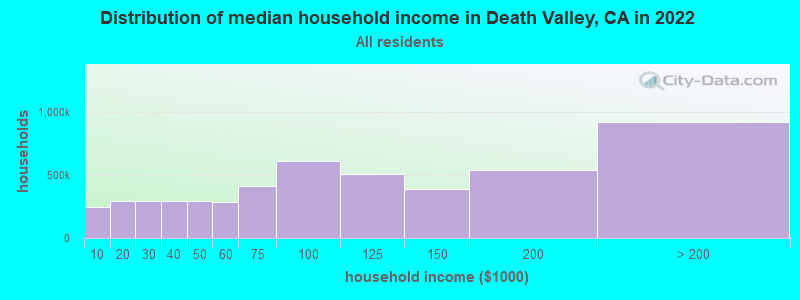
Death Valley, CA household income distribution

- 30,801Less than $10,000
- 38,777$10,000 to $19,999
- 40,005$20,000 to $29,999
- 38,624$30,000 to $39,999
- 39,287$40,000 to $49,999
- 34,671$50,000 to $59,999
- 52,088$60,000 to $74,999
- 68,632$75,000 to $99,999
- 60,890$100,000 to $124,999
- 44,983$125,000 to $149,999
- 62,218$150,000 to $199,999
- 94,830$200,000 or more
Percentage of workers working in this county: 94.7%
Number of people working at home: 57 (16.0% of all workers)
Travel time to work (commute)
- Less than 5 minutes: 114
- 5 to 9 minutes: 82
- 10 to 14 minutes: 49
- 15 to 19 minutes: 10
- 20 to 24 minutes: 5
- 25 to 29 minutes: 6
- 30 to 34 minutes: 18
- 35 to 39 minutes: 0
- 40 to 44 minutes: 0
- 45 to 59 minutes: 10
- 60 to 89 minutes: 0
- 90 or more minutes: 5
Means of transportation to work:
- Drove a car alone: 234 (78.3%)
- Carpooled: 9 (3.0%)
- Bicycle: 5 (1.7%)
- Walked: 46 (15.4%)
- Other means: 5 (1.7%)


- Year of entry for the foreign-born population in Death Valley, California
- 01995 to March 2000
- 01990 to 1994
- 01985 to 1989
- 01980 to 1984
- 31975 to 1979
- 41970 to 1974
- 01965 to 1969
- 8Before 1965
Most common places of birth for foreign-born residents (%):
| Death Valley: | 33.3% (5) |
| California: | 1.1% (98,160) |
| Death Valley: | 26.7% (4) |
| California: | 0.7% (62,114) |
| Death Valley: | 20.0% (3) |
| California: | 3.0% (268,452) |
| Death Valley: | 20.0% (3) |
| California: | 1.6% (141,181) |
Place of birth for U.S.-born residents:
- This state: 241
- Other state: 369
- Northeast: 36
- Midwest: 97
- South: 62
- West: 174
41% of Death Valley residents lived in the same house 5 years ago.
Out of people who lived in different houses, 34% lived in this county.
Out of people who lived in different counties, 27% lived in California.
Education attainment for males 25 years and older:
- No schooling: 4
- Nursery to 4th grade: 0
- 5th and 6th grade: 0
- 7th and 8th grade: 9
- 9th grade: 0
- 10th grade: 20
- 11th grade: 0
- 12th grade, no diploma: 9
- High school graduate (or equivalency): 77
- Less than 1 year of college: 5
- Some college more than 1 year, no degree: 48
- Associate degree: 12
- Bachelor's degree: 55
- Master's degree: 7
- Professional school degree: 5
- Doctorate degree: 0

Education attainment for females 25 years and older:
- No schooling: 3
- Nursery to 4th grade: 0
- 5th and 6th grade: 0
- 7th and 8th grade: 4
- 9th grade: 9
- 10th grade: 5
- 11th grade: 4
- 12th grade, no diploma: 29
- High school graduate (or equivalency): 76
- Less than 1 year of college: 8
- Some college more than 1 year, no degree: 43
- Associate degree: 13
- Bachelor's degree: 23
- Master's degree: 24
- Professional school degree: 5
- Doctorate degree: 0


Housing units in structures:
- One, detached: 218
- One, attached: 63
- Two: 4
- 3 or 4: 9
- 5 to 9: 30
- Mobile homes: 176
- Boats, RVs, vans, etc.: 29
Median worth of mobile homes: $48,193
Housing units lacking complete kitchen facilities: 0.9%

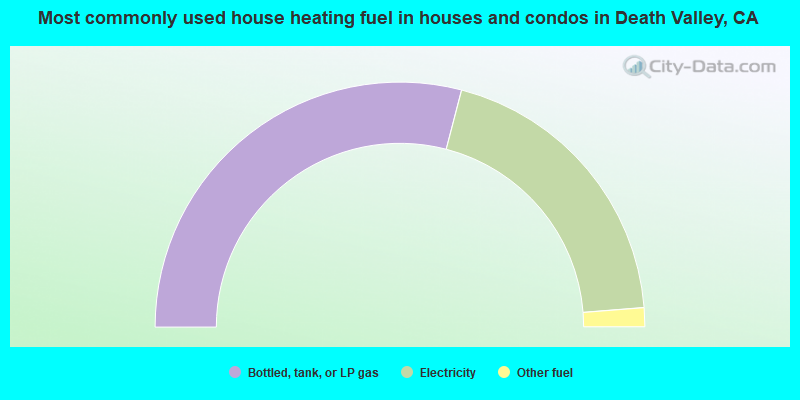
- 58.1%Bottled, tank, or LP gas
- 39.4%Electricity
- 2.5%Other fuel
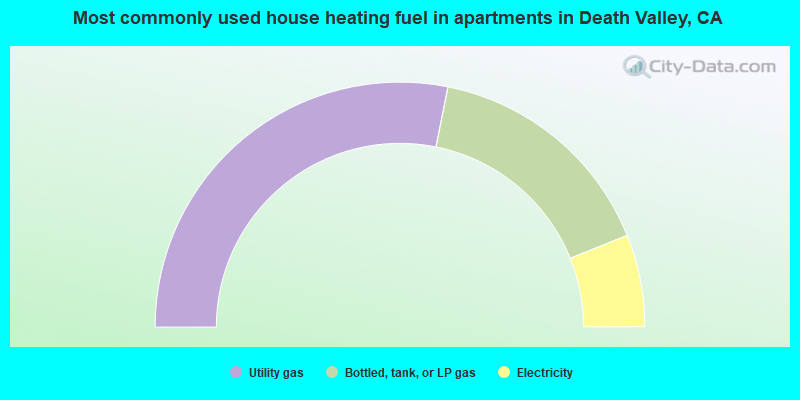
- 56.3%Utility gas
- 31.5%Bottled, tank, or LP gas
- 12.2%Electricity
Private vs. public school enrollment:
| Here: | 18.4% |
| California: | 9.9% |
| Here: | 17.4% |
| California: | 7.8% |
| Here: | 28.6% |
| California: | 15.4% |


