Decatur, AL (Alabama) Houses and Residents
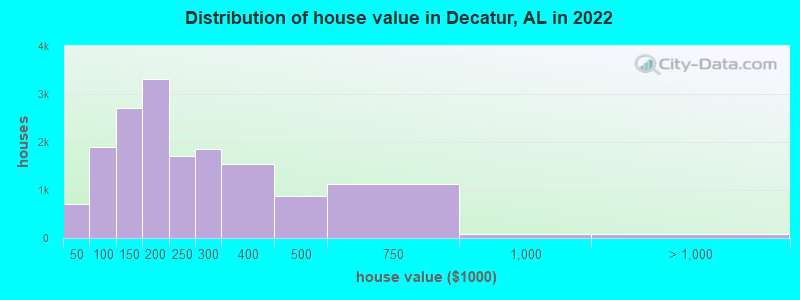
Estimated median house or condo value in 2022: $201,705 (it was $88,700 in 2000 )
Decatur:
$201,705Alabama:
$200,900
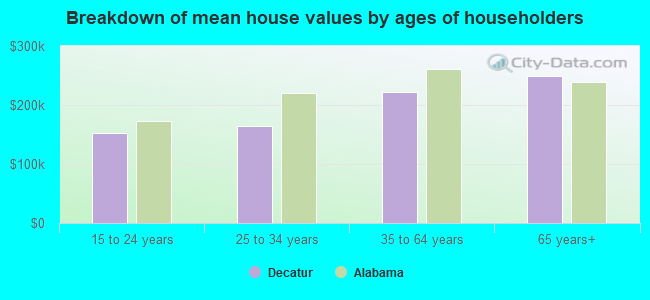
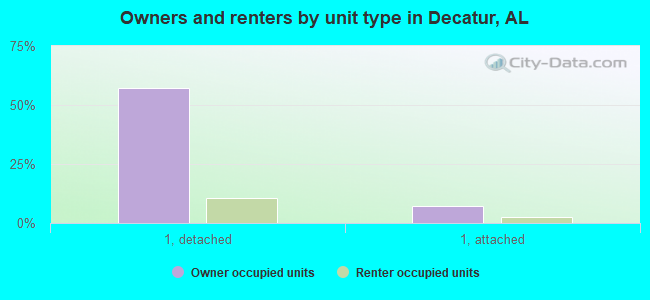
Lower value quartile - upper value quartile: $127,369 - $298,347Mean price in 2022: Detached houses: $233,556 Here:
$233,556State:
$273,076
Townhouses or other attached units: $107,553 Here:
$107,553State:
$222,857
In 2-unit structures: $79,254 Here:
$79,254State:
$191,282
In 5-or-more-unit structures: $156,622 Here:
$156,622State:
$307,073
Mobile homes: $49,537 Here:
$49,537State:
$77,780
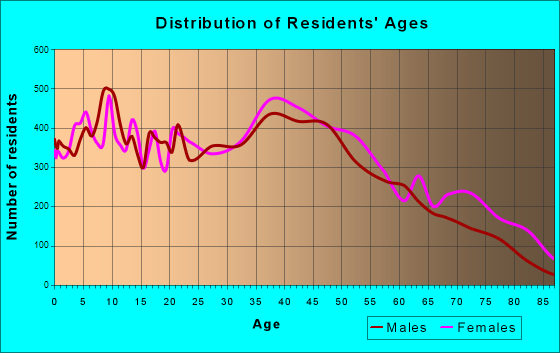
Total population: 55,532 (Urban population: 49,281, Rural population: 4,672 (all nonfarm) )
Houses: 25,931 (23,905 occupied: 15,469 owner occupied, 8,764 renter occupied )
% of renters here:
36%State:
30%
Housing density: 486 houses/condos per square mile
Median price asked for vacant for-sale houses and condos in 2022: $211,647.
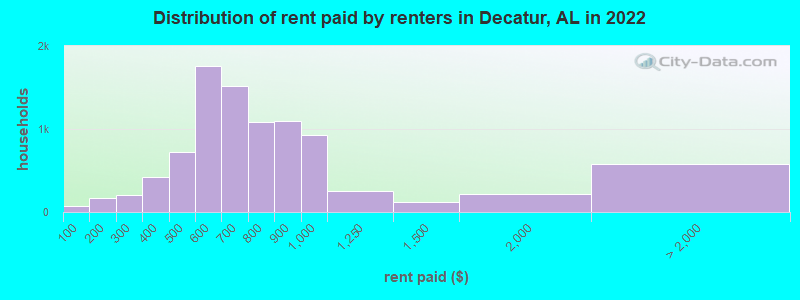
Median contract rent in 2022: $694 (lower quartile is $526, upper quartile is $900)
Median rent asked for vacant for-rent units in 2022: $685
Median gross rent in Decatur, AL in 2022: $861
Housing units in Decatur with a mortgage: 9,477 (570 second mortgage, 13 home equity loan, 503 both second mortgage and home equity loan )Houses without a mortgage: 237
Median household income for houses/condos with a mortgage: $84,473
Median household income for apartments without a mortgage: $50,316
Median monthly housing costs: $865
Data:
Median house or condo value ($)
Median house or condo value ($ change since 2000)
Median house or condo value ($) - White
Median house or condo value ($) - Black or African American
Median house or condo value ($) - Asian
Median house or condo value ($) - Hispanic or Latino
Median house or condo value ($) - American Indian and Alaska Native
Median house or condo value ($) - Multirace
Median house or condo value ($) - Other Race
Median price asked for mobile homes ($)
Household density (households per square mile)
Mean house or condo value by units in structure - 1, detached ($)
Mean house or condo value by units in structure - 1, attached ($)
Mean house or condo value by units in structure - 2 ($)
Mean house or condo value by units in structure by units in structure - 3 or 4 ($)
Mean house or condo value by units in structure - 5 or more ($)
Mean house or condo value by units in structure - Boat, RV, van, etc. ($)
Mean house or condo value by units in structure - Mobile home ($)
Median contract rent ($)
Median contract rent - Lower quartile ($)
Median contract rent - Upper quartile ($)
Median gross rent ($)
Urban houses (%)
Rural houses (%)
Houses occupied (%)
Houses occupied (% change since 2000)
Houses owner occupied (%)
Houses owner occupied (% change since 2000)
Houses renter occupied (%)
Houses renter occupied (% change since 2000)
Vacant housing units - For rent (%)
Vacant housing units - For rent (% change since 2000)
Vacant housing units - For sale only (%)
Vacant housing units - For sale only (% change since 2000)
Vacant housing units - Rented or sold, not occupied (%)
Vacant housing units - Rented or sold, not occupied (% change since 2000)
Vacant housing units - For seasonal, recreational, or occasional use (%)
Vacant housing units - For seasonal, recreational, or occasional use (% change since 2000)
Vacant housing units - For migrant workers (%)
Vacant housing units - For migrant workers (% change since 2000)
Vacant housing units - Other vacant (%)
Vacant housing units - Other vacant (% change since 2000)
Median monthly housing costs ($)
Median household income for houses/condos with a mortgage ($)
Median household income for houses/condos without a mortgage ($)
Median household income ($)
Median household income ($) - White
Median household income ($) - Black or African American
Median household income ($) - Asian
Median household income ($) - Hispanic or Latino
Median household income ($) - American Indian and Alaska Native
Median household income ($) - Multirace
Median household income ($) - Other Race
Mortgage status - with mortgage (%)
Mortgage status - with second mortgage (%)
Mortgage status - with home equity loan (%)
Mortgage status - with both second mortgage and home equity loan (%)
Mortgage status - without a mortgage (%)
Median year house/condo built
Median year apartment built
Household type by relationship - Male householder living alone (%)
Household type by relationship - Male householder not living alone (%)
Household type by relationship - Female householder living alone (%)
Household type by relationship - Female householder not living alone (%)
Household type by relationship - Opposite-Sex spouse (%)
Household type by relationship - Same-Sex spouse (%)
Household type by relationship - Opposite-Sex unmarried partner (%)
Household type by relationship - Same-Sex unmarried partner (%)
Household type by relationship - In group quarters (%)
Size of family households - 2-person household (%)
Size of family households - 3-person household (%)
Size of family households - 4-person household (%)
Size of family households - 5-person household (%)
Size of family households - 6-person household (%)
Size of family households - 7-or-more-person household (%)
Size of nonfamily households - 1-person household (%)
Size of nonfamily households - 2-person household (%)
Size of nonfamily households - 3-person household (%)
Size of nonfamily households - 4-person household (%)
Size of nonfamily households - 5-person household (%)
Size of nonfamily households - 6-person household (%)
Size of nonfamily households - 7-or-moreperson household (%)
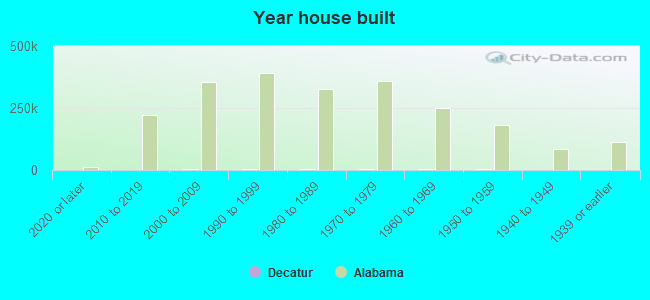
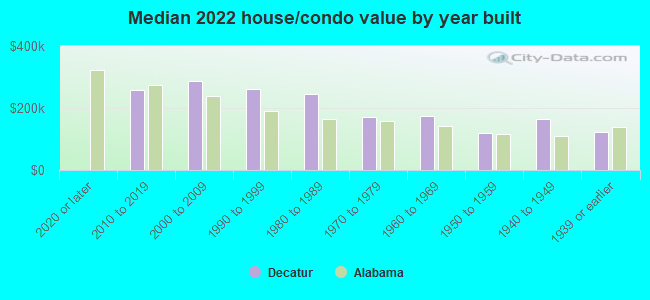
Year house built - Built 2010 or later (%)
Year house built - Built 2000 to 2009 (%)
Year house built - Built 1990 to 1999 (%)
Year house built - Built 1980 to 1989 (%)
Year house built - Built 1970 to 1979 (%)
Year house built - Built 1960 to 1969 (%)
Year house built - Built 1950 to 1959 (%)
Year house built - Built 1940 to 1949 (%)
Year house built - Built 1939 or earlier (%)
Median number of rooms in houses and condos
Median number of rooms in apartments
Median number of bedrooms in owner occupied houses
Mean number of bedrooms in owner occupied houses
Median number of bedrooms in renter occupied houses
Mean number of bedrooms in renter occupied houses
Median number of vehichles in owner occupied houses
Mean number of vehichles in owner occupied houses
Median number of vehichles in renter occupied houses
Mean number of vehichles in renter occupied houses
Rooms in owner-occupied houses - 1 room (%)
Rooms in owner-occupied houses - 2 rooms (%)
Rooms in owner-occupied houses - 3 rooms (%)
Rooms in owner-occupied houses - 4 rooms (%)
Rooms in owner-occupied houses - 5 rooms (%)
Rooms in owner-occupied houses - 6 rooms (%)
Rooms in owner-occupied houses - 7 rooms (%)
Rooms in owner-occupied houses - 8 rooms (%)
Rooms in owner-occupied houses - 9+ rooms (%)
Rooms in renter-occupied houses - 1 room (%)
Rooms in renter-occupied houses - 2 rooms (%)
Rooms in renter-occupied houses - 3 rooms (%)
Rooms in renter-occupied houses - 4 rooms (%)
Rooms in renter-occupied houses - 5 rooms (%)
Rooms in renter-occupied houses - 6 rooms (%)
Rooms in renter-occupied houses - 7 rooms (%)
Rooms in renter-occupied houses - 8 rooms (%)
Rooms in renter-occupied houses - 9+ rooms (%)
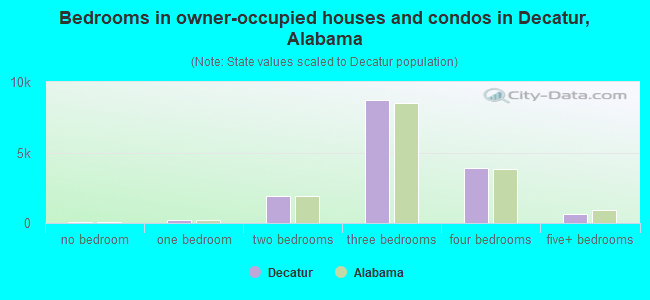
Bedrooms in owner-occupied houses - no bedrooms (%)
Bedrooms in owner-occupied houses - 1 bedroom (%)
Bedrooms in owner-occupied houses - 2 bedrooms (%)
Bedrooms in owner-occupied houses - 3 bedrooms (%)
Bedrooms in owner-occupied houses - 4 bedrooms (%)
Bedrooms in owner-occupied houses - 5+ bedrooms (%)
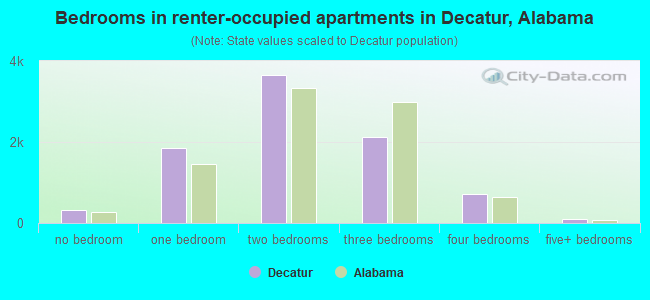
Bedrooms in renter-occupied houses - no bedrooms (%)
Bedrooms in renter-occupied houses - 1 bedroom (%)
Bedrooms in renter-occupied houses - 2 bedrooms (%)
Bedrooms in renter-occupied houses - 3 bedrooms (%)
Bedrooms in renter-occupied houses - 4 bedrooms (%)
Bedrooms in renter-occupied houses - 5+ bedrooms (%)
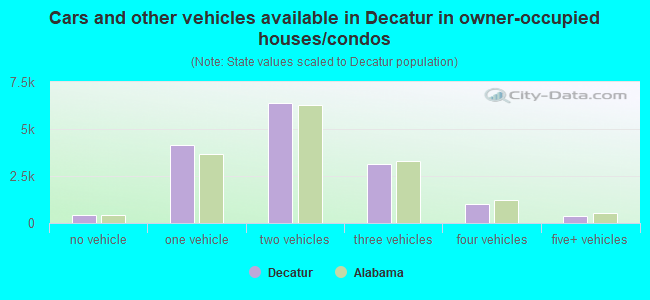
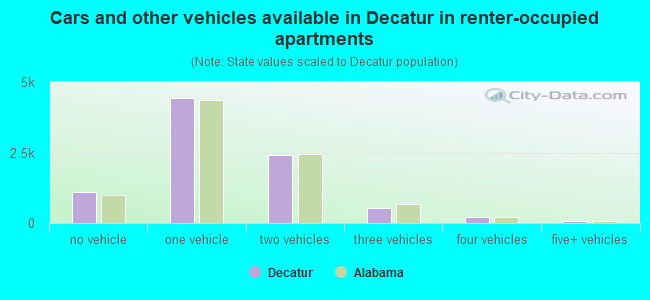
Vehicles available in owner-occupied houses - no vehicle available (%)
Vehicles available in owner-occupied houses - 1 vehicle available(%)
Vehicles available in owner-occupied houses - 2 Vehicles available (%)
Vehicles available in owner-occupied houses - 3 Vehicles available (%)
Vehicles available in owner-occupied houses - 4 Vehicles available (%)
Vehicles available in owner-occupied houses - 5+ Vehicles available (%)
Vehicles available in renter-occupied houses - no vehicle available (%)
Vehicles available in renter-occupied houses - 1 vehicle available (%)
Vehicles available in renter-occupied houses - 2 Vehicles available (%)
Vehicles available in renter-occupied houses - 3 Vehicles available (%)
Vehicles available in renter-occupied houses - 4 Vehicles available (%)
Vehicles available in renter-occupied houses - 5+ Vehicles available (%)
Housing units in structures - 1, detached (%)
Housing units in structures - 1, attached (%)
Housing units in structures - 2 (%)
Housing units in structures - 3 or 4 (%)
Housing units in structures - 5 to 9 (%)
Housing units in structures - 10 to 19 (%)
Housing units in structures - 20 to 49 (%)
Housing units in structures - 50 or more (%)
Housing units in structures - Mobile home (%)
Housing units in structures - Boat, RV, van, etc. (%)
Housing units in structures - Owners - 1, detached (%)
Housing units in structures - Owners - 1, attached (%)
Housing units in structures - Owners - 2 (%)
Housing units in structures - Owners - 3 or 4 (%)
Housing units in structures - Owners - 5 to 9 (%)
Housing units in structures - Owners - 10 to 19 (%)
Housing units in structures - Owners - 20 to 49 (%)
Housing units in structures - Owners - 50 or more (%)
Housing units in structures - Owners - Mobile home (%)
Housing units in structures - Owners - Boat, RV, van, etc. (%)
Housing units in structures - Renters - 1, detached (%)
Housing units in structures - Renters - 1, attached (%)
Housing units in structures - Renters - 2 (%)
Housing units in structures - Renters - 3 or 4 (%)
Housing units in structures - Renters - 5 to 9 (%)
Housing units in structures - Renters - 10 to 19 (%)
Housing units in structures - Renters - 20 to 49 (%)
Housing units in structures - Renters - 50 or more (%)
Housing units in structures - Renters - Mobile home (%)
Housing units in structures - Renters - Boat, RV, van, etc. (%)
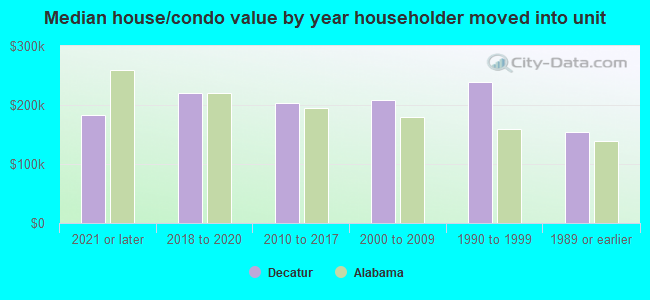
House/condo owner moved in on average (years ago)
Renter moved in on average (years ago)
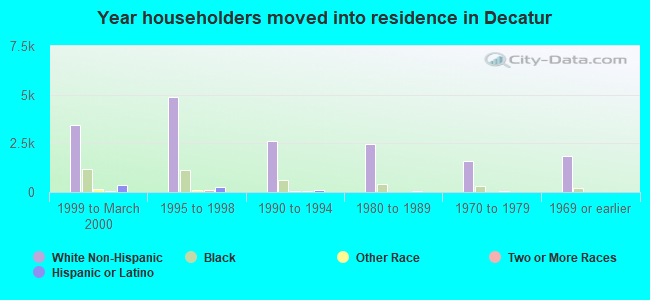
Year householder moved into unit - Moved in 1999 to March 2000 (%)
Year householder moved into unit - Moved in 1999 to March 2000 (%) - White
Year householder moved into unit - Moved in 1999 to March 2000 (%) - Black or African American
Year householder moved into unit - Moved in 1999 to March 2000 (%) - Asian
Year householder moved into unit - Moved in 1999 to March 2000 (%) - Hispanic or Latino
Year householder moved into unit - Moved in 1999 to March 2000 (%) - American Indian and Alaska Native
Year householder moved into unit - Moved in 1999 to March 2000 (%) - Multirace
Year householder moved into unit - Moved in 1999 to March 2000 (%) - Other Race
Year householder moved into unit - Moved in 1995 to 1998 (%)
Year householder moved into unit - Moved in 1995 to 1998 (%) - White
Year householder moved into unit - Moved in 1995 to 1998 (%) - Black or African American
Year householder moved into unit - Moved in 1995 to 1998 (%) - Asian
Year householder moved into unit - Moved in 1995 to 1998 (%) - Hispanic or Latino
Year householder moved into unit - Moved in 1995 to 1998 (%) - American Indian and Alaska Native
Year householder moved into unit - Moved in 1995 to 1998 (%) - Multirace
Year householder moved into unit - Moved in 1995 to 1998 (%) - Other Race
Year householder moved into unit - Moved in 1990 to 1994 (%)
Year householder moved into unit - Moved in 1990 to 1994 (%) - White
Year householder moved into unit - Moved in 1990 to 1994 (%) - Black or African American
Year householder moved into unit - Moved in 1990 to 1994 (%) - Asian
Year householder moved into unit - Moved in 1990 to 1994 (%) - Hispanic or Latino
Year householder moved into unit - Moved in 1990 to 1994 (%) - American Indian and Alaska Native
Year householder moved into unit - Moved in 1990 to 1994 (%) - Multirace
Year householder moved into unit - Moved in 1990 to 1994 (%) - Other Race
Year householder moved into unit - Moved in 1980 to 1989 (%)
Year householder moved into unit - Moved in 1980 to 1989 (%) - White
Year householder moved into unit - Moved in 1980 to 1989 (%) - Black or African American
Year householder moved into unit - Moved in 1980 to 1989 (%) - Asian
Year householder moved into unit - Moved in 1980 to 1989 (%) - Hispanic or Latino
Year householder moved into unit - Moved in 1980 to 1989 (%) - American Indian and Alaska Native
Year householder moved into unit - Moved in 1980 to 1989 (%) - Multirace
Year householder moved into unit - Moved in 1980 to 1989 (%) - Other Race
Year householder moved into unit - Moved in 1970 to 1979 (%)
Year householder moved into unit - Moved in 1970 to 1979 (%) - White
Year householder moved into unit - Moved in 1970 to 1979 (%) - Black or African American
Year householder moved into unit - Moved in 1970 to 1979 (%) - Asian
Year householder moved into unit - Moved in 1970 to 1979 (%) - Hispanic or Latino
Year householder moved into unit - Moved in 1970 to 1979 (%) - American Indian and Alaska Native
Year householder moved into unit - Moved in 1970 to 1979 (%) - Multirace
Year householder moved into unit - Moved in 1970 to 1979 (%) - Other Race
Year householder moved into unit - Moved in 1969 or earlier (%)
Year householder moved into unit - Moved in 1969 or earlier (%) - White
Year householder moved into unit - Moved in 1969 or earlier (%) - Black or African American
Year householder moved into unit - Moved in 1969 or earlier (%) - Asian
Year householder moved into unit - Moved in 1969 or earlier (%) - Hispanic or Latino
Year householder moved into unit - Moved in 1969 or earlier (%) - American Indian and Alaska Native
Year householder moved into unit - Moved in 1969 or earlier (%) - Multirace
Year householder moved into unit - Moved in 1969 or earlier (%) - Other Race
Housing units lacking complete plumbing facilities (%)
Housing units lacking complete kitchen facilities (%)
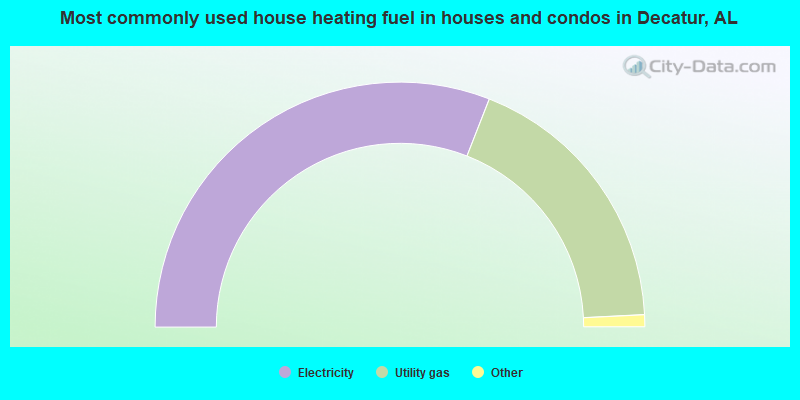
House heating fuel used in houses and condos - Utility gas (%)
House heating fuel used in houses and condos - Bottled, tank, or LP gas (%)
House heating fuel used in houses and condos - Electricity (%)
House heating fuel used in houses and condos - Fuel oil, kerosene, etc. (%)
House heating fuel used in houses and condos - Coal or coke (%)
House heating fuel used in houses and condos - Wood (%)
House heating fuel used in houses and condos - Solar energy (%)
House heating fuel used in houses and condos - Other fuel (%)
House heating fuel used in houses and condos - No fuel used (%)
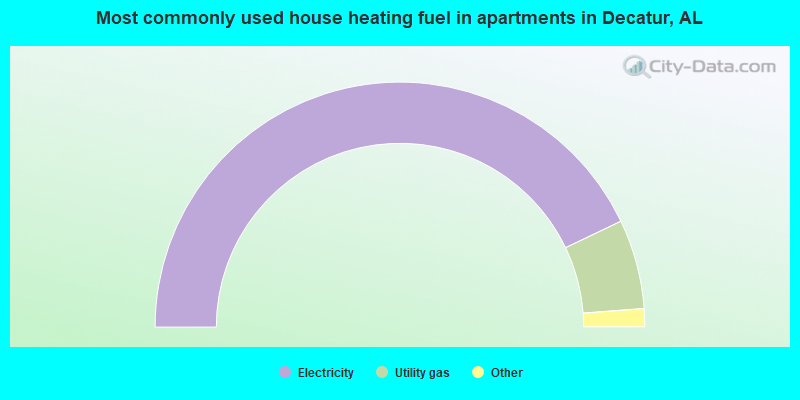
House heating fuel used in apartments - Utility gas (%)
House heating fuel used in apartments - Bottled, tank, or LP gas (%)
House heating fuel used in apartments - Electricity (%)
House heating fuel used in apartments - Fuel oil, kerosene, etc. (%)
House heating fuel used in apartments - Coal or coke (%)
House heating fuel used in apartments - Wood (%)
House heating fuel used in apartments - Solar energy (%)
House heating fuel used in apartments - Other fuel (%)
House heating fuel used in apartments - No fuel used (%)
Latest news about housing in Decatur, AL collected exclusively by city-data.com from local newspapers, TV, and radio stations
Median year house/condo built: 1979Median year apartment built: 1977Household type by relationship:
Households: 58,043
Male householders: 11,506 (3,526 living alone ), Female householders: 12,380 (5,046 living alone )9,929 spouses (9,897 opposite-sex spouses ), 1,259 unmarried partners , (1,247 opposite-sex unmarried partners ), 16,096 children (15,166 natural , 651 adopted , 278 stepchildren ), 1,644 grandchildren , 984 brothers or sisters , 444 parents , 139 foster children , 714 other relatives , 1,617 non-relatives In group quarters: 1,324
Size of family households: 6,948 2-persons , 3,821 3-persons , 2,227 4-persons , 753 5-persons , 395 6-persons , 557 7-or-more-persons .
Size of nonfamily households: 8,288 1-person , 1,197 2-persons , 13 3-persons , 43 4-persons , 11 5-persons , 9 6-persons .
6,915 married couples with children. single-parent households (1,216 men , 3,234 women ).
86.5% of residents of Decatur speak English at home. of residents speak Spanish at home (59% speak English very well , 20% speak English well , 16% speak English not well , 5% don't speak English at all ).of residents speak other Indo-European language at home (79% speak English very well , 21% speak English well ).of residents speak Asian or Pacific Island language at home (89% speak English very well , 1% speak English well , 10% speak English not well ).of residents speak other language at home (28% speak English very well , 5% speak English well , 64% speak English not well , 3% don't speak English at all ).
Foreign born population: 5,717 (9.8%)of them are naturalized citizens )
Median number of rooms in houses and condos:
Median number of rooms in apartments
Owner-occupied Renter-occupied
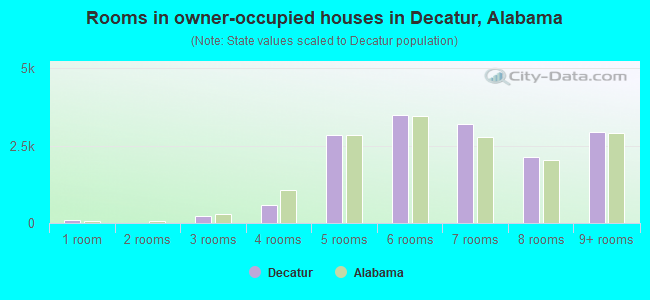
Rooms in owner-occupied houses in Decatur, Alabama
86 1 room 0 2 rooms 214 3 rooms 594 4 rooms 2,845 5 rooms 3,491 6 rooms 3,195 7 rooms 2,120 8 rooms 2,926 9+ rooms
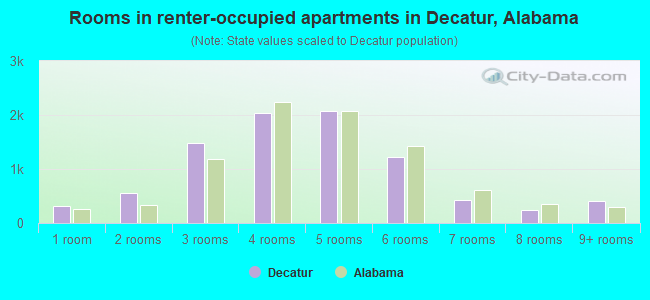
Rooms in renter-occupied apartments in Decatur, Alabama
319 1 room 551 2 rooms 1,481 3 rooms 2,035 4 rooms 2,080 5 rooms 1,213 6 rooms 430 7 rooms 245 8 rooms 410 9+ rooms
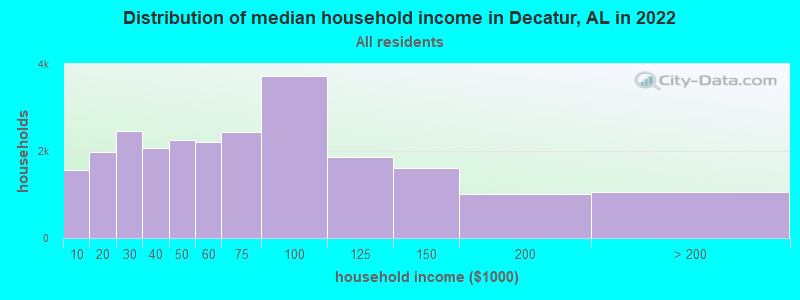
Decatur, AL household income distribution 1,556 Less than $10,0001,984 $10,000 to $19,9992,466 $20,000 to $29,9992,075 $30,000 to $39,9992,264 $40,000 to $49,9992,211 $50,000 to $59,9992,440 $60,000 to $74,9993,715 $75,000 to $99,9991,858 $100,000 to $124,9991,610 $125,000 to $149,9991,007 $150,000 to $199,9991,062 $200,000 or more
Home value of owner - occupied houses in 2022 in Decatur, AL 70 Less than $10,00088 $10,000 to $14,999180 $15,000 to $19,99938 $20,000 to $24,99941 $25,000 to $29,99939 $30,000 to $34,99963 $35,000 to $39,999188 $40,000 to $49,999127 $50,000 to $59,999378 $60,000 to $69,999258 $70,000 to $79,999412 $80,000 to $89,999524 $90,000 to $99,9991,821 $100,000 to $124,999879 $125,000 to $149,9991,805 $150,000 to $174,9991,498 $175,000 to $199,9991,703 $200,000 to $249,9991,863 $250,000 to $299,9991,538 $300,000 to $399,999884 $400,000 to $499,9991,125 $500,000 to $749,99988 $750,000 to $999,99959 $1,000,000 to $1,499,99914 $1,500,000 to $1,999,999Rent paid by renters in 2022 in Decatur, AL 72 Less than $100131 $100 to $14935 $150 to $199150 $200 to $24952 $250 to $29983 $300 to $349340 $350 to $399302 $400 to $449424 $450 to $4991,046 $500 to $549717 $550 to $599898 $600 to $649621 $650 to $699424 $700 to $749664 $750 to $7991,101 $800 to $899930 $900 to $999251 $1,000 to $1,249117 $1,250 to $1,499217 $1,500 to $1,99949 $2,000 to $2,49928 $2,500 to $2,99918 $3,500 or more479 No cash rent
Percentage of workers working in this county: 76.8%Number of people working at home: 1,287 (4.9% of all workers )
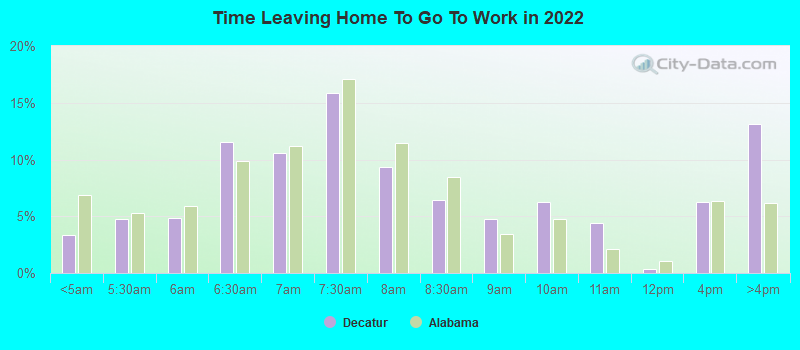
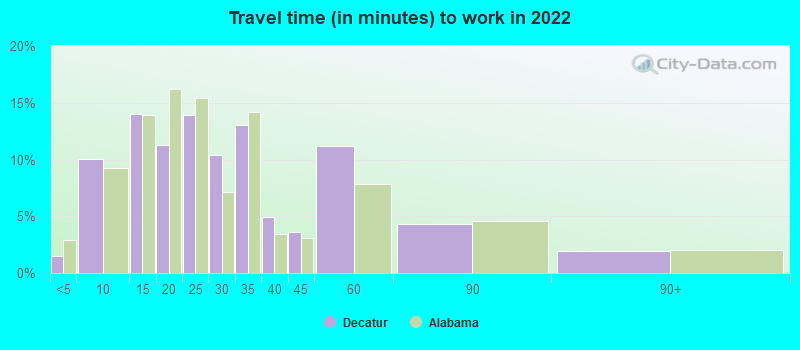
Travel time to work (commute)
Less than 5 minutes: 5165 to 9 minutes: 4,56810 to 14 minutes: 4,99115 to 19 minutes: 3,17320 to 24 minutes: 2,62225 to 29 minutes: 1,14230 to 34 minutes: 2,45235 to 39 minutes: 94340 to 44 minutes: 54245 to 59 minutes: 1,56760 to 89 minutes: 57790 or more minutes: 257
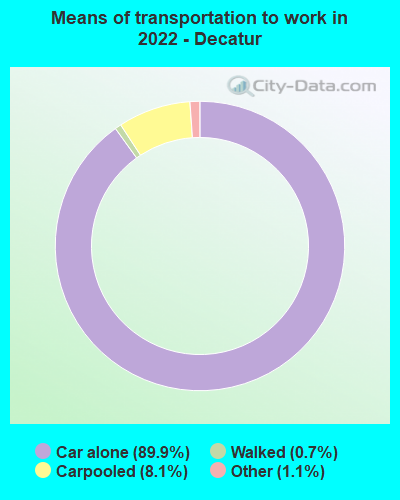
Means of transportation to work:
Drove a car alone: 29,505 (84.9%)Carpooled: 2,695 (7.8%)Bus : 24 (0.1%)Taxi: 500 (1.4%)Bicycle: 23 (0.1%)Walked: 236 (0.7%)Worked at home: 1,287 (3.7%)
Unemployment by race in 2022
Unemployment rate for White non-Hispanic residents 2.7% Males4.5% FemalesUnemployment rate for Black residents 6.5% Males7.0% FemalesUnemployment rate for American Indian and Alaska Native residents 13.8% MalesUnemployment rate for Asian residents 1.6% FemalesUnemployment rate for other race residents 0.7% MalesUnemployment rate for two or more race residents 2.0% MalesUnemployment rate for Hispanic or Latino residents 4.2% Males
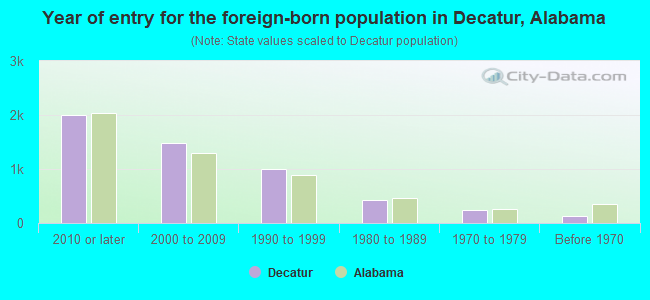
Year of entry for the foreign-born population in Decatur, Alabama
1,997 2010 or later 1,487 2000 to 2009 1,006 1990 to 1999 427 1980 to 1989 239 1970 to 1979 128 Before 1970
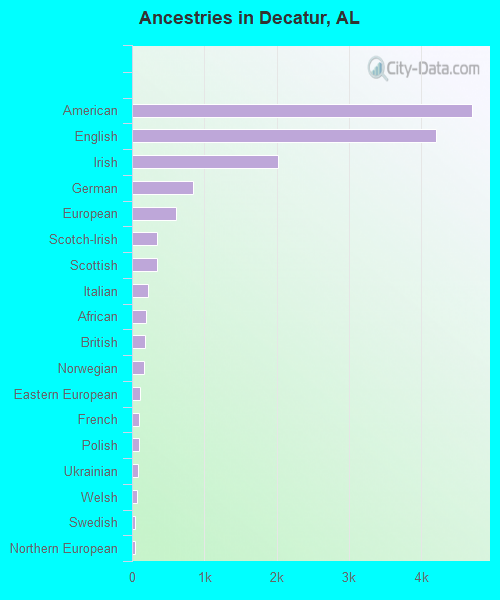
First ancestries reported:
American: 4,705 (14.7%)
English: 4,205 (13.2%)
Irish: 2,015 (6.3%)
German: 849 (2.7%)
European: 612 (1.9%)
Scotch-Irish: 351 (1.1%)
Scottish: 351 (1.1%)
Italian: 216 (0.7%)
African: 193 (0.6%)
British: 175 (0.5%)
Norwegian: 169 (0.5%)
Eastern European: 104 (0.3%)
French: 97 (0.3%)
Polish: 94 (0.3%)
Ukrainian: 88 (0.3%)
Welsh: 67 (0.2%)
Swedish: 47 (0.1%)
Northern European: 44 (0.1%)
Romanian: 36 (0.1%)
Dutch: 32 (0.1%)
Greek: 30 (0.09%)
Ugandan: 30 (0.09%)
Arab: 23 (0.07%)
Lebanese: 20 (0.06%)
Iranian: 17 (0.05%)
Armenian: 14 (0.04%)
U.S. Virgin Islander: 14 (0.04%)
Slovak: 13 (0.04%)
Canadian: 9 (0.03%)
French Canadian: 6 (0.02%)
Swiss: 6 (0.02%)
Celtic: 4 (0.01%) Most common places of birth for foreign-born residents (%): Mexico Decatur:
41.9% (1,912)Alabama:
26.4% (46,832)
Guatemala Decatur:
21.9% (1,002)Alabama:
8.6% (15,159)
Yemen Decatur:
20.3% (926)Alabama:
0.6% (1,026)
Vietnam Decatur:
2.4% (110)Alabama:
3.6% (6,414)
Cuba Decatur:
1.9% (88)Alabama:
1.2% (2,134)
Place of birth for U.S.-born residents:
This state: 37,871Other state: 14,416Northeast: 963Midwest: 3,384South: 7,944West: 2,033 89.1% of Decatur residents lived in the same house 1 years ago.
Out of people who lived in different houses, 34.9% lived in this county.
Out of people who lived in different counties, 58.7% lived in Alabama.
Decatur:
89.1%State average:
87.6%
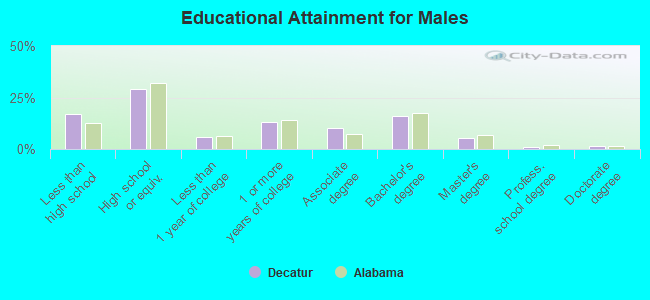
Education attainment for males 25 years and older:
No schooling: 772Nursery to 4th grade: 2055th and 6th grade: 3467th and 8th grade: 3549th grade: 56210th grade: 35511th grade: 30712th grade, no diploma: 486High school graduate (or equivalency): 5,790Less than 1 year of college: 1,189Some college more than 1 year, no degree: 2,626Associate degree: 2,057Bachelor's degree: 3,154Master's degree: 1,015Professional school degree: 231Doctorate degree: 291
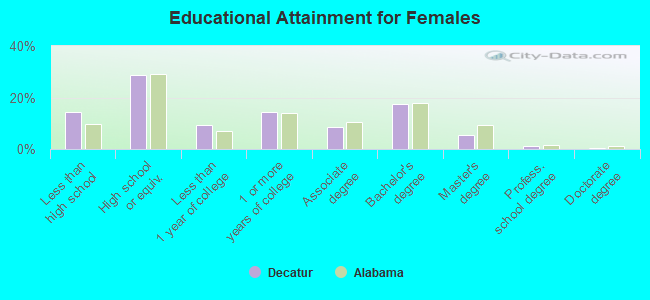
Education attainment for females 25 years and older:
No schooling: 641Nursery to 4th grade: 465th and 6th grade: 1867th and 8th grade: 2609th grade: 11810th grade: 48311th grade: 47112th grade, no diploma: 737High school graduate (or equivalency): 5,957Less than 1 year of college: 1,895Some college more than 1 year, no degree: 2,995Associate degree: 1,744Bachelor's degree: 3,622Master's degree: 1,147Professional school degree: 229Doctorate degree: 96
Housing units in structures:
One, detached: 17,886One, attached: 1,448Two: 5383 or 4: 1,1405 to 9: 2,27310 to 19: 95720 to 49: 59050 or more: 591Mobile homes: 505Housing units lacking complete plumbing facilities in 2022: 1.3%Housing units lacking complete kitchen facilities in 2022: 1.9%House/condo owner moved in on average 11 years ago
Renter moved in on average 3 years ago
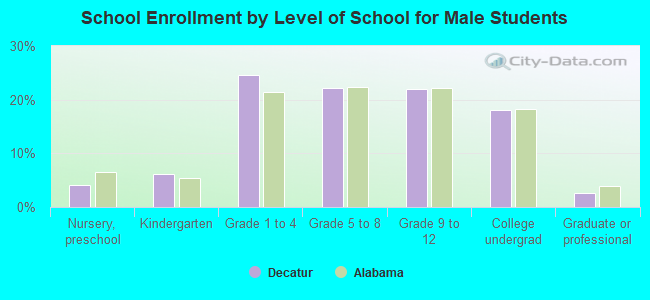
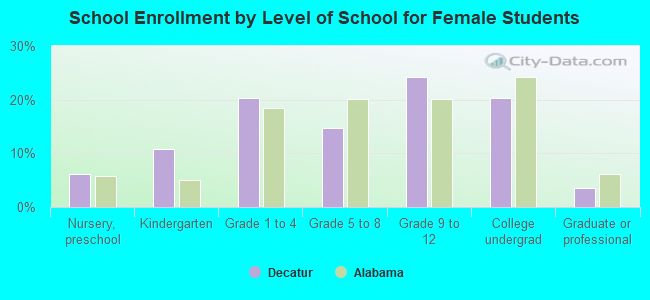
Private vs. public school enrollment:
Students in private schools in grades 1 to 8 (elementary and middle school): 737 Students in private schools in grades 9 to 12 (high school): 253 Students in private undergraduate colleges: 225