Del Rio, TX (Texas) Houses and Residents
| Del Rio: | $148,346 |
| Texas: | $275,400 |
Mean price in 2022:
Detached houses: $202,991
Here: $202,991 State: $369,058 Townhouses or other attached units: $157,412
Here: $157,412 State: $327,631 In 2-unit structures: $175,029
Here: $175,029 State: $374,947 In 3-to-4-unit structures: $125,679
Here: $125,679 State: $209,652 Mobile homes: $154,916
Here: $154,916 State: $124,413
Total population: 36,079 (Urban population: 33,781 (all inside urban clusters), Rural population: 301 (all nonfarm))
Houses: 13,795 (12,667 occupied: 8,573 owner occupied, 4,284 renter occupied)
| % of renters here: | 33% |
| State: | 38% |
Housing density: 894 houses/condos per square mile
Median price asked for vacant for-sale houses and condos in 2022: $240,465.
Median contract rent in 2022: $692 (lower quartile is $503, upper quartile is $920)
Median rent asked for vacant for-rent units in 2022: $669
Median gross rent in Del Rio, TX in 2022: $887
Housing units in Del Rio with a mortgage: 3,482 (80 second mortgage, 0 home equity loan, 73 both second mortgage and home equity loan)
Houses without a mortgage: 72
Median household income for houses/condos with a mortgage: $100,644
Median household income for apartments without a mortgage: $50,505
Median monthly housing costs: $796
Compare current foreclosures near Del Rio, TX:
| Photo | Address | Area | Beds / Baths | Price | Details |
|---|---|---|---|---|---|

|
#1
W 1st St
Del Rio, TX 78840
|
3,029 sq. feet
|
2 baths 4 beds |
$79,900
|
show details |

|
#2
E 1st St
Del Rio, TX 78840
|
- sq. feet
|
- baths - beds |
$20,400
|
show details |

|
#3
E 1st St
Del Rio, TX 78840
|
- sq. feet
|
- baths - beds |
$20,400
|
show details |

|
#4
Lean Dr
Del Rio, TX 78840
|
3,139 sq. feet
|
2 baths 4 beds |
show details | |

|
#5
W Ney St
Del Rio, TX 78840
|
1,811 sq. feet
|
2 baths 2 beds |
show details | |

|
#6
Ellis St
Del Rio, TX 78840
|
898 sq. feet
|
2 baths - beds |
show details | |

|
#7
Nighthawk Trl
Del Rio, TX 78840
|
1,796 sq. feet
|
- baths - beds |
show details | |

|
#8
Dos Pistolas
Del Rio, TX 78840
|
- sq. feet
|
- baths - beds |
show details | |

|
#9
Dennis Dr
Del Rio, TX 78840
|
1,112 sq. feet
|
- baths - beds |
show details | |

|
#10
Hermosa Dr
Del Rio, TX 78840
|
1,308 sq. feet
|
- baths - beds |
show details |
| Photo | Address | Area | Beds / Baths | Price | Details |
|---|---|---|---|---|---|

|
#11
Arteaga St
Del Rio, TX 78840
|
- sq. feet
|
- baths - beds |
show details | |

|
#12
E Garza St
Del Rio, TX 78840
|
- sq. feet
|
- baths - beds |
show details | |

|
#13
E 9th St
Del Rio, TX 78840
|
1,820 sq. feet
|
- baths - beds |
show details | |

|
#14
Greenwillow St
Del Rio, TX 78840
|
1,216 sq. feet
|
- baths - beds |
show details | |

|
#15
Bean
Del Rio, TX 78840
|
943 sq. feet
|
- baths - beds |
show details | |

|
Check over 1 million property listings on Foreclosure.com!
|
browse all offers | |||


 | 10,000 Affordable Housing Units coming to SA. (34 replies) |
| Nuclear-Level Annihilation Coming for Texas (299 replies) |
| Looking for at least 30 to 40 acre ranch in Texas (30 replies) |
| Where all in Texas have y'all lived??? (62 replies) |
| What do you like about Texas? (57 replies) |
| Texas being excluded from the South (743 replies) |

Median year apartment built: 1985
Household type by relationship:
Households: 35,655- Male householders: 5,932 (1,514 living alone), Female householders: 6,560 (1,732 living alone)
5,835 spouses (5,775 opposite-sex spouses), 563 unmarried partners, (450 opposite-sex unmarried partners), 11,589 children (10,879 natural, 108 adopted, 600 stepchildren), 1,765 grandchildren, 464 brothers or sisters, 357 parents, 29 foster children, 738 other relatives, 492 non-relatives
- In group quarters: 1,325
Size of family households: 2,927 2-persons, 1,829 3-persons, 1,910 4-persons, 1,409 5-persons, 718 6-persons, 156 7-or-more-persons.
Size of nonfamily households: 3,421 1-person, 326 2-persons, 74 3-persons, 13 5-persons.
5,109 married couples with children.
3,008 single-parent households (649 men, 2,359 women).
32.6% of residents of Del Rio speak English at home.
66.6% of residents speak Spanish at home (67% speak English very well, 12% speak English well, 15% speak English not well, 6% don't speak English at all).
0.3% of residents speak other Indo-European language at home (100% speak English very well).
0.1% of residents speak Asian or Pacific Island language at home (37% speak English very well, 63% speak English not well).
Foreign born population: 7,971 (22.4%)
(53.5% of them are naturalized citizens)
| Here: | 5.5 |
| State: | 6.3 |
| Here: | 4.0 |
| State: | 4.0 |

- Bedrooms in owner-occupied houses and condos in Del Rio, Texas
- 185no bedroom
- 2651 bedroom
- 1,5652 bedrooms
- 4,5083 bedrooms
- 1,8914 bedrooms
- 1605+ bedrooms

- Bedrooms in renter-occupied apartments in Del Rio, Texas
- 685no bedroom
- 7131 bedroom
- 1,7202 bedrooms
- 9533 bedrooms
- 2134 bedrooms
- 05+ bedrooms

- Cars and other vehicles available in Del Rio in owner-occupied houses/condos
- 531no vehicle
- 1,8231 vehicle
- 3,6422 vehicles
- 1,8503 vehicles
- 4704 vehicles
- 2585+ vehicles

- Cars and other vehicles available in Del Rio in renter-occupied apartments
- 317no vehicle
- 2,2531 vehicle
- 1,2192 vehicles
- 3613 vehicles
- 1254 vehicles
- 105+ vehicles

- Rooms in owner-occupied houses in Del Rio, Texas
- 1711 room
- 592 rooms
- 3973 rooms
- 1,2274 rooms
- 2,4285 rooms
- 1,6796 rooms
- 1,1887 rooms
- 6158 rooms
- 8099+ rooms

- Rooms in renter-occupied apartments in Del Rio, Texas
- 6851 room
- 4292 rooms
- 4033 rooms
- 1,0334 rooms
- 9515 rooms
- 4296 rooms
- 2477 rooms
- 198 rooms
- 899+ rooms


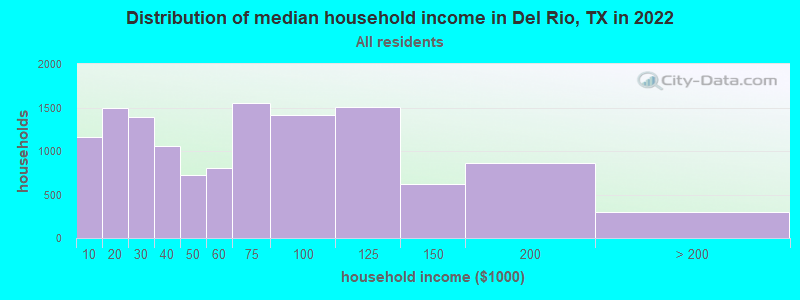
Del Rio, TX household income distribution

- 1,160Less than $10,000
- 1,500$10,000 to $19,999
- 1,388$20,000 to $29,999
- 1,053$30,000 to $39,999
- 721$40,000 to $49,999
- 801$50,000 to $59,999
- 1,548$60,000 to $74,999
- 1,412$75,000 to $99,999
- 1,511$100,000 to $124,999
- 619$125,000 to $149,999
- 865$150,000 to $199,999
- 297$200,000 or more
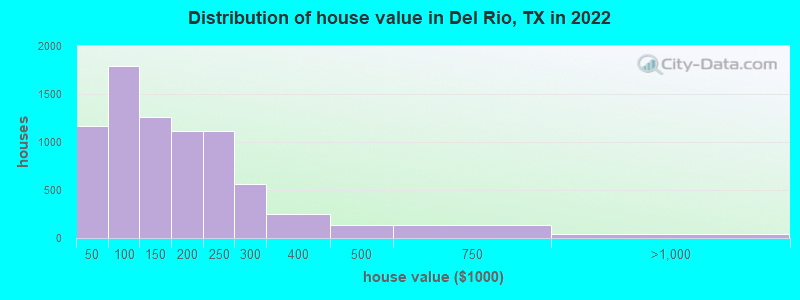
Home value of owner - occupied houses in 2022 in Del Rio, TX
-
- 223Less than $10,000
- 95$10,000 to $14,999
- 77$15,000 to $19,999
- 142$20,000 to $24,999
- 74$25,000 to $29,999
- 199$30,000 to $34,999
- 48$35,000 to $39,999
- 302$40,000 to $49,999
- 241$50,000 to $59,999
- 235$60,000 to $69,999
- 154$70,000 to $79,999
- 356$80,000 to $89,999
- 500$90,000 to $99,999
- 735$100,000 to $124,999
- 528$125,000 to $149,999
- 716$150,000 to $174,999
- 401$175,000 to $199,999
- 1,113$200,000 to $249,999
- 564$250,000 to $299,999
- 253$300,000 to $399,999
- 132$400,000 to $499,999
- 132$500,000 to $749,999
- 18$750,000 to $999,999
- 28$1,000,000 to $1,499,999
Rent paid by renters in 2022 in Del Rio, TX
-
- 182Less than $100
- 79$100 to $149
- 38$150 to $199
- 17$200 to $249
- 93$250 to $299
- 89$300 to $349
- 77$350 to $399
- 162$400 to $449
- 162$450 to $499
- 160$500 to $549
- 295$550 to $599
- 299$600 to $649
- 317$650 to $699
- 189$700 to $749
- 205$750 to $799
- 430$800 to $899
- 56$900 to $999
- 441$1,000 to $1,249
- 228$1,250 to $1,499
- 153$1,500 to $1,999
- 43$2,000 to $2,499
- 333No cash rent

Percentage of workers working in this county: 91.8%
Number of people working at home: 452 (2.9% of all workers)
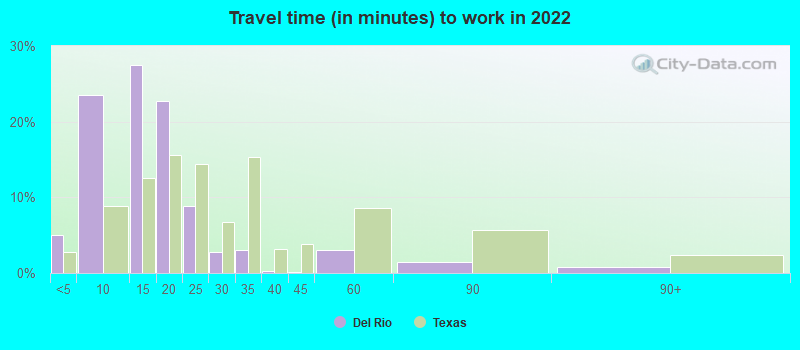
Travel time to work (commute)
- Less than 5 minutes: 679
- 5 to 9 minutes: 3,029
- 10 to 14 minutes: 3,844
- 15 to 19 minutes: 3,212
- 20 to 24 minutes: 1,655
- 25 to 29 minutes: 427
- 30 to 34 minutes: 605
- 35 to 39 minutes: 19
- 40 to 44 minutes: 20
- 45 to 59 minutes: 307
- 60 to 89 minutes: 91
- 90 or more minutes: 660
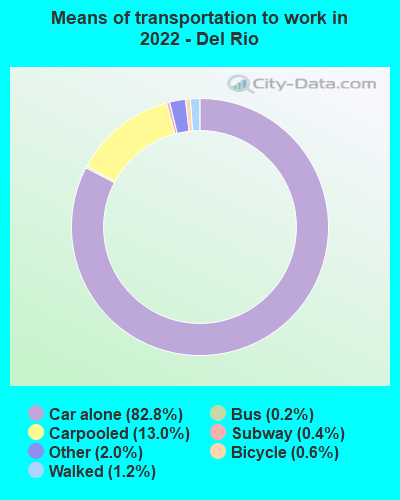
Means of transportation to work:
- Drove a car alone: 12,589 (76.8%)
- Carpooled: 2,143 (13.1%)
- Bus: 23 (0.1%)
- Long-distance train or commuter rail: 61 (0.4%)
- Taxi: 366 (2.2%)
- Bicycle: 83 (0.5%)
- Walked: 190 (1.2%)
- Worked at home: 452 (2.8%)
- Unemployment by race in 2022
- Unemployment rate for White non-Hispanic residents
- 2.3%Males
- 1.1%Females
- Unemployment rate for other race residents
- 9.3%Females
- Unemployment rate for two or more race residents
- 3.4%Males
- Unemployment rate for Hispanic or Latino residents
- 1.7%Males
- 2.7%Females

- Year of entry for the foreign-born population in Del Rio, Texas
- 1,6382010 or later
- 1,5112000 to 2009
- 8001990 to 1999
- 1,7151980 to 1989
- 2,3801970 to 1979
- 2,117Before 1970

First ancestries reported:
- English: 704 (2.8%)
- American: 384 (1.5%)
- German: 346 (1.4%)
- Irish: 136 (0.5%)
- Arab: 97 (0.4%)
- Scottish: 95 (0.4%)
- Italian: 62 (0.2%)
- European: 53 (0.2%)
- African: 38 (0.2%)
- Northern European: 28 (0.1%)
- Norwegian: 26 (0.1%)
- Portuguese: 26 (0.1%)
- Polish: 15 (0.06%)
- Austrian: 14 (0.06%)
- French Canadian: 10 (0.04%)
- French: 9 (0.04%)
- Scotch-Irish: 9 (0.04%)
- Czech: 5 (0.02%)
- Welsh: 5 (0.02%)
- Haitian: 4 (0.02%)
Most common places of birth for foreign-born residents (%):
| Del Rio: | 84.0% (6,695) |
| Texas: | 48.4% (2,411,723) |
| Del Rio: | 5.3% (425) |
| Texas: | 3.0% (147,182) |
| Del Rio: | 2.1% (168) |
| Texas: | 1.8% (87,382) |
Place of birth for U.S.-born residents:
- This state: 23,377
- Other state: 3,673
- Northeast: 346
- Midwest: 1,195
- South: 752
- West: 1,399
85.7% of Del Rio residents lived in the same house 1 years ago.
Out of people who lived in different houses, 37.1% lived in this county.
Out of people who lived in different counties, 72.5% lived in Texas.
| Del Rio: | 85.7% |
| State average: | 85.7% |
Education attainment for males 25 years and older:
- No schooling: 953
- Nursery to 4th grade: 185
- 5th and 6th grade: 657
- 7th and 8th grade: 202
- 9th grade: 128
- 10th grade: 169
- 11th grade: 268
- 12th grade, no diploma: 339
- High school graduate (or equivalency): 3,067
- Less than 1 year of college: 823
- Some college more than 1 year, no degree: 1,109
- Associate degree: 978
- Bachelor's degree: 1,368
- Master's degree: 394
- Professional school degree: 241
- Doctorate degree: 110

Education attainment for females 25 years and older:
- No schooling: 1,076
- Nursery to 4th grade: 159
- 5th and 6th grade: 491
- 7th and 8th grade: 320
- 9th grade: 241
- 10th grade: 83
- 11th grade: 291
- 12th grade, no diploma: 366
- High school graduate (or equivalency): 2,873
- Less than 1 year of college: 792
- Some college more than 1 year, no degree: 703
- Associate degree: 1,019
- Bachelor's degree: 1,317
- Master's degree: 917
- Professional school degree: 64
- Doctorate degree: 0


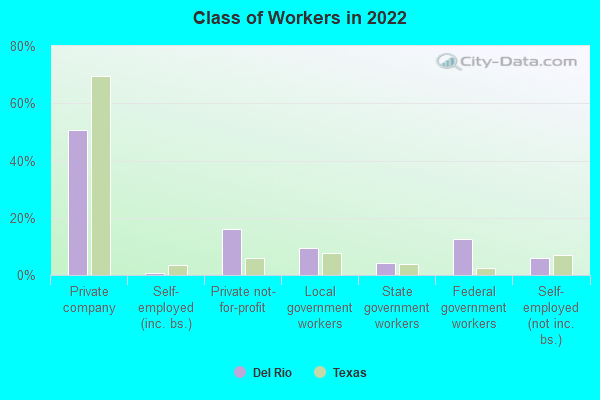
Housing units in structures:
- One, detached: 10,036
- One, attached: 422
- Two: 552
- 3 or 4: 898
- 5 to 9: 370
- 10 to 19: 49
- 20 to 49: 230
- 50 or more: 550
- Mobile homes: 683
Median worth of mobile homes: $49,319
Housing units lacking complete kitchen facilities in 2022: 3.2%
House/condo owner moved in on average 15 years ago
Renter moved in on average 4 years ago

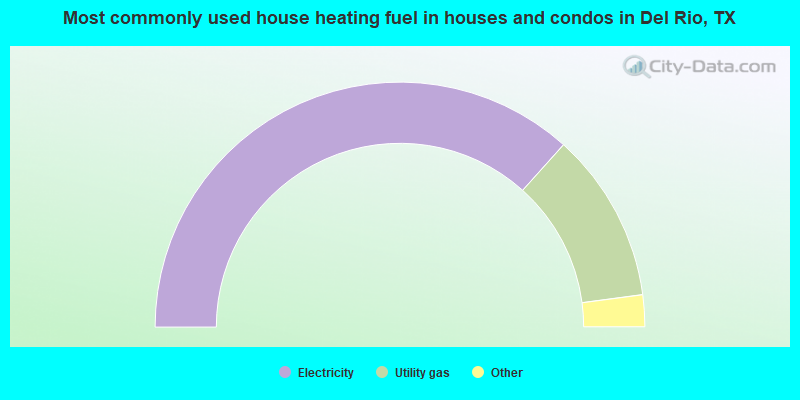
- 73.3%Electricity
- 22.5%Utility gas
- 2.8%Bottled, tank, or LP gas
- 0.8%No fuel used
- 0.3%Wood
- 0.2%Solar energy
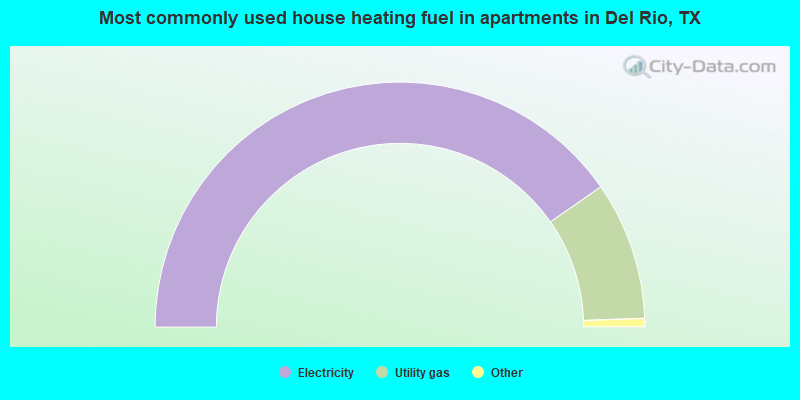
- 80.7%Electricity
- 18.3%Utility gas
- 0.8%Wood
- 0.3%No fuel used
Private vs. public school enrollment:
| Here: | 10.6% |
| Texas: | 8.8% |
| Here: | 8.0% |
| Texas: | 8.0% |
| Here: | 22.4% |
| Texas: | 16.2% |


