Del Sol-Loma Linda, TX (Texas) Houses and Residents
| Del Sol-Loma Linda: | $99,185 |
| Texas: | $275,400 |
Total population: 736 (Urban population: 0, Rural population: 720 (all nonfarm))
Houses: 230 (218 occupied: 184 owner occupied, 34 renter occupied)
| % of renters here: | 16% |
| State: | 38% |
Housing density: 83 houses/condos per square mile
Median price asked for vacant for-sale houses and condos in 2022 in this county: $333,547.
Median contract rent in 2022: $659 (lower quartile is $703, upper quartile is $650)
Median rent asked for vacant for-rent units in 2022: $539
Median gross rent in Del Sol-Loma Linda, TX in 2022: $852
Housing units in Del Sol-Loma Linda with a mortgage: 38 (0 second mortgage, 11 home equity loan, 0 both second mortgage and home equity loan)
Houses without a mortgage: 53
Compare current foreclosures near Del Sol-Loma Linda, TX:
| Photo | Address | Area | Beds / Baths | Price | Details |
|---|---|---|---|---|---|

|
#1
Hemlock Rd
Corpus Christi, TX 78410
|
1,412 sq. feet
|
2 baths 4 beds |
show details | |

|
#2
Red River Dr
Corpus Christi, TX 78410
|
2,586 sq. feet
|
2 baths 4 beds |
show details | |

|
#3
Randolph Cir
Corpus Christi, TX 78410
|
3,766 sq. feet
|
4 baths 3 beds |
show details | |

|
#4
Barlow Trl
Corpus Christi, TX 78410
|
- sq. feet
|
2 baths 4 beds |
show details | |

|
#5
Maverick Drive
Corpus Christi, TX 78410
|
1,621 sq. feet
|
2 baths 3 beds |
show details | |

|
#6
Beal Dr
Corpus Christi, TX 78410
|
5,090 sq. feet
|
- baths 6 beds |
show details | |

|
#7
Oglethorpe Dr
Corpus Christi, TX 78410
|
1,037 sq. feet
|
- baths - beds |
show details | |

|
#8
Lang Rd Apt 6507
Portland, TX 78374
|
- sq. feet
|
- baths - beds |
show details | |

|
#9
Leopard St
Corpus Christi, TX 78409
|
- sq. feet
|
- baths - beds |
show details | |

|
#10
Basswood Dr
Corpus Christi, TX 78410
|
- sq. feet
|
- baths - beds |
show details |
| Photo | Address | Area | Beds / Baths | Price | Details |
|---|---|---|---|---|---|

|
#11
Big Cyprus Byu
Corpus Christi, TX 78410
|
- sq. feet
|
- baths - beds |
show details | |

|
#12
Creekside Dr
Corpus Christi, TX 78410
|
1,914 sq. feet
|
- baths - beds |
show details | |

|
#13
Bay Landing Dr
Portland, TX 78374
|
- sq. feet
|
- baths - beds |
show details | |

|
#14
Akins Dr, Apt 1003
Portland, TX 78374
|
- sq. feet
|
- baths - beds |
show details | |

|
#15
Wood River Dr Apt 1501
Corpus Christi, TX 78410
|
- sq. feet
|
- baths - beds |
show details | |

|
#16
Mcnorton Rd
Corpus Christi, TX 78409
|
720 sq. feet
|
- baths - beds |
show details | |

|
#17
Big Cyprus Byu
Corpus Christi, TX 78410
|
1,515 sq. feet
|
- baths - beds |
show details | |

|
#18
Palm Dr
Corpus Christi, TX 78407
|
1,077 sq. feet
|
- baths - beds |
show details | |

|
#19
Manchester Ave
Corpus Christi, TX 78407
|
1,056 sq. feet
|
- baths - beds |
show details | |

|
#20
N Commonsway Dr Apt E
Portland, TX 78374
|
- sq. feet
|
- baths - beds |
show details |
| Photo | Address | Area | Beds / Baths | Price | Details |
|---|---|---|---|---|---|

|
#21
Vernon Dr
Corpus Christi, TX 78407
|
- sq. feet
|
- baths - beds |
show details | |

|
#22
Timber Ridge Dr
Portland, TX 78374
|
- sq. feet
|
- baths - beds |
show details | |

|
#23
Vernon Dr
Corpus Christi, TX 78407
|
1,434 sq. feet
|
- baths - beds |
show details | |

|
#24
Amanda Ln
Robstown, TX 78380
|
- sq. feet
|
- baths - beds |
show details | |

|
#25
Pacific Dr
Portland, TX 78374
|
- sq. feet
|
- baths - beds |
show details | |

|
#26
N Grando Circle Dr
Robstown, TX 78380
|
- sq. feet
|
- baths - beds |
show details | |

|
#27
N Grando Circle Dr
Robstown, TX 78380
|
- sq. feet
|
- baths - beds |
show details | |

|
#28
Hampshire Rd
Corpus Christi, TX 78408
|
1,010 sq. feet
|
- baths - beds |
show details | |

|
#29
San Jose St
Portland, TX 78374
|
- sq. feet
|
- baths - beds |
show details | |

|
#30
Imperial St
Portland, TX 78374
|
- sq. feet
|
- baths - beds |
show details |
| Photo | Address | Area | Beds / Baths | Price | Details |
|---|---|---|---|---|---|

|
#31
County Road 1458
Taft, TX 78390
|
- sq. feet
|
- baths - beds |
show details | |

|
#32
Jade Dr
Corpus Christi, TX 78409
|
- sq. feet
|
- baths - beds |
show details | |

|
#33
Red Creek Cir
Corpus Christi, TX 78410
|
1,204 sq. feet
|
- baths - beds |
show details | |

|
#34
Live Oak St
Corpus Christi, TX 78408
|
960 sq. feet
|
- baths - beds |
show details | |

|
#35
County Road 4167
Taft, TX 78390
|
- sq. feet
|
- baths - beds |
show details | |

|
#36
Hiawatha St
Corpus Christi, TX 78405
|
1,026 sq. feet
|
- baths - beds |
show details | |

|
#37
County Road 2763
Sinton, TX 78387
|
- sq. feet
|
- baths - beds |
show details | |

|
#38
Pvt Rd 2213
Sinton, TX 78387
|
- sq. feet
|
- baths - beds |
show details | |

|
#39
Domingo Dr
Sinton, TX 78387
|
- sq. feet
|
- baths - beds |
show details | |

|
#40
County Road 2567
Sinton, TX 78387
|
- sq. feet
|
- baths - beds |
show details |
| Photo | Address | Area | Beds / Baths | Price | Details |
|---|---|---|---|---|---|

|
#41
County Road 1478
Odem, TX 78370
|
- sq. feet
|
- baths - beds |
show details | |

|
#42
County Road 1694
Odem, TX 78370
|
- sq. feet
|
- baths - beds |
show details | |

|
#43
County Road 908
Sinton, TX 78387
|
- sq. feet
|
- baths - beds |
show details | |

|
#44
County Road 908
Sinton, TX 78387
|
- sq. feet
|
- baths - beds |
show details | |

|
#45
Marguerite St
Corpus Christi, TX 78405
|
748 sq. feet
|
- baths - beds |
show details | |

|
#46
N Upper Broadway St Apt 605
Corpus Christi, TX 78401
|
- sq. feet
|
- baths - beds |
show details | |

|
#47
Kingwood Dr
Corpus Christi, TX 78410
|
1,360 sq. feet
|
- baths - beds |
show details | |

|
#48
Bartlett Dr
Corpus Christi, TX 78408
|
1,482 sq. feet
|
- baths - beds |
show details | |

|
#49
Gibson Ln
Corpus Christi, TX 78406
|
672 sq. feet
|
- baths - beds |
show details | |

|
Check over 1 million property listings on Foreclosure.com!
|
browse all offers | |||


Household type by relationship:
Households: 64,124- In family households: 57,258 (11,820 male householders, 5,119 female householders)
12,214 spouses, 21,063 children (19,231 natural, 416 adopted, 1,416 stepchildren), 2,849 grandchildren, 553 brothers or sisters, 522 parents, foster children, 887 other relatives, 1,544 non-relatives
- In nonfamily households: 6,866 (2,848 male householders (2,285 living alone)), 2,850 female householders (2,477 living alone)), 1,168 nonrelatives
- In group quarters: 680 (638 institutionalized population)
13,849 married couples with children.
4,152 single-parent households (1,138 men, 3,014 women).
42.1% of residents of Del Sol-Loma Linda speak English at home.
57.9% of residents speak Spanish at home (67% speak English very well, 26% speak English well, 6% speak English not well, 2% don't speak English at all).
Foreign born population: 132 (17.6%)
(33.3% of them are naturalized citizens)
| Here: | 4.6 |
| State: | 6.3 |
| Here: | 2.2 |
| State: | 4.0 |

- Bedrooms in owner-occupied houses and condos in Del Sol-Loma Linda, Texas
- 11no bedroom
- 161 bedroom
- 572 bedrooms
- 723 bedrooms
- 284 bedrooms
- 05+ bedrooms

- Bedrooms in renter-occupied apartments in Del Sol-Loma Linda, Texas
- 10no bedroom
- 41 bedroom
- 92 bedrooms
- 113 bedrooms
- 04 bedrooms
- 05+ bedrooms

- Cars and other vehicles available in Del Sol-Loma Linda in owner-occupied houses/condos
- 16no vehicle
- 731 vehicle
- 762 vehicles
- 193 vehicles
- 04 vehicles
- 05+ vehicles

- Cars and other vehicles available in Del Sol-Loma Linda in renter-occupied apartments
- 0no vehicle
- 101 vehicle
- 242 vehicles
- 03 vehicles
- 04 vehicles
- 05+ vehicles

- Rooms in owner-occupied houses in Del Sol-Loma Linda, Texas
- 111 room
- 72 rooms
- 93 rooms
- 604 rooms
- 585 rooms
- 316 rooms
- 87 rooms
- 08 rooms
- 09+ rooms

- Rooms in renter-occupied apartments in Del Sol-Loma Linda, Texas
- 101 room
- 42 rooms
- 93 rooms
- 04 rooms
- 115 rooms
- 06 rooms
- 07 rooms
- 08 rooms
- 09+ rooms


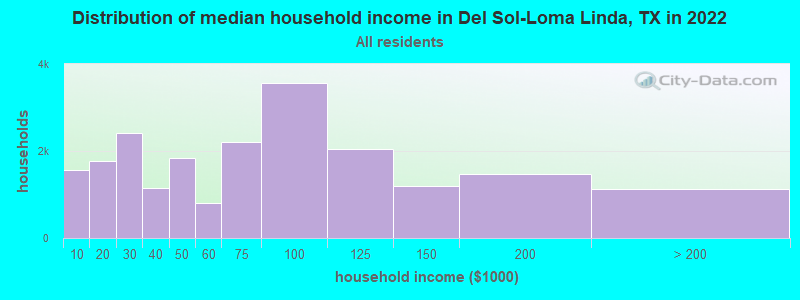
Del Sol-Loma Linda, TX household income distribution

- 1,560Less than $10,000
- 1,762$10,000 to $19,999
- 2,424$20,000 to $29,999
- 1,142$30,000 to $39,999
- 1,828$40,000 to $49,999
- 794$50,000 to $59,999
- 2,197$60,000 to $74,999
- 3,565$75,000 to $99,999
- 2,035$100,000 to $124,999
- 1,192$125,000 to $149,999
- 1,479$150,000 to $199,999
- 1,123$200,000 or more
Percentage of workers working in this county: 50.0%
Number of people working at home: 36 (11.0% of all workers)
Travel time to work (commute)
- Less than 5 minutes: 20
- 5 to 9 minutes: 17
- 10 to 14 minutes: 18
- 15 to 19 minutes: 28
- 20 to 24 minutes: 9
- 25 to 29 minutes: 0
- 30 to 34 minutes: 11
- 35 to 39 minutes: 14
- 40 to 44 minutes: 10
- 45 to 59 minutes: 58
- 60 to 89 minutes: 13
- 90 or more minutes: 27
Means of transportation to work:
- Drove a car alone: 146 (61.1%)
- Carpooled: 57 (23.8%)
- Walked: 9 (3.8%)
- Other means: 13 (5.4%)
- Worked at home: 14 (5.9%)


- Year of entry for the foreign-born population in Del Sol-Loma Linda, Texas
- 31995 to March 2000
- 01990 to 1994
- 41985 to 1989
- 281980 to 1984
- 171975 to 1979
- 71970 to 1974
- 01965 to 1969
- 0Before 1965

First ancestries reported:
- Other: 563 (86.9%)
- United States: 61 (9.4%)
- German: 24 (3.7%)
Most common places of birth for foreign-born residents (%):
| Del Sol-Loma Linda: | 100.0% (59) |
| Texas: | 64.8% (1,879,369) |
Place of birth for U.S.-born residents:
- This state: 593
- Other state: 68
- Northeast: 0
- Midwest: 20
- South: 11
- West: 37
80% of Del Sol-Loma Linda residents lived in the same house 5 years ago.
Out of people who lived in different houses, 40% lived in this county.
Out of people who lived in different counties, 73% lived in Texas.
Education attainment for males 25 years and older:
- No schooling: 0
- Nursery to 4th grade: 9
- 5th and 6th grade: 41
- 7th and 8th grade: 0
- 9th grade: 8
- 10th grade: 35
- 11th grade: 15
- 12th grade, no diploma: 0
- High school graduate (or equivalency): 91
- Less than 1 year of college: 8
- Some college more than 1 year, no degree: 14
- Associate degree: 0
- Bachelor's degree: 0
- Master's degree: 0
- Professional school degree: 0
- Doctorate degree: 0

Education attainment for females 25 years and older:
- No schooling: 10
- Nursery to 4th grade: 21
- 5th and 6th grade: 12
- 7th and 8th grade: 27
- 9th grade: 7
- 10th grade: 51
- 11th grade: 9
- 12th grade, no diploma: 0
- High school graduate (or equivalency): 36
- Less than 1 year of college: 15
- Some college more than 1 year, no degree: 9
- Associate degree: 7
- Bachelor's degree: 19
- Master's degree: 0
- Professional school degree: 0
- Doctorate degree: 0


Housing units in structures:
- One, detached: 138
- Two: 8
- Mobile homes: 84
Median worth of mobile homes: $61,771
Housing units lacking complete kitchen facilities: 9.1%

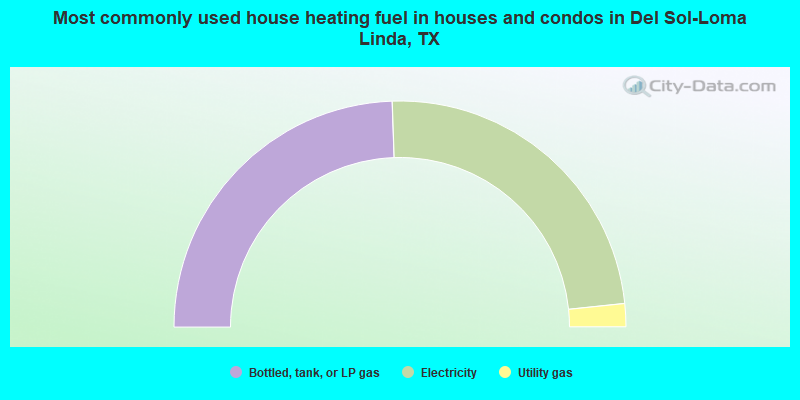
- 48.9%Bottled, tank, or LP gas
- 47.8%Electricity
- 3.3%Utility gas

- 70.6%Electricity
- 29.4%Bottled, tank, or LP gas
Private vs. public school enrollment:
| Here: | 0.0% |
| Texas: | 6.8% |
| Here: | 0.0% |
| Texas: | 6.2% |


